
|
|
1.IntroductionInsect infestations and disease outbreaks often begin as localized phenomena, but given suitable environmental conditions, have the potential to cause widespread forest mortality over large areas.1 Approximately 37 million hectares of global forests were impacted by pests and disease between 1998 and 2002, representing 1.4% of global forest cover.2 Forest health monitoring requires spatially explicit information on the damaging agent, and the location, extent, magnitude, and nature of the disturbance.3 These data are used to determine appropriate management strategies to treat or reduce the impact of disturbances. As mitigation options and the success of mitigation outcomes are improved with early detection and treatment,3 forest health protection programs are often designed and implemented to monitor and detect disturbances at the level of the individual tree or forest stand. In most countries, forest health information is obtained informally, with the presence of pests and diseases determined through serendipitous field observations.2 Routine forest health monitoring, often implemented using systematic aerial surveys conducted over large areas, are commonplace in the United States4 and in some provincial jurisdictions in Canada,5 enabling the rapid and efficient acquisition of landscape-level data over forested areas. Remotely sensed imagery has been used to detect and monitor disturbances caused by forest pests and diseases.3,5,6 Stand and tree-level characterizations have been enabled through parallel advancements in the spatial resolution of both satellite and airborne sensors. The spatial resolution of commercial spaceborne high spatial resolution sensors has increased (available at for panchromatic imagery and 2 to 4 m for multispectral imagery), as has the spatial resolution of airborne imagery (both panchromatic and color can now be acquired at the centimeter level). These advancements in spatial resolution enable the detection of very small objects in forests, such as groups of trees, and individual tree crowns. Traditionally, conventional aerial photography has formed the basis of forest health monitoring programs;3 however, as high spatial resolution satellite data become more widely available, it is increasingly being used for forest health applications.7–9 Digital camera technology, and associated enabling systems, has developed rapidly in the last decade, allowing for the acquisition of high spatial resolution digital aerial imagery. This digital aerial imagery has the potential to fulfill a broad range of forest health information needs, particularly those that require tree-level or detailed stand-level data. This communication focuses on the use of high spatial digital aerial imagery in a forest health monitoring context. Our goal is to demonstrate how high spatial resolution digital aerial imagery can support detailed forest health monitoring information requirements and provide a low-cost, flexible complement and source of calibration and validation data for other, coarser surveys and data sources. The requisite properties of digital aerial imagery for forest health applications are considered, and a detailed review of the use of digital aerial imagery in the context of the current mountain pine beetle outbreak in western Canada is presented. 2.Properties of Digital Aerial ImagerySmall-format digital cameras were first made commercially available in the early 1990s and are now widely available and increasingly affordable.10 Small-format digital cameras typically record images using either a charge couple device (CCD) or a complementary metal-oxide semiconductor (CMOS). Ongoing advances in the development of these semiconductors has a direct impact on the number of pixels, and hence the resolution of these cameras.11 One of the main advantages of digital aerial imagery is its digital format, which negates the need to develop film and subsequently digitize data, both of which constitute a significant amount of time and expense when processing aerial photos.10,12 However, one of the disadvantages of digital aerial imagery is the relatively small spatial extent of each image, which can make data management, processing, and analyses challenging. To overcome this, individual image tiles are often mosaicked, resulting in a seamless image product over the area of interest. Another disadvantage associated with digital high spatial resolution aerial imagery is related to file size: The information rich nature of digital images can result in large file sizes that require considerable storage space. Notwithstanding these limitations, the storage of digital data is less expensive and more amenable to retrieval and archiving than conventional film products. Table 1 summarizes the properties of digital aerial imagery that should be considered in the context of forest health monitoring. For comparative purposes, the properties of satellite high spatial resolution imagery are also provided. These properties are discussed in greater detail in the following sections. Table 1Factors to be considered in the selection of appropriate high spatial resolution imagery for forest disturbance monitoring.
2.1.Spectral and Spatial PropertiesDigital camera manufacturers are producing increasingly higher resolution cameras; currently, off-the-shelf small-format digital cameras range from 12 to 60 megapixels.11 These area-array digital camera systems produce frame images that can be processed using standard digital photogrammetric software (once the camera has been calibrated). Generally, digital cameras have less color bias than film cameras as they consistently record imagery at the same color values, have a dynamic range of 10 to 11 -stops (that is, analogous to integration time of digital sensors), while film cameras have a range of 4 to 5 -stops.13 Most digital systems have a 12-bit dynamic range and can produce multispectral color imagery at wavelengths ranging from blue to near-infrared, for the production of normal color or color infrared images. Filters can also be fitted to provide more narrow regions of the electromagnetic spectrum that can be especially useful for detecting specific types of forest health problems. Digital images may be spectrally enhanced10,13 and some of the indices (i.e., ratio of red to green bands) and analysis methods developed for use with satellite remotely sensed imagery may also be implemented using digital aerial imagery.14,15 The spatial resolution of digital aerial imagery depends on the camera used and the altitude of the aircraft at the time of image acquisition. The size of an individual cell and the number of cells contained in the camera’s CCD or CMOS area array provides an indication of the potential spatial resolution of the imagery: as the number of cells increases, the potential spatial resolution will be greater.11 When flying low and slow, pixel sizes on the order of 5 and 10 cm are possible, enabling detailed tree-level information to be generated. 2.2.Data AcquisitionAerial imaging platforms are typically modular and can be configured into a system that is best suited to a particular application. Two or more digital cameras can be used to capture different spectral imagery simultaneously (i.e., normal color and infrared) or multiple identical digital cameras may be configured in an array at offset angles to maximize spatial coverage of a flight line. A typical setup for airborne acquisition would include a laptop for flight control, camera control, and image storage, an anti-vibration mount, a global positional system (GPS), and an inertial navigation system (INS).11 Digital aerial imagery is acquired from aircraft similar to those used during aerial surveys (i.e., manual capture of forest damage by an interpreter in the aircraft), which are flown at altitudes of between 300 and 2000 m above the ground.13,16 Initial tests with digital cameras yielded high quality images that looked similar to a 35 mm film photo, and had the potential to meet resource management needs.13 In early applications of digital aerial imagery, spatial resolution and the capacity for storage were relatively low; however, advances in technology have dramatically increased the resolution and storage capacity of digital cameras. Obtaining aerial imagery is generally more flexible in acquisition terms than satellite imagery, since real-time decisions can be made on how, where, and when to acquire imagery. The flexibility of aerial data collection allows for alterations to flight plans to take advantage of, or respond to, changing weather conditions, thereby increasing the likelihood that data can be acquired during specific forest health bio-windows, (when visible symptoms of infestation or disease are most pronounced).5,7 This acquisition flexibility is especially useful in areas that are difficult to image using satellite-based sensors as a result of frequent cloud cover, since airborne sensors are able to fly below the cloud to acquire imagery (under uniform cloud cover and lighting conditions). The acquisition of digital aerial imagery can easily be tailored to meet the needs of the end user, with the additional advantage of real-time viewing, such that acquisition parameters can be fine-tuned to ensure the best possible imagery for the end user. For aerial acquisitions, there are some additional costs and operational factors to consider including: costs for fuel and time to ferry the aircraft to the target area; scheduling (amount of notice to data provider and wait time for clear weather); sensor type (dictated by information need) and availability; and target area size and resolution (time required for data acquisition). Other costs can include obtaining ground control data, as well as orthorectification, color balancing, and mosaicking of the imagery. 2.3.PostprocessingDigital aerial imagery usually requires more intensive processing than satellite imagery to generate a geometrically correct data product, although current computing capabilities have alleviated some of the challenges associated with this process.7 Furthermore, advances in GPS, which provide the image ground location; inertial measurement units (IMU), which account for aircraft pitch, roll, and yaw, and record the location and exterior orientations of each photo capture to automate the aerial triangulation of the photos into orthophoto mosaics; and flight management systems, which control the camera(s) in order to capture imagery at exact photo overlaps, have all improved the geometric fidelity of digital aerial imagery.10,11 3.Methods for Extracting Information from Digital Aerial ImageryInterpretation methods for extracting information from digital aerial imagery have generally advanced from visual and manual approaches, to automated pixel-based classifiers, and more recently complex object-based approaches.17 Manual interpretation of digital aerial imagery is analogous to the approach followed using traditional aerial photography: features of interest are delineated and attributed by considering the tone or color, size, shape, pattern, texture, shadows, site, and context of the features of interest.18 The manual approach relies on the interpreter’s existing knowledge of an area to aid in analysis and although it can be sufficiently accurate for forest health applications, the manual approach can also be expensive, subjective, and time consuming. Furthermore, there is a shortage of well-trained and experienced interpreters, especially those who have spent years in field who can provide their skills for photo interpretation.15 Automated approaches to information extraction from digital aerial imagery are either pixel-based or object-based. Pixel-based approaches can be supervised or unsupervised and can provide a rapid, systematic, consistent, and repeatable method for identifying certain forest health problems. However, the variance rich environment of digital aerial imagery creates difficulties for pixel-based classifiers: individual objects are composed of many pixels; for instance, a tree crown would have sunlit and shaded canopy and sunlit and shaded background. A pixel-based classifier would place all the crown features into different classes, requiring postclassification merging (if possible) or resulting in an ineffectual classification.7 As an alternative, object-based classification offers a means to group pixels into objects based upon homogeneity criteria, whereby spectral values within the image are used in concert with other interpretation characteristics (such as tone, texture, shape) for multiple pixels, to identify features of interest. Object-based classifiers are systematic, consistent, repeatable, and also allow the incorporation of multiple scales of imagery.19 The object-based approach is well suited to very high spatial digital aerial imagery as pixels can be grouped meaningfully into objects.7,19–21 4.Digital Aerial Imagery for Monitoring Mountain Pine Beetle Damage to ForestsThe cumulative forest area impacted by the recent mountain pine beetle epidemic in western Canada has exceeded 17.5 million hectares and drawn significant attention.22 When a host tree is killed by mountain pine beetle, the tree’s crown will fade to red (known as red attack stage), and eventually, the dead tree will shed its needles (known as grey attack stage). This characteristic change in the color of the tree crown makes mountain pine beetle damage well-suited to detection with a variety of remote sensing instruments. High spatial resolution satellite imagery has been used to provide stand-level information for mountain pine applications, including mortality mapping8,14,23–25 and assessing changes in the location and extent of infestations over time.26 High spatial resolution digital aerial imagery has also been used for a range of information needs: observing damage over large areas or to individual trees,27,28 mapping the spread of infestations and estimating the severity of attack,28,29 and determining environmental conditions that enable attack.29 Digital aerial imagery can be used to verify ground-based estimates of mortality and extend those estimates across larger areas.27,28 Given the capacity to resolve individual tree crowns with high resolution digital aerial imagery (Fig. 1), tree attributes such as crown size, foliage area, and inference of diameter at breast height can be derived, over a range of accuracies, for all the trees on an image, rather than for small sample plots.29 Tree species can be identified or inferred, enabling estimates of the population-at-risk to infestation. In addition, stand conditions can be examined to determine what, if any, forest management practices have been applied to the stand. Digital aerial imagery can be used in sampling schemes to determine attributes such as the number of infested trees in an area28 or the rate of population growth.30 Furthermore, this imagery can serve as an important source of calibration and validation data for map products generated from lower spatial resolution data sources8,27,31 or as inputs to insect-spread models.29 Finally, digital high spatial resolution imagery provides a permanent record of stand conditions that can subsequently be interrogated for retrospective analyses26,27 or for other applications. Fig. 1A sample of VHSR airborne imagery showing various stages of mountain pine beetle infestation (as manifested in the color of the crown). Once a tree is killed by mountain pine beetle, the foliage will gradually fade from green (green-attack stage) to greenish-yellow (faders) to red (red-attack stage) over the spring and summer following attack. The needles will slowly drop until the tree is completely defoliated (gray-attack stage). 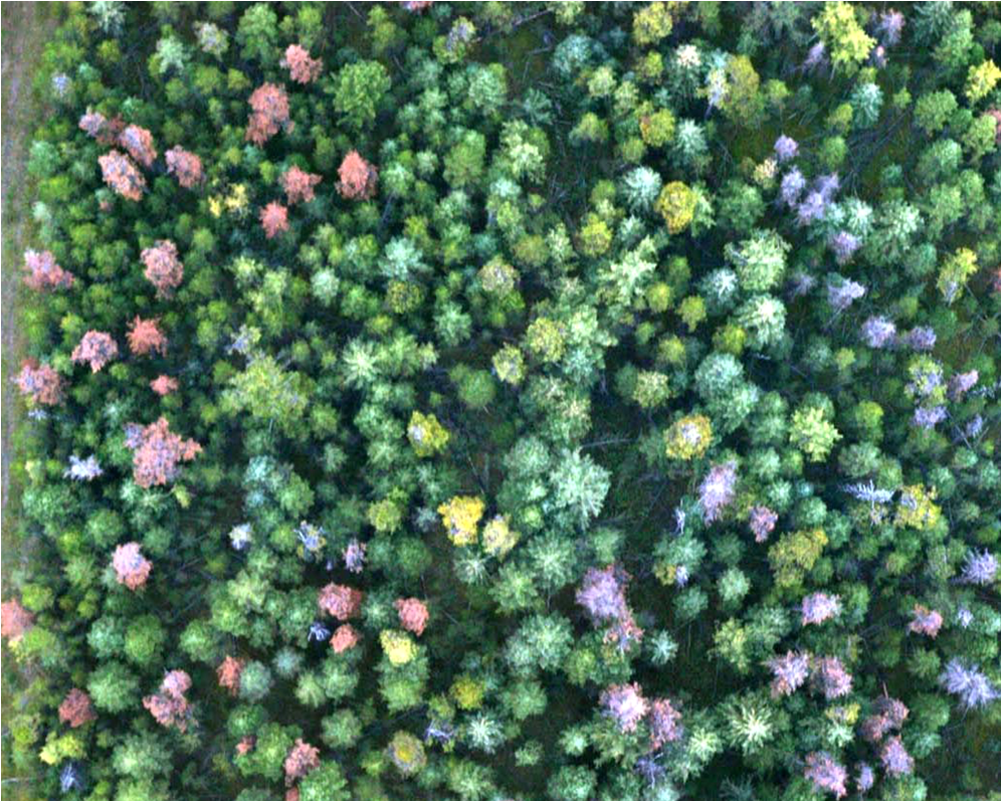 High spatial resolution digital aerial imagery (30 cm) has been used to map different stages of mountain pine beetle mortality (red- and gray-attack).14 One of the objectives of this work was to assess the impact of image resolution on automated pixel-based classifiers through the systematic degradation of image resolution. The authors found that the pixel-based methods performed poorly on the 30 cm imagery, with the greatest accuracy (90%) found for an image resolution of 2.4 m.14 This result should not be surprising given that past research has indicated the superiority of object-based methods for high spatial resolution imagery.7,19 Moreover, a resolution of 2.4 m is likely insufficient for generating the detailed tree-level information required for many mountain pine beetle applications. Finally, although the authors were able to distinguish between different stages of mortality, the error of commission for gray attack was very large (35.2% to 57.1%). Such false positives are more problematic than omission errors in the context of suppression or management activities as limited resources may be misdirected to these areas.18 Digital aerial imagery acquired in successive years provides an important archival record of changes in forest health over time. Such data have been used to assess the growth and spread of mountain pine beetle infestations and can support future reporting requirements and retrospective analyses. Mountain pine beetle population trends are expressed through the green attack to red attack ratio (), which compares the number of current successfully attacked trees () to trees successfully attacked in the previous year (). In retrospective analyses, the ratio derived from high spatial resolution imagery can be used to assess the efficacy of mitigation activities26,27,32 and archived imagery can be used to support these analyses. For example, three successive years of high spatial resolution digital aerial imagery from 2006 to 2008 were used to monitor the changes in the ratio, and make inferences on the impacts of mitigation activities.27 Since the red attack stage trees identified in 2007 and 2008 can be back-cast as green attack in 2006 and 2007, respectively, this enables the estimation of for 2006 and 2007. Infested trees were manually interpreted on each image and ratios defined over the monitoring period. The ratios indicated that mitigation slowed the rate of population growth, with the population of beetle found to be decreasing or stable over sites A and B as long as mitigation was continued. Once mitigation was discontinued over site A, the increased, compared to decrease in at site B, where mitigation was ongoing. Estimation and observation of the status and change in ratios over time enable insights on the nature of infestation development and dynamics.26,27,33 Adaptive cluster sampling has been used to determine .28,29 In both studies, samples of digital aerial imagery with a 20 cm resolution, acquired over two years, and an adaptive cluster sampling approach were used to identify areas of infestation at two study sites at the leading edge of the current infestation. A grid was overlaid on a mosaicked image of the study area (approximately ). Transect lines were randomly positioned within the grid and mountain pine beetle infested trees automatically delineated with an object-based classification approach. In the first study, estimates of the mean, variance, and confidence intervals for the number of infested trees, as well as the rate of infestation expansion were calculated.28 The infestation at both sites was found to have approximately doubled in a single year. In the second study, the adaptive cluster sampling approach was compared to a nonadaptive approach. The adaptive approach was found to be twice as efficient at identifying infested trees as the nonadaptive approach and is particularly well-suited to identifying low levels of attack at the leading edge of the infestation.29 High spatial resolution digital aerial imagery is well suited to adaptive cluster sampling with a line transect approach, since imagery is often acquired along flight lines. Contrast this to the logistics of attempting to acquire imagery for a random sample of locations distributed along the leading edge of the infestation. Digital aerial imagery offers the capacity to routinely collect tree level information on attacked trees, which are useful in an annual monitoring program. Such imagery can be used to detect and extrapolate tree-level information on mountain pine beetle red attack damage and rates of change in mountain pine beetle populations to large areas. A prototype monitoring system was designed to capture conditions in 2006 and 2007 at a location on the leading edge of the mountain pine beetle infestation in northern British Columbia and incorporated field measures, high spatial resolution digital aerial imagery (10 and 40 cm), and high spatial resolution satellite imagery (QuickBird).33 As persistent cloud cover precluded the collection of QuickBird imagery for the study area in 2007, the 40 cm digital aerial imagery was acquired on short notice and was used as a surrogate for the QuickBird. Digital aerial imagery was vital to the development of the monitoring prototype as it enabled sufficiently detailed tree-level information to be generated over a large area. A double sampling approach was used to build a regression model between mortality estimates from the digital aerial imagery and estimates from the QuickBird satellite imagery, which in turn was used to adjust the estimates of mortality over a larger area. The advantage of such an approach is that expensive data collection methods, such as ground sampling are minimized, while the estimates from the relatively lower cost, large-area data sources, such as satellite imagery, are optimized. The use of 10 cm digital aerial imagery to generate plot-level stem maps has been demonstrated.29 From these stem maps, a range of plot-level and individual tree-level attributes were estimated and compared to field measures. Stocking density (, standard , ) and stem diameter (, standard , ) were found to be sufficiently correlated with field measures and were used as inputs to an infestation spread model. One of the advantages of digital aerial imagery for this purpose over conventional ground data is the fact that imagery captures both infested and uninfested areas, providing an indication of the population-at-risk, as well as the spatial context of the infestation. Finally, digital aerial imagery can also be combined with other data sources, such as light detection and ranging (lidar) data, to estimate forest attributes and the condition of attacked trees. A combination of digital aerial imagery and lidar data was used to estimate the volume of lodgepole pine killed by a mountain pine beetle infestation.34 Following a sampling approach, Fifty-five 0.25 ha photo plots were established and the lidar data were used to estimate volume, while the imagery was used to indicate the health status of individual trees within the plot. At the plot level, mountain pine beetle was estimated to have killed approximately of standing timber (standard deviation of ) or per hectare (with a standard deviation of per hectare), which represents 42% of the lodgepole pine in the study area. The synergy between different data types, as demonstrated in this study, enables more refined estimates of tree volume lost to mountain pine beetle, which are currently estimated using relatively coarse strategic data sets. 5.SummaryIn summary, we have identified that high spatial resolution digital aerial imagery has some specific advantages over conventional aerial photography and satellite remote sensing and can offer complementary information for forest health monitoring. Moreover, the acquisition of high spatial digital aerial imagery with small-format digital cameras is cost effective when compared to extensive ground data collection. Digital aerial imagery, particularly color or infrared imagery, may be acquired with higher spatial resolutions than is possible with current earth-imaging satellites. As highlighted in this communication, the detail afforded by high spatial digital aerial imagery can support a broad range of information needs associated with forest health monitoring and can serve as a proxy for ground data or high spatial resolution satellite data when collection of either of these data are precluded by cost or logistical constraints. In an era when research is focused on increasingly higher spatial resolution satellite imagery, the utility of digital aerial imagery for forest health monitoring should not be disregarded. AcknowledgmentsSuggestions provided by three anonymous reviewers on an earlier version of this manuscript are gratefully acknowledged. This project was partially funded by the Government of Canada through the Mountain Pine Beetle Program, a three-year, $100 million program administered by Natural Resources Canada, Canadian Forest Service ( http://mpb.cfs.nrcan.gc.ca/). ReferencesD. L. UrbanR. V. O’NeillH. H. Shugart,
“Landscape ecology,”
Bioscience, 37
(2), 119
–127
(1987). http://dx.doi.org/10.2307/1310366 BISNAS 0006-3568 Google Scholar
Global Review of Forest Pests and Diseases, 235 United Nations Food and Agriculture Organisation, United Nations Food and Agriculture Organization, Rome, Italy
(2009). Google Scholar
W. M. Ciesla,
“Remote sensing in forest health protection,”
(2000). Google Scholar
E. W. JohnsonD. Wittwer,
“Aerial detection surveys in the United States,”
Aust. Forest., 71
(3), 212
–215
(2008). 0004-9158 Google Scholar
M. A. Wulderet al.,
“Surveying mountain pine beetle damage of forests: a review of remote sensing opportunities,”
Forest Ecol. Manag., 221
(1–3), 27
–41
(2006). http://dx.doi.org/10.1016/j.foreco.2005.09.021 FECMDW 0378-1127 Google Scholar
J. R. Riley,
“Remote sensing in entomology,”
Annu. Rev. Entomol., 34 247
–271
(1989). http://dx.doi.org/10.1146/annurev.en.34.010189.001335 ARENAA 0066-4170 Google Scholar
M. A. Wulderet al.,
“High spatial resolution remotely sensed data for ecosystem characterization,”
Bioscience, 54
(6), 511
–521
(2004). http://dx.doi.org/10.1641/0006-3568(2004)054[0511:HSRRSD]2.0.CO;2 BISNAS 0006-3568 Google Scholar
J. C. Whiteet al.,
“Detection of red attack stage mountain pine beetle infestation with high spatial resolution satellite imagery,”
Rem. Sens. Environ., 96
(3–4), 340
–351
(2005). http://dx.doi.org/10.1016/j.rse.2005.03.007 RSEEA7 0034-4257 Google Scholar
M. A. Wulderet al.,
“Multi-temporal analysis of high spatial resolution imagery for disturbance monitoring,”
Rem. Sens. Environ., 112
(6), 2729
–2740
(2008). http://dx.doi.org/10.1016/j.rse.2008.01.010 RSEEA7 0034-4257 Google Scholar
R. W. GrahamJ. P. Mills,
“Small-format digital cameras for aerial survey: where are we now?,”
Photogramm. Rec., 16
(96), 905
–909
(2000). http://dx.doi.org/10.1111/phor.2000.16.issue-96 PGREAY 0031-868X Google Scholar
G. PetrieA. S. Walker,
“Airborne digital imaging technology: a new overview,”
Photogramm. Rec., 22
(119), 203
–225
(2007). http://dx.doi.org/10.1111/phor.2007.22.issue-119 PGREAY 0031-868X Google Scholar
T. NelsonM. WulderK. O. Niemann,
“Spatial resolution implications of digitizing aerial photography for environmental applications,”
J. Imag. Sci., 49 223
–232
(2001). JISCEJ 8750-9237 Google Scholar
T. J. BobbeM. L. HoppusD. T. Evans,
in Remote Sensing Ecology and Management. Proc. of the Fifth Forest Service Remote Sensing Applications Conf.,
378
(1994). Google Scholar
A. J. H. MeddensJ. A. HickeL. A. Vierling,
“Evaluating the potential of multispectral imagery to map multiple stages of tree mortality,”
Rem. Sens. Environ., 115
(7), 1632
–1642
(2011). http://dx.doi.org/10.1016/j.rse.2011.02.018 RSEEA7 0034-4257 Google Scholar
J. L. MorganS. E. GergelN. C. Coops,
“Aerial photography: a rapidly evolving tool for ecological management,”
BioScience, 60
(1), 47
–59
(2010). http://dx.doi.org/10.1525/bio.2010.60.1.9 BISNAS 0006-3568 Google Scholar
K. A. KnappA. DisperatiZ. J. Sheng,
in Natural Resource Management Using Remote Sensing and GIS: Proc. of the Seventh Forest Service Remote Sensing Applications Conf.,
257
–268
(1998). Google Scholar
M. A. Wulderet al.,
“Towards automated segmentation of forest inventory polygons on high spatial resolution satellite imagery,”
Forest. Chron., 84
(2), 221
–230
(2008). FRCRAX 0015-7546 Google Scholar
T. M. LillesandR. W. KieferJ. W. Chipman, Remote Sensing and Image Interpretation, 5th EditionJohn Wiley and Sons, New York
(2004). Google Scholar
G. J. Hayet al.,
“An automated object-based approach for the multiscale image segmentation of forest scenes,”
Int. J. Appl. Earth Observation Geoinformation, 7
(4), 339
–359
(2005). http://dx.doi.org/10.1016/j.jag.2005.06.005 Google Scholar
P. BuntingR. Lucas,
“The delineation of tree crowns in Australian mixed species forests using hyperspectral Compact Airborne Spectrographer Imager (CASI) data,”
Rem. Sens. Environ., 101
(2), 230
–248
(2006). http://dx.doi.org/10.1016/j.rse.2005.12.015 RSEEA7 0034-4257 Google Scholar
D. A. Culvenor,
“TIDA: an algorithm for the delineation of tree crowns in high spatial resolution remotely sensed imagery,”
Comput. Geosci., 28
(1), 33
–44
(2002). http://dx.doi.org/10.1016/S0098-3004(00)00110-2 CGEODT 0098-3004 Google Scholar
N. C. Coopset al.,
“Assessment of QuickBird high spatial resolution imagery to detect red attack damage due to mountain pine beetle infestation,”
Rem. Sens. Environ., 103
(1), 67
–80
(2006). http://dx.doi.org/10.1016/j.rse.2006.03.012 RSEEA7 0034-4257 Google Scholar
J. A. HickeJ. Logan,
“Mapping whitebark pine mortality caused by a mountain pine beetle outbreak with high spatial resolution satellite imagery,”
Int. J. Rem. Sens., 30
(17), 4427
–4441
(2009). http://dx.doi.org/10.1080/01431160802566439 IJSEDK 0143-1161 Google Scholar
P. E. DennisonA. R. BrunelleV. A. Carter,
“Assessing canopy mortality during a mountain pine beetle outbreak using GeoEye-1 high spatial resolution satellite data,”
Rem. Sens. Environ., 114
(11), 2431
–2435
(2010). http://dx.doi.org/10.1016/j.rse.2010.05.018 RSEEA7 0034-4257 Google Scholar
M. A. Wulderet al.,
“Multi-temporal analysis of high spatial resolution imagery for disturbance monitoring,”
Rem. Sens. of Environ., 112
(6), 2729
–2740
(2008). http://dx.doi.org/10.1016/j.rse.2008.01.010 RSEEA7 0034-4257 Google Scholar
M. A. Wulderet al.,
“Monitoring the impacts of mountain pine beetle mitigation,”
Forest Ecol. Manag., 258
(7), 1181
–1187
(2009). http://dx.doi.org/10.1016/j.foreco.2009.06.008 FECMDW 0378-1127 Google Scholar
S. B. CogginsN. C. CoopsM. A. Wulder,
“Estimates of bark beetle expansion factors with adaptive cluster sampling,”
Int. J. Pest Manag., 57
(1), 11
–21
(2011). http://dx.doi.org/10.1080/09670874.2010.505667 IPEMEH Google Scholar
S. B. CogginsN. C. CoopsM. A. Wulder,
“Initialisation of an insect infestation spread model using tree structure and spatial characteristics derived from high spatial resolution digital aerial imagery,”
Can. J. Rem. Sens., 34
(6), 485
–502
(2008). http://dx.doi.org/10.5589/m08-073 CJRSDP 0703-8992 Google Scholar
S. B. CogginsN. C. CoopsM. A. Wulder,
“Improvement of low level bark beetle damage estimates with adaptive cluster sampling,”
Silva Fennica, 44
(2), 289
–301
(2010). 0037-5330 Google Scholar
M. A. Wulderet al.,
“Augmenting the existing survey hierarchy for mountain pine beetle red attack damage with satellite remotely sensed data,”
Forest. Chronicle, 82
(2), 187
–202
(2006). FRCRAX 0015-7546 Google Scholar
S. B. Cogginset al.,
“Comparing the impacts of mitigation and non-mitigation on mountain pine beetle populations,”
J. Environ. Manag., 92
(1), 112
–120
(2011). http://dx.doi.org/10.1016/j.jenvman.2010.08.016 JEVMAW 0301-4797 Google Scholar
M. A. Wulderet al.,
“Monitoring tree-level insect population dynamics with multi-scale and multi-source remote sensing,”
J. Spatial Sci., 53
(1), 49
–61
(2008). http://dx.doi.org/10.1080/14498596.2008.9635135 Google Scholar
C. W. Bateret al.,
“Integration of lidar and digital aerial imagery for detailed estimates of lodgepole pine (Pinus contorta) volume killed by mountain pine beetle (Dendroctonus ponderosae),”
J. Forest., 108
(3), 111
–119
(2010). JFUSAI 0022-1201 Google Scholar
Biography |
||||||||||||||||||||||||||||||||||||


