|
|
1.IntroductionRecently, automatic detection of people and understanding their behavior from images became a very important research field, since it can provide crucial information, especially for police departments and crisis management teams. Detecting the amount of people and understanding their moving directions and speeds can be used for detecting or predicting abnormal situations. In addition, it can also help to estimate locations where a crowd will congregate, which gives an idea about future status of underground passages, entrances of mass events, or the density of people in streets, which can also affect traffic. Because of the importance of the topic, many researchers tried to monitor people using street or indoor cameras, which are also known as close-range cameras. However, most of the previous studies aimed to detect boundaries of large groups and extract information about them. The early studies in this field were developed from closed-circuit television images.1–3 These cameras can monitor only a few square meters in indoor regions, and it is not possible to adapt the developed algorithms to street or airborne cameras, since the human face and body contours will not appear as clearly owing to resolution and scale differences. To be able to monitor bigger events, researchers tried to develop algorithms that can work on outdoor camera images or video streams. Arandjelovic4 developed a local interest point extraction–based crowd detection method to classify single terrestrial images as crowd and noncrowd regions. They observed that dense crowds produce a high number of interest points. Therefore, they used density of scale-invariant feature transform features for classification. After generating crowd and noncrowd training sets, they used support vector machine (SVM)-based classification to detect crowds. They obtained scale-invariant and good results in terrestrial images. Unfortunately, these images do not enable monitoring of large events, and different crowd samples should be detected beforehand to train the classifier. Ge and Collins5 proposed a Bayesian marked point process to detect and count people in single images. They used football match images and street camera images for testing their algorithm. The method requires clear detection of body boundaries, which is not possible in airborne images. In another study, Ge and Collins6 used multiple close-range images taken at the same time from different viewing angles. They used three-dimensional heights of the objects to detect people on streets. Unfortunately, it is not always possible to obtain these multiview close-range images for the street where an event occurs. Lin et al.7 wanted to obtain quantitative measures about crowds using single images. They used Haar wavelet transform to detect head-like contours, and then using SVM they classified detected contours as head or nonhead regions. They provided quantitative measures about number of people in crowds and sizes of crowds. Although results are promising, this method requires clear detection of human head contours and training of the classifier. In any case, street cameras have only a limited coverage area to monitor large outdoor events. In addition to that, in most cases, no cameras are installed to obtain close-range street images or video streams in the place where an event occurs. Therefore, to get image data of large groups of people in very big outdoor events, the best way is to use airborne images, which began to give more information to researchers with the development of sensor technology and better data transmission possibilities. Because most of the previous approaches in this field needed clear detection of face or body features, curves, or boundaries to detect people and crowd boundaries, which is not possible in airborne images, new approaches are needed to extract information from these images. In a previous study, Hinz et al.8 registered airborne image sequences to estimate density and motion of people in crowded regions. For this purpose, a training background segment is first selected manually to classify image as foreground and background pixels. They used the ratio of background pixels and foreground pixels in a neighborhood to plot density. Observing change of the density map in the sequence, they estimated motion of people. This approach did not provide quantitative measures about crowds. In a following study,9 the previous approach was used to detect individuals. Positions of detected people were linked with graphs. They also used these graphs for understanding the behavior of people. To bring automated solutions to the problem in this field, Sirmacek and Reinartz10 proposed a dense crowd detection method based on extraction of local features from airborne images. Local features are used in a probabilistic process to identify locations of dense crowds. In a following study, Sirmacek and Reinartz11 improved the dense crowd detection study by adding a feature selection step. By using a background comparison method, they detected individuals. In Sirmacek and Reinartz,12 by applying Kalman13 filtering on individual detection results (which are obtained over registered airborne image sequences), they obtained automatic tracking results. Using several measures they have extracted over automatically generated probability density functions, they also estimated the main direction of motion and abnormality level of large crowds.12 Burkert et al.9 and Butenuth et al.14 used their estimations to simulate the human activity in large areas. Although the proposed approaches brought new insights to the related field, owing to the diverse appearance of the input images, obtaining robust and especially automatic solutions is still a big challenge. Herein, we present our latest techniques for detecting dense crowds and also for detecting individuals. We test robustness of the algorithm by comparing it with different parameter selection and different feature extraction methods. For testing our algorithms, we use color airborne image sequences and Geo-Eye-1 satellite images. Quantitative results and estimations of computation times are shown, since these are crucial for future real-time application of the algorithms. 2.Detecting People from Airborne ImagesAirborne image data were acquired by the Deutsches Zentrum fuer Luft und Raumfahrt (DLR, German Aerospace Center) 3K-Camera-System with a Cessna aircraft from 1000 m flight altitude and ground sampling distance (GSD) of 15 cm. The camera system, including on-board processing and downlink capabilities, is described in detail in Kurz et al.15 and consists of three off-the-shelf Canon Mark II cameras. Image sequences are acquired with a frequency between 2 and 1 Hz during the flight. The images are georeferenced on-board, so that the absolute coordinates are correct and objects such as cars and people can be detected at their absolute position. For each airborne image in the input sequence, we apply a dense crowd detection and people detection approach. Next, we introduce steps of the approach in detail. 2.1.Local Feature ExtractionTo illustrate the algorithm steps, we pick image from our test image sequence. In Fig. 1(a), we represent test image, and in Fig. 1(b), we represent a subpart of the original image to give information about real resolution of the image. As can be seen, airborne image resolutions do not make it possible to see each single person with sharp details. However, we can still notice a change of color and intensity components in the place where a person exists. Therefore, our dense crowd and people detection method depends on local features extracted from the intensity band of the input test image. Fig. 1(a) test image from our airborne image sequence including both crowded and sparse people groups. (b) Closer view of the crowded region in labeled with red square.  For local feature extraction, we use features from accelerated segment test (FAST). FAST feature extraction method was specially developed for corner detection purposes by Rosten et al.16 The algorithm can be briefly explained as follows:
Although the algorithm has been developed for corner detection, it also gives high responses on small regions that are significantly different from surrounding pixels. Therefore it is especially suitable if a person’s top view is represented by just a few pixels, which is true for the airborne images we are working with. We assume for as FAST local features which are extracted from intensity band of the input image, respectively. Here, indicates the maximum number of features. We represent locations of detected local features for test image in Fig. 2(c). Extracted FAST features will behave as observations of the probability density function (PDF) of the people to be estimated after a feature selection process, which we introduce in the next step. Fig. 2(a) Original test image. (b) Mean-shift segmentation result for test image. (c) Detected FAST feature locations on test image represented with red crosses. (d) Estimated PDF (color coded) for image generated using FAST feature locations as observations. (e) Automatically detected dense crowd boundaries and detected people in sparse groups for test image.  2.2.Local Feature SelectionAs can be seen in Fig. 2(c), we detected FAST features at almost each individual person’s position. Unfortunately, corners of other objects also led to FAST feature detection. In this step, we apply segmentation to the input image to estimate the interest region, which helps us to eliminate redundant local features. For segmenting the input image, we benefit from the mean shift segmentation approach, proposed by Comanicu and Meer.18 For the mean shift segmentation process, we choose spatial bandwidth () and spectral bandwidth () parameters as 7 and 6.5 pixels, respectively, after extensive tests, and we use the same parameters for all input images. The segmentation result is a new image such as , which holds each segment labeled by a single color. We present mean shift segmentation result for our test image in Fig. 2(b). Here, each segment is labeled with the mean of red, green, and blue band values of the original image pixels inside the segment. Although we have no idea about which segment represents which object, the segmentation result can be useful to decrease the complexity of the problem. We believe that on the interest region (generally roads), there should be many local features indicating people. Therefore, we eliminate regions having local features inside. Remaining regions are assumed as interest regions, which is represented with value 1 in binary mask. In the next steps of the algorithm, we use , local features only if they satisfy equation. In the next step, we introduce an adaptive kernel density estimation method to estimate corresponding PDF, which will help us to detect dense people groups and people in sparse groups. 2.3.Detecting Dense Crowds Based on Probability TheorySince we have no preinformation about the street, building, green area boundaries, and crowd locations in the image, we formulate the crowd detection method using a probabilistic framework. Assume that is the ’th FAST feature where . Each FAST feature indicates a local color change which might be a human to be detected. Therefore, we assume each FAST feature as an observation of a crowd PDF. For crowded regions, we assume that more local features should come together. Therefore, knowing the PDF will lead to detection of crowds. For PDF estimation, we benefit from a kernel-based density estimation method as Sirmacek and Unsalan19 represented for local feature-based building detection. Silverman20 defined the kernel density estimator for a discrete and bivariate PDF as follows. The bivariate kernel function [] should satisfy the conditions given below: andThe PDF estimator with kernel is defined by where is the width of the window, which is also called smoothing parameter. In this equation, for are observations from PDF that we want to estimate. We take as a Gaussian symmetric PDF, which is used in most density estimation applications. The Gaussian kernel function is easy to generate by setting only one bandwidth parameter, and the PDF, which is the sum of Gaussian kernels, gives a smooth function of probability densities with smooth transitions. Therefore, in our application the estimated PDF is formed as below: where is the bandwidth of Gaussian kernel (also called smoothing parameter), and is the normalizing constant to normalize values between [0, 1]. In kernel-based density estimation, the main problem is how to choose the bandwidth of Gaussian kernel for a given test image, since the estimated PDF directly depends on this value. Because we know the resolution of the image through the direct sensor orientation, we are able to adapt the bandwidth of the Gaussian kernel for any given input image. But we have to estimate this bandwidth once to achieve best results for further processing. In probability theory, there are several methods to estimate the bandwidth of kernel functions for given observations. One well-known approach is using statistical classification. This method is based on computing the PDF using different bandwidth parameters and then comparing them. Unfortunately, in our field, such a framework can be very time-consuming for large input images. The other well-known approach is called balloon estimators. This method checks nearest neighborhoods of each observation point to understand the density in that area. If the density is high, bandwidth is reduced proportional to the detected density measure. This method is generally used for variable-kernel density estimation, where a different kernel bandwidth is used for each observation point. However, in our study, we need to compute one fixed kernel bandwidth to use at all observation points. To this end, we follow an approach slightly different from balloon estimators.First, we pick number of random observations (FAST feature locations) to reduce the computation time. For each observation location, we compute the distance to the nearest neighbor observation point. Then, the mean of all distances gives us a number (calculated as 105.6 for ). We assume that variance of Gaussian kernel () should be equal to or greater than . To guarantee the intersection of kernels of two close observations, we assume variance of Gaussian kernel as in our study. Consequently, bandwidth of Gaussian kernel is estimated as . For a given sequence, that value is computed only one time over one image. Then, the same value is used for all observations extracted from images of the same sequence. The introduced automatic kernel bandwidth estimation method makes the algorithm robust to scale and resolution changes. In Fig. 2(d), we represent the PDF obtained for test image. The represented PDF function is color coded, which means yellow-red regions show high probability values and dark blue regions show low probability values. As can be seen in this figure, crowded areas have very high probability values, and they are highlighted in estimated PDF. We use the automatic thresholding method of Otsu21 on this PDF to detect regions having high probability values. After thresholding our PDF function, in the binary image obtained we eliminate regions with an area , since they cannot indicate large human crowds. The resulting binary image holds dense crowd regions. For image, boundaries of detected crowd regions are represented on original input image with blue borders in Fig. 2(e). After detecting very dense groups, in the next step we focus on detecting other people in sparse groups. After detecting dense crowds automatically, we also extract quantitative measures from detected crowds for more detailed analysis. Because they indicate local color changes, we assume that detected features can give information about number of people in crowded areas. Unfortunately, the number of features in a crowd region does not give the number of people directly. In most cases, shadows of people or small gaps between people also generate a feature; in addition, two neighbor features might come from two different chroma bands for the same person. To decrease counting errors from these features, we follow a different strategy to estimate the number of people in detected crowds. We use a binary mask where the image has zero values but the feature locations have value 1. Then, we dilate using a disk-shape structuring element with a radius of 2 to connect close feature locations in binary mask.22 Finally, we apply connected component analysis to the mask, and we assume the total number of connected components in a crowd area as the number of people ().22 In this process, a slight change of radius of a structuring element does not make a significant change in estimated people number . However, an appreciable increase in radius can connect features coming from different people and that decreases , which leads to poor estimates of number of people. Because the resolution of the input image is known, using an estimated number of people in the crowd, the density of people () can also be calculated. Let us assume is the ’th connected component in crowd mask. We calculate crowd density for ’th crowd as , where and are the numbers of pixels in the image in horizontal and vertical directions, respectively, and is the area of one pixel in square meters. 2.4.Detecting People in Sparse GroupsBesides detecting dense crowd regions and extracting quantitative measures on them, detecting other people in noncrowd regions is also crucial, because detecting people in noncrowd regions can help to develop people-tracking or behavior-understanding systems. To detect people in noncrowd regions, we apply connected component analysis22 to matrix and pick mass centers of the connected components (, ) which satisfy as locations of individual people in sparse groups. Unfortunately, each location satisfying this rule does not directly indicate a person, because the location might be coming from irrelevant local features of another object such as a tree or chimney. To decide whether a position is indicating a person or not, we apply a background comparison test. At this step, to represent a person, the background color of a connected component centered in position should be very similar to the background color of detected dense crowds. To do a background similarity test, first we pick all border pixels of the binary objects (crowd regions) in binary crowd mask. We assume , , and as mean of , , and color band values of these pixels. For each location which satisfies equation, we apply the same procedure and obtain , , and values, which indicate mean of , , and color band values around connected components located at center point. To test background similarity, we check if extracted values satisfy inequality given below: In our study, we selected after extensive tests. Although slight changes of value do not affect the detection result, a large increase of this threshold might lead to false detections; on the other hand, a large decrease might lead to inadequate detections. We should add that it is not possible to detect individuals standing on different colored surfaces with this method. 3.ExperimentsTo test our method, we use airborne images obtained using the low-cost airborne frame camera system (named 3K camera system) developed at DLR. The spatial resolution (GSD) and swath width of the camera system range between 15 and 50 cm, and 2.5 to 8 km, respectively, depending on the flight altitude. Within 2 min, an area of approximately 10 by 8 km can be monitored. That high observation coverage gives great advantage to monitor large events. Image data are processed onboard by five computers using data from a real-time global positioning system/inertial measurement unit system including direct georeferencing.15 In this study, we use data with 15-cm GSD acquired from 1000-m flight altitude. The 3K airborne camera image data set consists of a stadium entrance data set (), which includes 43 multitemporal images acquired with a time distance of 0.5 s or 2 Hz. We also use one-shot airborne images taken over open-air concerts, Oktoberfest, and a festival for our crowd- and people-detection tests. All images are georeferenced to get absolute coordinates of the detected objects and allow us to detect exact geographical coordinates of the objects even if the images are taken from different positions of the aircraft. That property of the developed software gives us also the opportunity to easily display our results on Google Earth. Because of focusing difficulties of the older version of the camera system, some of the images in our data set are blurred. Although this issue decreases the detection capabilities of our software system, the results can still provide important information about status of the crowds and approximate quantitative measures of crowd and noncrowd regions. Furthermore, we also represent some test results obtained by using satellite images. 3.1.Crowd-Detection ExperimentsTo obtain a measure about the performance of the crowd-analysis step of the algorithm, we have generated reference data for four dense crowds in , represented in Fig. 3. Because even for a human observer it is hard to count the exact number of people in crowds, we have assumed mean counts of three human observers as reference. In Table 1, we compare the automatically detected number of people () and density () with the reference data ( and , respectively) for each crowd. Similarity of our measures with the reference shows the high performance of the proposed approach. Fig. 3A small part of test image. Labels of detected crowds used for performance analysis are written on the image. 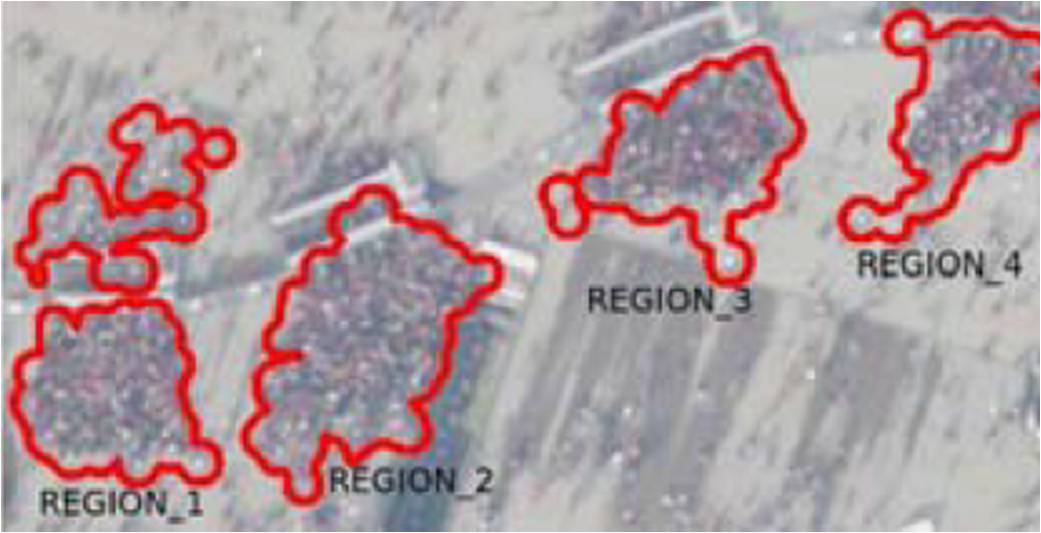 Table 1Comparison of reference and automatically detected people number and density estimation results for test regions in Stadium1 image.
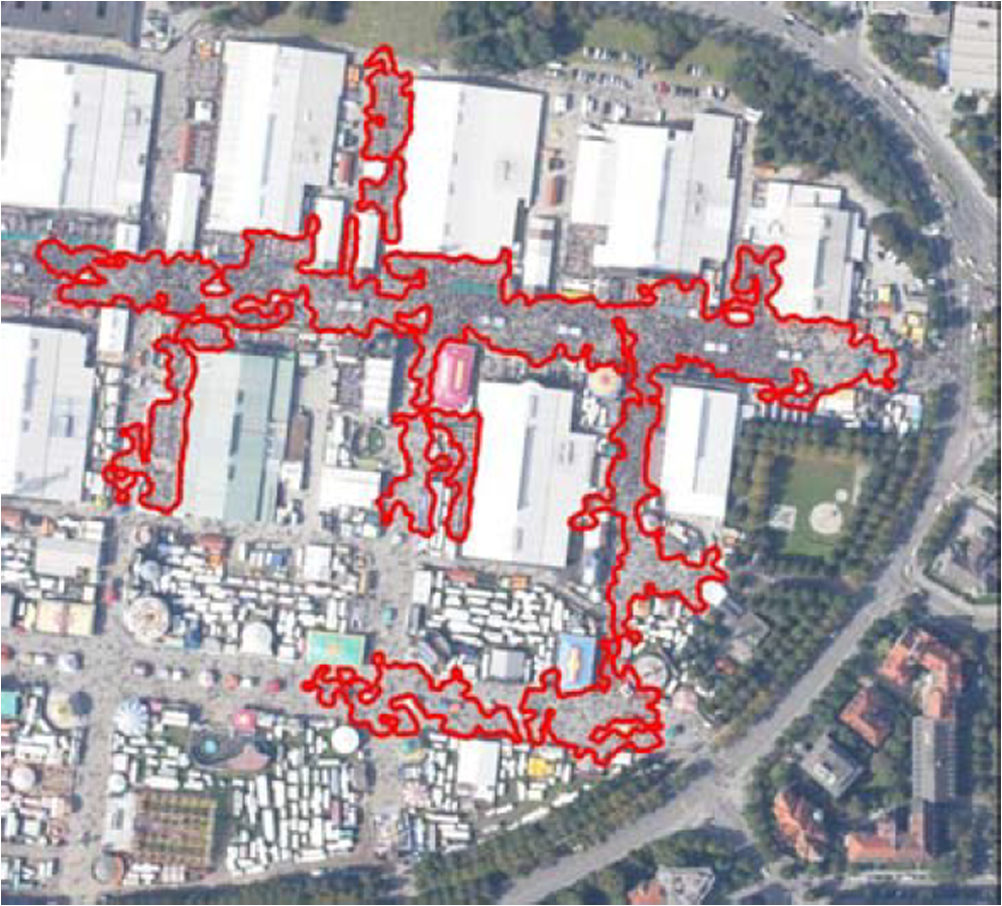
N, number of people; d, number of people per square meter. In Fig. 4, we represent a crowd-detection result for a test image that covers a large part of the Oktoberfest event region. It can be seen that mainly the densely crowded areas in the roads near the tents are detected correctly. In our automatic kernel-density estimation method, we assumed variance of Gaussian kernel as equal to . To prove our assumption and visualize effects of using different kernel-variance values, in this step we provide example results for different Gaussian kernel function variances. In Fig. 5, we provide crowd detection results for test image for , , , , and Gaussian kernel variance values. As can be seen in these results, assuming variance value equal to leads to underestimations, because the width of the kernel function cannot be sufficient to merge probabilities of people. Assuming kernel variance as and , we obtain results very similar to those of our previous assumption (assuming variance as ). That proves robustness of the kernel density variance parameter to the chosen tolerance values. In last two images, although we use very high kernel-variance values, we could detect dense crowd regions. However, detected crowd boundaries appear larger owing to the very high width of the Gaussian probabilities. In Fig. 6, we represent another dense crowd detection from an open-air concert in another region. The correct dense crowd boundary detection, despite the dense and diverse texture characteristics in the image, indicates the reliability of the proposed system. In a previous study, Sirmacek et al.23 tested FAST feature extraction-based crowd detection software on the first 16 airborne images of the Stadium image sequence. They have compared the software with other software solutions built in the same process structure but using different feature extraction methods (SPARK, ETM, and LOG features). The experiments showed that using the FAST feature extraction method, it is possible to obtain superior crowd detection performance. Using the 16 images of the test data set, the FAST feature extraction-based crowd detection software achieved performance computations of 87.21% for the area true detection rate and 13.46% false detection rate. For comparison, manually generated dense crowd masks (binary images where dense crowd pixels are labeled with 1 and the other pixels are labeled with 0) have been used as reference. The main advantage of the proposed system is its capability to adapt itself to spatial resolutions of the input images by detecting the value automatically, which is important if the algorithms will be used in a real-time environment. To prove the robustness of the system to the spatial resolutions of the input images, we present crowd detection examples on a GeoEye-1 satellite image in Fig. 7. Results on satellite images of approximately 0.5 m (GSD) indicates the robustness of the automatically adapted system parameter. 3.2.People-Detection ExperimentsIn this section, we discuss the single people detection performance of the proposed method. We provide a detection performance illustration in Fig. 8, which is a zoomed subregion of test image. In this zoomed image part, we represent detected person locations with boxes. We have manually changed the marker box color to green for true detected persons and red for false alarms. A high number of green markers indicates high detection performance of the system. We could not prevent detection of local disturbances, which are represented with red box markers. Fig. 8Closer view of test image is presented to give information about people detection in sparse regions. True detections are labeled with green, and false detections are labeled with red.  Unfortunately, due to the limited resolution and focusing difficulties of the airborne camera, it is difficult to generate good reference data for accurate performance calculation. To be able to discuss quantitative results, we asked three volunteers to label the individuals that they can see in the dense crowd (red-labeled) region in Fig. 6. In Fig. 9, we represent the labels generated by the volunteers. To generate reference data, we stored blue label locations in binary masks with value 1 where a person exists and value 0 in other places. Fig. 9Closer view of the dense crowd region in Fig. 6. Three different images show the labels generated manually by three different volunteers.  In Table 2, we tabulate the quantitative performance calculation results by using three different references given in Fig. 9. As can be seen in this table, the three volunteers labeled almost the same number of individuals. The slight difference might be because of the low sharpness of the image for displaying very small objects. We have accepted the software result as a correct detection if it is one pixel around a reference label. Our FAST feature–based software did not detect any false alarm in the dense crowd region. Unfortunately, the software could not detect each individual, especially in those regions where the object sharpness was very low. In future steps of our research, we would like to adapt feature extraction parameters depending on the input image sharpness estimation to obtain higher detection performances. Table 2Comparison of reference and automatically detected people number results for the dense crowd region in Fig. 6.
3.3.Computation TimeFinally, in this section we analyze computation time needed for our method. For test image from our dataset, total dense crowd detection and individual detection modules take 107.20 s. We obtained timings using an Intel Core2Quad 2.66 GHz PC and MatLab coding environment. Total computation time for detecting dense crowds with the estimated people and people density numbers, and also for detecting individuals, show the practical usefulness of the method for on-board real-time applications. We plan to achieve higher computation time performances in a C programming environment. 4.ConclusionsTo bring a novel solution for dense crowd and individual detection problem, herein we propose a fully automatic approach using remotely sensed images. Although the resolutions of airborne images are not enough to see each person with very sharp details, we can still notice a change of color components in the place where people or groups of people exist. Therefore local feature extraction-based software gave us the opportunity to develop a software system that can give high detection performances. We tested our crowd and people detection algorithm on airborne images taken from different events having diverse characteristics in their scenes. To test the robustness of the self-adaptive system parameter, we also applied dense crowd detection algorithm on GeoEye-1 satellite images. The experimental results and parameter robustness tests indicate possible use of the algorithm in real-life events, also for on-board applications. ReferencesA. DaviesJ. YinS. Velastin,
“Crowd monitoring using image processing,”
IEEE Electron. Commun. Eng. J., 7
(1), 37
–47
(1995). http://dx.doi.org/10.1049/ecej:19950106 ECEJE9 0954-0695 Google Scholar
C. RegazzoniA. Tesei,
“Local density evaluation and tracking of multiple objects from complex image sequences,”
in Proc. 20th Int. Conf. on Industrial Electronics, Control and Instrumentation,
744
–748
(1994). Google Scholar
C. RegazzoniA. Tesei,
“Distributed data fusion for real time crowding estimation,”
Signal Process., 53
(1), 47
–63
(1996). http://dx.doi.org/10.1016/0165-1684(96)00075-8 SPRODR 0165-1684 Google Scholar
O. Arandjelovic,
“Crowd detection from still images,”
in Proc. of the Br. Mach. Vis. Conf.,
(2008). Google Scholar
W. GeR. Collins,
“Marked point process for crowd counting,”
in Proc. IEEE Comp. Vis. Pattern Recognit.,
2913
–2920
(2009). Google Scholar
W. GeR. Collins,
“Crowd detection with a multiview sampler,”
in Proc. 11th Eur. Conf. Comp. Vis.,
324
–337
(2010). Google Scholar
S. LinJ. ChenH. Chao,
“Estimation of number of people in crowded scenes using perspective transformation,”
IEEE Trans. Syst. Man Cybernet. A Syst. Hum., 31
(6), 645
–654
(2001). http://dx.doi.org/10.1109/3468.983420 ITSHFX 1083-4427 Google Scholar
S. Hinz,
“Density and motion estimation of people in crowded environments based on aerial image sequences,”
in ISPRS Hannover Workshop on High-Resolution Earth Imaging for Geospatial Information,
(2009). Google Scholar
F. Burkertet al.,
“People tracking and trajectory interpretation in aerial image sequences,”
in Int. Arch. Photogram. Remote Sens. Spat. Inf. Sci. Commision III (Part A),
209
–214
(2010). Google Scholar
B. SirmacekP. Reinartz,
“Automatic crowd analysis from airborne images,”
in Proc. 5th Int. Conf. Rec. Adv. Space Tech.,
116
–120
(2011). Google Scholar
B. SirmacekP. Reinartz,
“Automatic crowd density and motion analysis in airborne image sequences based on a probabilistic framework,”
in Proc. 2nd IEEE Int. Conf. Comp. Vis. Workshop.,
898
–905
(2011). Google Scholar
B. SirmacekP. Reinartz,
“Kalman filter based feature analysis for tracking people from airborne images,”
in ISPRS Workshop High-Resolution Earth Imaging for Geospatial Information,
(2011). Google Scholar
R. Kalman,
“A new approach to linear filtering and prediction problems,”
J. Basic Eng., 82
(1), 35
–45
(1960). http://dx.doi.org/10.1115/1.3662552 JBAEAI 0021-9223 Google Scholar
M. Butenuthet al.,
“Integrating pedestrian simulation, tracking and event detection for crowd analysis,”
in Proc. of the 1st IEEE ICCV Workshop on Modeling, Simulation and Visual Analysis of Large Crowds,
150
–157
(2011). Google Scholar
F. Kurzet al.,
“Low-cost optical camera system for disaster monitoring,”
in Int. Archives of the Photogrammetry, Remote Sens. and Spatial Information Sci.,
159
–175
(2012). Google Scholar
E. RostenR. PorterT. Drummond,
“Faster and better: a machine learning approach to corner detection,”
IEEE Trans. Pattern Anal. Mach. Learn., 32
(1), 105
–119
(2010). http://dx.doi.org/10.1109/TPAMI.2008.275 ITPIDJ 0162-8828 Google Scholar
D. HearnM. P. Baker, Computer Graphics, Prentice-Hall(1994). Google Scholar
D. ComanicuP. Meer,
“Mean shift: a robust approach toward feature space analysis,”
IEEE Trans. Pattern Anal. Mach. Intell., 24
(5), 603
–619
(2002). http://dx.doi.org/10.1109/34.1000236 ITPIDJ 0162-8828 Google Scholar
B. SirmacekC. Unsalan,
“A probabilistic framework to detect buildings in aerial and satellite images,”
IEEE Trans. Geosci. Remote Sens., 49
(1), 211
–221
(2011). http://dx.doi.org/10.1109/TGRS.2010.2053713 IGRSD2 0196-2892 Google Scholar
B. Silverman, Density Estimation for Statistics and Data Analysis, 1st ed.Chapman and Hall/CRC(1986). Google Scholar
N. Otsu,
“A threshold selection method from gray-level histograms,”
IEEE Trans. Syst. Man Cybernet., 9
(1), 62
–66
(2009). http://dx.doi.org/10.1109/TSMC.1979.4310076 ISYMAW 0018-9472 Google Scholar
M. SonkaV. HlavacR. Boyle, Image Processing: Analysis and Machine Vision, 3rd ed.CL-Engineering, Lubbock, Texas
(2007). Google Scholar
B. Sirmaceket al.,
“Performance assessment of automatic crowd detection techniques on airborne images,”
in Proc. of the IEEE International Geoscience and Remote Sensing Symposium,
2198
–2201
(2012). Google Scholar
Biography Beril Sirmacek received the BSc and MSc degrees from the Department of Electronics and Communication Engineering in Yildiz Technical University, Istanbul, in 2006 and 2007, respectively, and the PhD degree from the Department of Electrical and Electronics Engineering, Yeditepe University, Istanbul in 2009. During her PhD study, she was a research and teaching assistant and a member of the computer vision research laboratory at Yeditepe University. In this period, she has also made collaborations with many different universities and worked as a visiting researcher in remote sensing laboratory in the Department of Information Engineering and Computer Science in University of Trento, Italy. After receiving PhD degree, she has worked as a research fellow in the Department of Photogrammetry and Image Analysis in Remote Sensing Technology Institute of German Aerospace Center, as a guest lecturer in Institute of Computer Science at University of Augsburg, and a teaching assistant for image processing course at Technical University of Munich in Germany. Besides, she has started to pursue habilitation degree at Institute of Geoinformation at University of Osnabrueck. Recently, she is working with Delft University of Technology at Faculty of Aerospace Engineering in the Netherlands. She is engaged with developing computer vision interfaces for detailed 3D damage analysis of historical art objects.  Peter Reinartz received the diploma (Dipl.-Phys.) in theoretical physics in 1983 from the University of Munich and his PhD (Dr.-Ing) in civil engineering from the University of Hannover in 1989. His dissertation was on statistical optimization of classification methods for multispectral image data. He is department head of the Photogrammetry and Image Analysis Department at the German Aerospace Centre, Remote Sensing Technology Institute and holds a professorship for geoinformatics at the University of Osnabrück. He has more than 25 years of experience in image processing and remote sensing and over 200 publications in these fields. His main interests are in direct georeferencing, stereo-photogrammetry and data fusion of space borne and airborne data, generation of digital elevation models and interpretation of VHR data from sensors like Ikonos, Quickbird a.o. He is also engaged in using remote sensing data for disaster management and using high frequency time series of airborne image data for real time operations in case of disasters as well as for traffic monitoring. |