
|
|
1.IntroductionWetlands are one of the most important ecosystems on Earth. They usually contain thousands of species in their aquatic and terrestrial environments, provide important habitat to animals, and play a special function in hydrology.1 However, wetlands were once considered as having little economic value.2 As a result, the drainage and alternative usage of wetlands (e.g., transforming to croplands or pastureland) became common practice around the world and was even encouraged by specific governmental policies. Statistical results of Mitsch and Gosselink3 and Mitsch2 showed that wetlands, globally, were decreasing at a fairly rapid rate. Fifty percent of the world’s original wetlands had disappeared since the 1790s. Moreover, climate change, as another major threat to the survival of species and ecosystem integrity,4 will affect the hydrology of individual wetland ecosystems, mainly through changes in precipitation and temperature. Usually, such impacts will immediately post concerns for wetlands.5 With the decline of wetlands, other habitats are also lost.6 These include biogeochemically active areas, frequency flood buffers, and major natural sources of reduced gases (e.g., methane and sulfur compounds). Many governments have set up nature reserves to protect wetland areas;7–9 however, inherent conflicts exist even today between the need for more croplands and for environmental protection. For example, some wetland nature reserves in eastern China were not well protected and even lost due to agricultural activities.10 Thus, the effectiveness of establishing a wetland reserve for the protection of its vegetative coverage needs to be evaluated. Remote-sensing techniques have been used as alternatives to complement traditional field work on wetland research, for example, by using multispectral instruments onboard aircrafts and satellites (e.g., Airborne Multispectral Scanner, Landsat MSS, and Thematic Mapper). The moderate-resolution imaging spectroradiometer (MODIS) satellite instrument has provided medium-resolution vegetation indices (VIs) since 1999.11 This makes monitoring of photosynthetic vegetative activity in small areas a reality.12 VIs are sensitive to vegetation’s chlorophyll content, nutrient levels, and water content as well as the underlying soil characteristics.13 Therefore, VIs serve as effective and simple indices to evaluate vegetative features on Earth’s surface by using different band combinations.14 A recent study showed that time series of VIs combined with water-level data could recognize of wetland vegetation.15 It is not easy, however, to choose the most appropriate VI for a particular study. Although normalized difference VI (NDVI) has been widely used to monitor wetland vegetation,16,17 no evidence has proved that NDVI is superior to other VIs. Thus, one of the objectives in this work is to find a reliable VI for monitoring wetland vegetation in eastern China. There are of wetlands in China,18 and the area of most wetland nature reserves in China appeared to be decreasing during the past 30 years.19 Some wetlands, such as the Hongze Lake wetland, have been affected by agricultural activities. During the 1960s and 1970s, significant effort was placed into converting some of the Hongze Lake water area to cropland. This action caused aquatic plants to disappear and wetland area to decrease.20 To protect the Hongze Lake wetland, local government established the Hongze Lake nature reserve in 1999. Although it became a national wetland nature reserve in 2006,21 no studies have shown how effectively the reserve has been protected. Based on the most recent advances in remote-sensing technology and algorithm development, as well as the need for the assessment of the effectiveness of wetland protection, we initiated a study to assess the vegetative coverage of the Hongze Lake national wetland nature reserve using MODIS medium-resolution data between 2000 and 2009. The study’s objectives were: 2.Study AreaHongze Lake is the fourth-largest freshwater lake in China, with an area of (Refs. 22 and 23) and an average water depth of 1.77 m. The Hongze Lake national wetland nature reserve is located at 33°10’40″-33°20’27″N and 118°13’9″–118°28’42″E (Fig. 1), in a transition zone between temperate and subtropical climates. There are three monsoon-induced rainy seasons: spring rain (April to May), plum rain (June to July), and autumn rain (September). Average annual rainfall is 926.7 mm, with plum rain and autumn rain contributing 65.4% of the total rainfall.24 The global wetland classification system referred to as the Ramsar Convention categorized wetland reserves into coastal wetland, river wetland, lake wetland, and marsh wetland.25 The Hongze Lake national wetland nature reserve near Hongze Lake is one of the typical lake wetlands. The reserve has >80 freshwater plant species such as Phragmites australis, Lepironia, and Nelumbo nucifera. The total area of the Hongze Lake national wetland nature reserve is including its core, buffer, and experimental areas.23 Unfortunately, a geographic information system (GIS)-based map showing the exact locations of these areas is not available in either refereed or gray literature. Yang26 showed that the buffer and experimental areas were still affected by agricultural activities. Landsat Thematic Mapper (TM) true-color image of Hongze Lake also illustrated this effect (Table 1). Although local environmental protection laws prohibit any human activities in the core area of the reserve, it is unclear whether the core area has been well protected. Hence, our study site of was chosen in the core area (Fig. 1), after visual interpretation of a 30-m-resolution Landsat TM true-color image collected on May 20, 2003. Fig. 1Location of Hongze Lake, China. The entire area of the Hongze Lake national wetland nature reserve is outlined in red, where our study area is outlined in green. (a) Location of Huaihe River, which is the primary drain of Hongze Lake. (b) Photo taken in the core area of the Hongze Lake national wetland nature reserve. 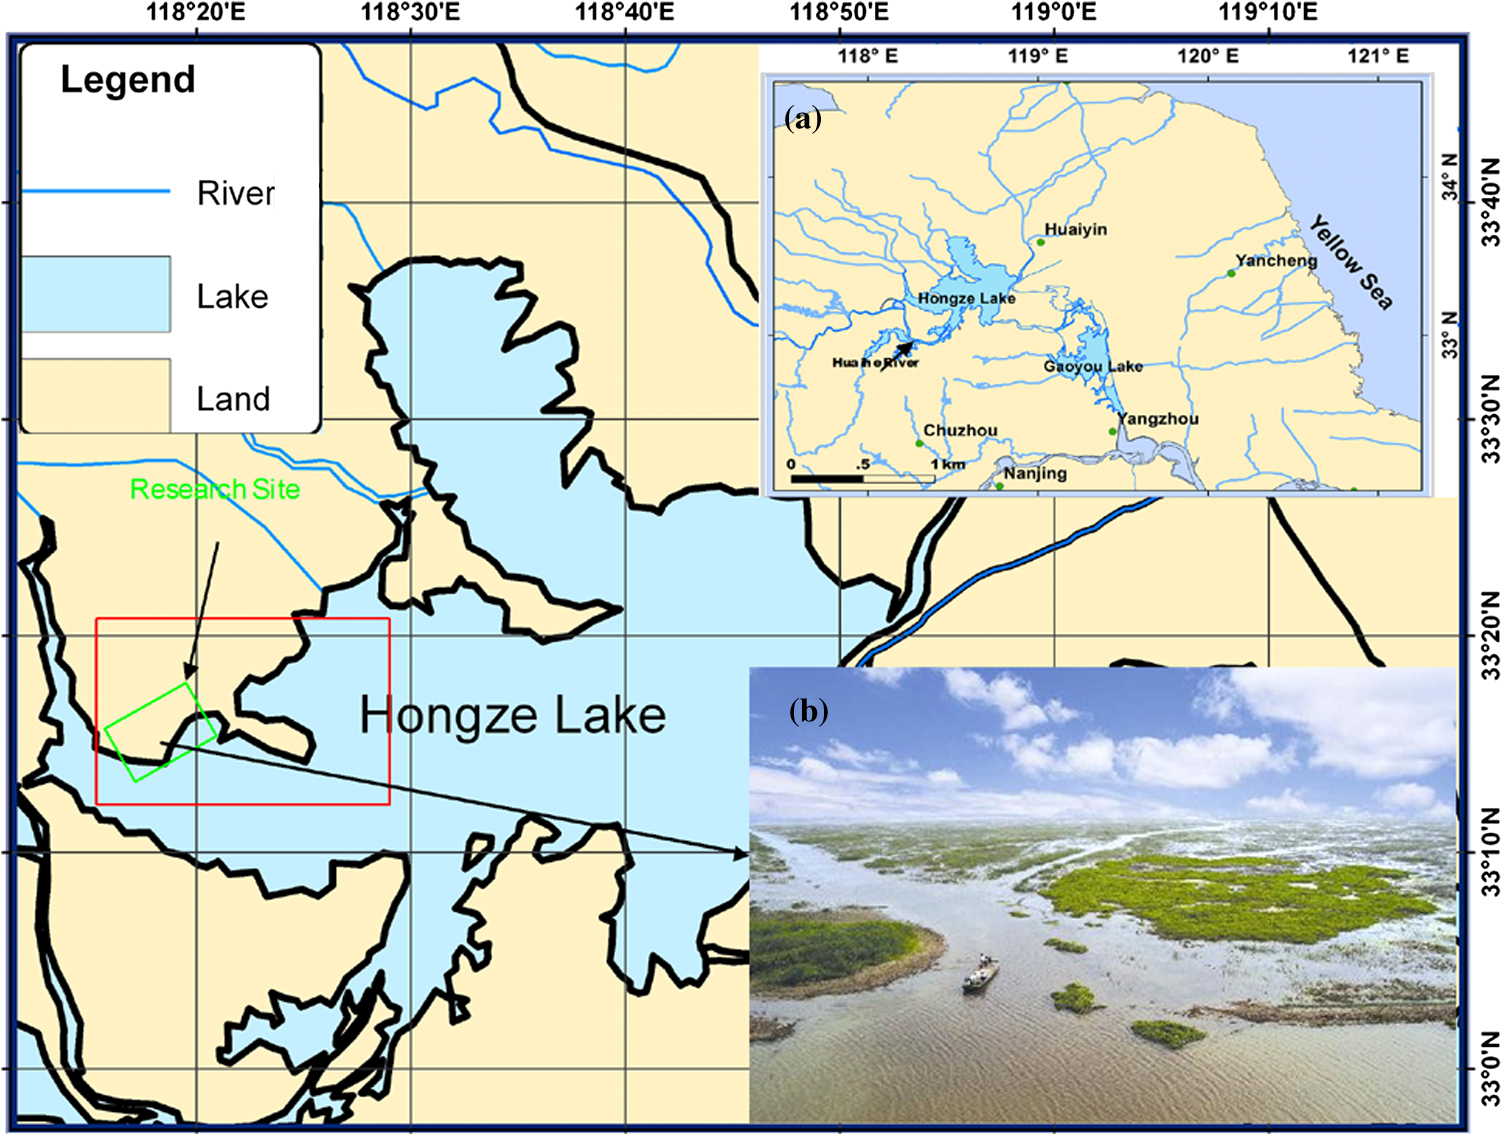 Table 1Information of the agricultural activities detected by Landsat Thermal Mapper image.
3.Data and MethodsMODIS is a key instrument onboard the polar orbiting Terra (1999 to present) and Aqua (2002 to present) satellites with a swath width of 2330 km. Since February 2000, daily global data in 36 spectral bands between 400 nm and 14 μm are available, including two bands at 250-m resolution and five bands at 500-m resolution. MODIS data provide a unique capability to explore Earth’s resources and environments because of their frequent and global coverage.27–30 In this work, we focused on the MODIS 250- and 500-m resolution data obtained from the U.S. NASA Goddard Flight Space Center (GSFC). Of the level-0 data scenes from February 2000 to 2009 covering our study area, 596 were selected after excluding those contaminated by clouds or sun glint. On average, there are four to six qualified data scenes per month except during the rainy seasons (Table 2). Table 2Number of selected MODIS level-0 data granules (scenes) from 2000 to 2009.
The data were corrected for gaseous absorption and Rayleigh scattering to derive the surface reflectance: , where is the calibrated sensor radiance after adjustment for ozone and other gaseous absorption, is the extraterrestrial solar irradiance, is the solar zenith angle, and is Rayleigh reflectance estimated with 6S (second simulation of a satellite signal in the solar spectrum).31 The VIs were derived from MODIS as follows: and where NDVI is the normalized difference vegetation index,32 EVI is the enhanced vegetation index,11 and FAI is the floating algae index; NIR is near infrared and SWIR is short-wave infrared.33 The EVI coefficients for MODIS were recommended as , , , and .34 In the above equations for MODIS, , , , , and .Of the three VIs, NDVI has been used most often in the past. However, NDVI saturates at high leaf-coverage area and is susceptible to variable environmental and observing conditions.34–37 EVI was introduced to avoid those problems.11,37–39 FAI was designed to detect floating algae in the open-ocean environments using medium-resolution (250- and 500-m) MODIS data and was shown to be more effective to separate algae from water and less prone to influence by aerosols than NDVI and EVI.33 However, it remains to be evaluated which index is more suitable for assessing temporal changes in wetland vegetative coverage. The study focuses only on the upland vegetation, and water pixels need to be excluded from the research site. The 859- and 1240-nm bands used in the FAI create a sharp gradient along the land–water interface, from which land and water pixels were defined.40 This is ideal for creating a water mask, and one was generated from a composite FAI image made from the 596 FAI images. A histogram of the highest FAI values from the 596 images over a small area mixed with nonsubmerged vegetation and water (about 3 km from our research area) was generated, and the mode of the histogram () was chosen as the threshold. The static water mask was then applied to all images (NDVI, EVI, and FAI) to have a fixed study area for long-term assessment. Monthly meteorological data from 2000 to 2008 (the 2009 data were not available) including air temperature, precipitation, and sunshine duration were obtained from the National Meteorological Information Center of China. These data were collected by the nearest meteorological station to the Hongze Lake national wetland nature reserve (about 26 km). Comparison with data from two other stations farther from our study area showed temporal consistency among all stations, suggesting that these data could represent the meteorological conditions of our study area. 4.Results4.1.VI Evaluation and SelectionTo evaluate each VI’s effectiveness in removing noise (thought to be due to changing aerosols and solar/viewing geometry) while covering sufficient dynamic range, data from the study area were first averaged from the individual image, and 596 average VI values were obtained to form a time series. Then, a smoothed time series was obtained using a three-point running mean. The difference between the original and smoothed time series is believed to result primarily from temporal noise. Note that this method was used only to compare the three VIs and was not applied to study temporal changes of the vegetative coverage. This is because vegetative coverage should remain relatively stable over short-term scales (days to weeks). The root mean square (RMS) noise was normalized against the dynamic range of the VI. This served as a proxy for relative errors within the full dynamic range of the VI. Mathematically, the error term was estimated as where VI is the original time series, VI′ is the smoothed time series, and . Results show that , , and . All three VIs clearly show the seasonal patterns (Fig. 2), with FAI showing the least temporal noise (i.e., the most stable over time). Figure 3 further illustrates that under different aerosol conditions, FAI is more stable than NDVI and EVI. This finding is consistent with that found by Hu.33 Therefore, FAI was chosen to study wetland changes in this study.Fig. 2Time series of average normalized difference vegetation index (NDVI), enhanced VI (EVI), and floating algae index (FAI) for the study area. The blue lines represent the smoothed data. FAI time series data show less noise (smoother in time) than those of NDVI and EVI (see statistics in the text) because FAI is more tolerant to changes in observing and environmental conditions (solar/viewing geometry, aerosols). 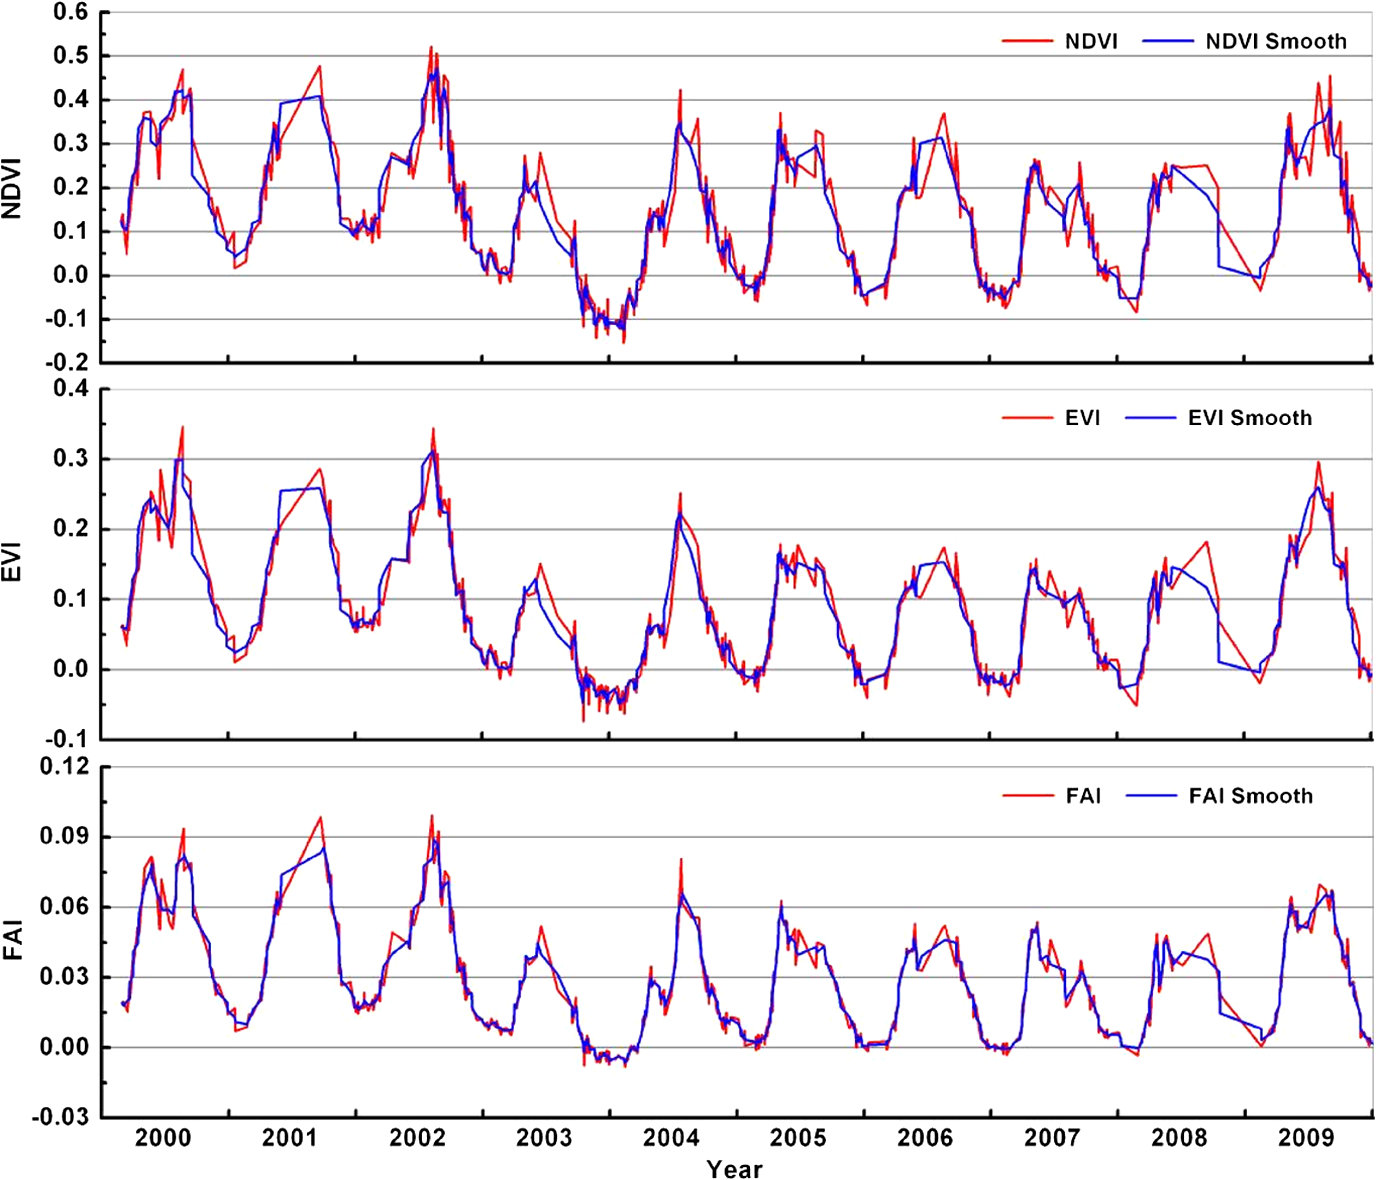 Fig. 3MODIS RGB true-color images (a) and (b) showing the effects of aerosols. Because land vegetation of the two adjacent days is not expected to change and the MODIS data are already corrected for gaseous absorption and Rayleigh scattering, the color change is primarily due to changes in aerosols (thickness and type). (c) The sensitivity of each VI (mean value of the core area) to aerosol changes is shown as the relative change between the two images. FAI is relatively more stable (smallest slope in the graph) than NDVI and EVI.  4.2.Wetland Vegetation AssessmentTo evaluate whether our study area in its surface vegetative coverage (the core of the Hongze Lake national wetland nature reserve) was affected by human agricultural activity, an FAI time series from nearby cropland was generated and examined. Figure 4 shows sharp changes in the cropland FAI time series around the beginning of June in each year. This is apparently due to wheat harvest. Similar changes are minimal or absent in the wetland FAI time series. This suggests that there is no large-scale human activity in the core of the Hongze Lake national wetland nature reserve. Fig. 4FAI time series for the study area (wetland in red) and a nearby cropland (in blue). The black circles highlight the sharp changes for the cropland around the beginning of June in each year due to wheat harvest. Similar sharp changes are minimal or absent in the wetland FAI data, which were generated over the upland vegetation.  The vegetative coverage in each image was estimated by summing pixels with , where its temporal change is presented in Fig. 5. Two indices were then defined to describe the temporal changes in vegetative coverage. The total annual coverage was defined as the temporal integration of daily coverage over a year with units of d, named accumulated vegetative coverage areas (AVCAs). Because of a lack of data in the first two months of 2000, average data from other years for the first two months were used for 2000. Following statistical conventions, a value of 95% of the total wetland core area, corresponding to , was chosen to represent significant vegetative coverage. The days where vegetative coverage is are marked with blue in Fig. 5 and defined as significant vegetative coverage days (SVCDs). AVCAs for the first three years increased from to d. However, a sharp decrease occurred in 2003, resulting in a 27% loss in AVCA ( d). From 2004 to 2008, AVCAs remained stable between and d. In 2009, AVCAs recovered to d, close to that in 2000 when MODIS time-series data begin. Fig. 5Area coverage within the study area with . Blue shades highlight the days where the area is (95% of the study area). Note that these temporal patterns would not change if a different FAI threshold were used. 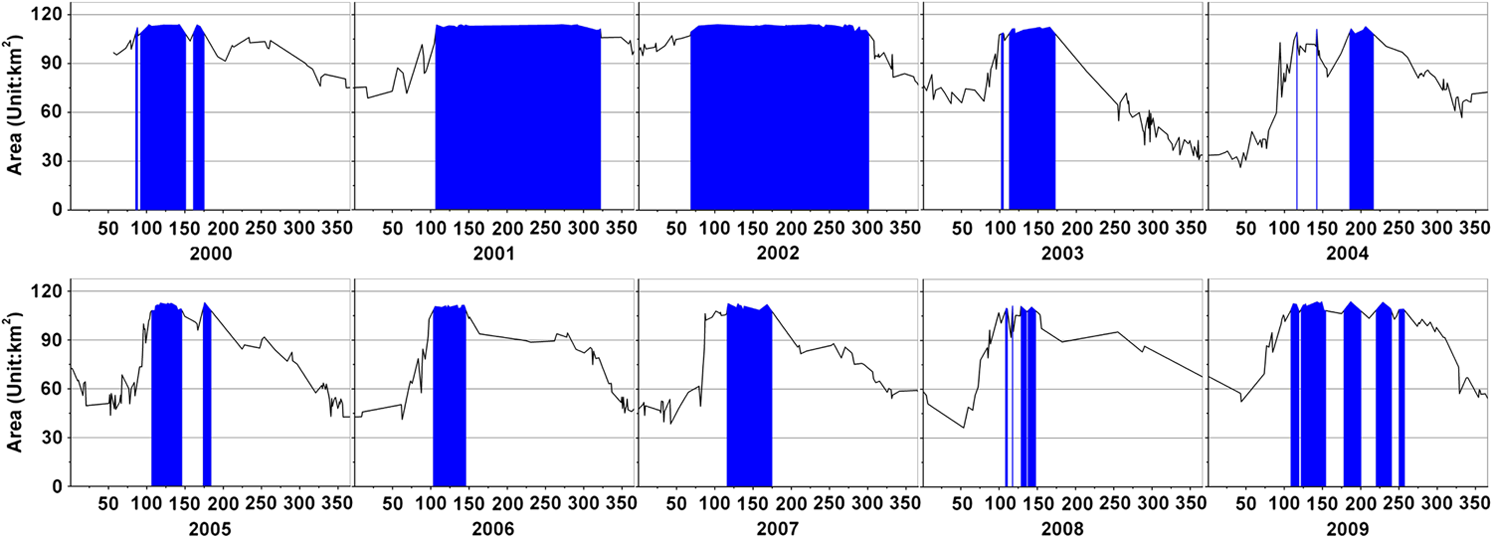 Although AVCAs were relatively stable except the change during 2003, significant interannual variability was found in the SVCDs. SVCDs for 2000, 2001, and 2002 are 78, 216, and 233 d, respectively. In 2003, SVCDs dropped to 63 d and remained low, between 23 and 59 d, during the following five years. In 2009, SVCDs recovered to 96 d. 4.3.Meteorology EffectsMeteorological data showed six precipitation events between June 20, 2003, and July 21, 2003, due to El Niño southern oscillation (ENSO).41 Although the annual precipitations of 2003 and 2007 are nearly the same (Fig. 6), the precipitation events occurred in different seasons. In 2003, precipitation in the summer was 177.2 mm higher than in the 2007 summer, leading to the second largest flood since 1949 in the Hongze Lake watershed. The maximum flood discharge reached and the water level reached 14.37 m, which were the third-highest values during the past 100 years.42 The significant drop in the vegetative coverage (e.g., on September 11, 2003) was apparently caused by this flooding event. This decreasing trend continued to the end of 2003, since most plants are not flood tolerant. The impact of the 2003 flood continued in the following years, as both FAI values (Fig. 2) and AVCAs (Fig. 5) never returned to the highest levels in year 2002. However, FAI, AVCAs, and SVCDs appeared to have recovered in 2009. Fig. 6Accumulated vegetative coverage areas (AVCAs) and significant vegetative coverage days (SVCDs) in the study area versus annual precipitation (a) and annual sunshine duration (b) during 2000 to 2009. The 2003 flooding event is highlighted with vertical bars. 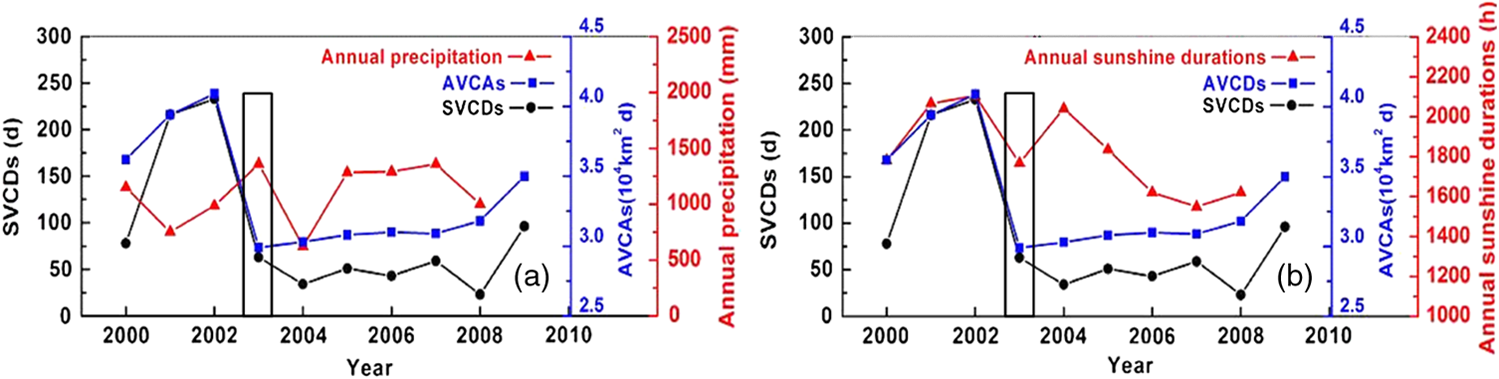 The effects of the flooding event on the vegetative coverage demonstrate one example of the climate/weather influence on the wetland. To further obtain statistics between meteorological conditions and vegetative coverage, annual average of air temperature, total annual precipitation, and sunshine duration were examined. These data were generated from the monthly data. Because precipitation of the three rainy seasons from April to September contributes 76% of the total annual precipitation, the annual precipitation actually represents mostly the precipitation conditions during the rainy seasons. Correlation coefficients were determined between the vegetative coverage (represented by both AVCAs and SVCDs) and the meteorological parameters, with results shown in Table 3 and Fig. 6. Air temperature and precipitation were found to insignificantly correlate to AVCAs and SVCDs, indicating that temperature and precipitation (on an annual scale) play minor roles in affecting vegetative coverage in this area. In contrast, sunshine duration showed significant correlations with AVCAs and SVCDs. Table 3Coefficients of linear correlation between vegetative coverage [accumulated vegetative coverage areas (AVCAs) and significant vegetative coverage days (SVCDs)] and annual meteorological conditions for the selected core area of the Hongze Lake national wetland nature reserve.
Note: Significance test was performed at the 90% level.Note: Coefficients of 0–0.3 (0 to −0.3) indicate a weak positive (negative) linear relationship; 0.3–0.7 (−0.3 to −0.7) for a moderate positive (negative) linear relationship; 0.7–1.0 (−0.7 to −1.0) for a strong positive (negative) linear relationship via a firm linear rule.43 5.Discussion and ConclusionsAlthough FAI was designed to separate floating algae from water in the ocean environment,33 the baseline subtraction method in the FAI design served as a simple but effective atmospheric correction to remove aerosol effects even for land vegetative coverage. Thus, the FAI time series showed less noise than those of NDVI and EVI. This result is consistent with the model simulation results for the floating algae in the oceans.33 However, the same time-series analysis applied to the noisier EVI data resulted in similar results in AVCAs and SVCDs, and thus similar conclusions in the evaluation of the wetland nature reserve, suggesting the effectiveness of the EVI method (results not shown here). We believe that this is primarily attributable to the sufficient data frequency of MODIS in our study (on average, cloud-free image per week when MODIS/Terra and MODIS/Aqua are combined) where short-term data noise similar to those shown in Fig. 2 would not cause a significant difference in long-term assessment. When less-frequent observations are the only data source, for example, Landsat measurements (16-day revisit frequency), noise due to changing aerosols or observing geometry in some images would cause higher uncertainty than observed here. Hence, the conclusion that FAI is preferred for MODIS data might be extended to Landsat observations when vegetative coverage is evaluated, although a targeted Landsat-based study is still required. The FAI threshold to remove water pixels was carefully chosen from statistical analysis of long-term MODIS data, yet some uncertainties may still exist. A sensitivity analysis showed that using and resulted in nearly identical temporal patterns, although the former led to an average increase of 3.17% in vegetative coverage area. We therefore believe that was a reasonable choice for our study. For other areas where aerosol types (which determine the spectral shapes of aerosol reflectance) may be significantly different from our study reason, the may be different but can be determined in a similar manner. Except for the sharp drop in vegetative coverage due to the 2003 flooding event, the core area of the Hongze Lake national wetland nature reserve appears to be well protected during the past decade for two reasons: (1) the average FAI appeared to be stabilized with clear seasonal cycles (winter lows and summer highs, Fig. 2), indicating minimal influence from human activities and (2) FAI time-series lacked sharp changes as observed from the nearby cropland. Anthropogenic influence was therefore believed to be minimal compared to natural forcing. Indeed, the 2003 ENSO-related flooding event caused the greatest decrease in vegetative coverage during the past decade. Inundation and long hydroperiods will reduce the cover of flood-intolerant woody and upland species. Because poor gas exchange under water disrupts plant energy and carbohydrate economies, plants suffer severe growth reduction or even death when their root systems are surrounded by excess water.44–46 Even after six years, annual AVACs and SVCDs still did not reach the preflooding levels as in 2002, although they both recovered gradually to the 2000 levels. Some of these findings are consistent with those reported by Zheng et al.19 On an annual basis, sunshine duration plays a more important role than temperature and precipitation in affecting AVCAs and SVCDs. However, precipitation and sunshine duration are not completely independent, because during the rainy days sunshine hours are also reduced. Therefore, the two factors should not be viewed separately but used collectively when evaluating vegetative coverage. Ideally, threshold values for precipitation should be derived to predict future trends of vegetative coverage in response to climate change. However, it is currently difficult to determine such threshold values for three reasons: (1) the precipitation data used in this study were from a meteorological station 26 km from the wetland reserve, and there are insufficient stations to estimate precipitation for the entire watershed of the reserve; (2) the adverse impact would be more severe if precipitation were concentrated in a certain period rather than spread evenly in different seasons, but this effect is difficult to assess due to lack of complete precipitation data; and (3) plants can tolerate flooding events, depending on plant species and flooding duration,47 but the exact flooding duration was not available owing to limited data. Despite these limitations, this study presents a preliminary, but to our knowledge the first, assessment of the Hongze Lake national wetland nature research using frequent MODIS observations. There are two types of natural wetlands: coastal wetlands and inland wetlands.48 Located between temperate and subtropical zones in eastern China near a freshwater lake, our study area belongs to the latter type. There are many other wetlands and wetland reserves in China under similar climate influence (e.g., Gaoyou Lake wetland, Taihu Lake wetland, and Chaohu Lake wetland). The method demonstrated here may be extended to other wetland areas for long-term evaluations. This is particularly useful in providing baseline information, given the continuous measurements of MODIS and similar satellite instruments in the future. AcknowledgmentsFinancial support of this work was provided by the Jiangsu Agriculture Science and Technology Innovation Fund (CX-12-3053), the Three Agricultural Projects Foundation of Jiangsu (SXGC-2012-410), and the University of South Florida. We thank the China National Meteorological Information Center for providing meteorological data, NASA/GSFC for providing MODIS data, and the United States Geological Survey/Earth Resources Observation and Science Data Center for providing Landsat data. We also thank Brock Murch (USF) and two anonymous reviewers for their comments and suggestions. ReferencesJ. D. FretwellJ. S. WilliamsP. J. Redman,
“National water summary on wetland resources,”
(1996). http://pubs.usgs.gov/wsp/2425/report.pdf Google Scholar
W. J. Mitsch,
“Applying science to conservation and restoration of the world’s wetlands,”
Water Sci. Technol., 51
(8), 13
–26
(2005). WSTED4 0273-1223 Google Scholar
W. J. MitschJ. G. Gosselink, Wetlands, 3rd ed.John Wiley & Sons Press, New York
(2000). Google Scholar
P. E. Hulme,
“Adapting to climate change: is there scope for ecological management in the face of a global threat?,”
J. Appl. Ecol., 42
(5), 784
–794
(2005). http://dx.doi.org/10.1111/jpe.2005.42.issue-5 JAPEAI 0021-8901 Google Scholar
K. L. Erwin,
“Wetlands and global climate change: the role of wetland restoration in a changing world,”
Wetlands Ecol. Manag., 17
(1), 71
–84
(2009). http://dx.doi.org/10.1007/s11273-008-9119-1 WEMAEU Google Scholar
A. Barducciet al.,
“Aerospace wetland monitoring by hyperspectral imaging sensors: a case study in the coastal zone of San Rossore Natural Park,”
J. Envir. Manag., 90
(7), 2278
–2286
(2009). http://dx.doi.org/10.1016/j.jenvman.2007.06.033 JEVMAW 0301-4797 Google Scholar
B. Tianet al.,
“Analyzing the habitat suitability for migratory birds at the Chongming Dongtan Nature Reserve in Shanghai, China,”
Estuar. Coast. Shelf Sci., 80
(2), 296
–302
(2008). http://dx.doi.org/10.1016/j.ecss.2008.08.014 ECSSD3 0272-7714 Google Scholar
M. MergiliS. Privett,
“Vegetation and Vegetation-Environment Relationships at Grootbos Nature Reserve, Western Cape, South Africa,”
Bothalia, 38
(1), 89
–102
(2008). Google Scholar
J. NavratilJ. Navratilova, Wetlands: Monitoring, Modelling and Management, Taylor & Francis, London
(2007). Google Scholar
S. LiS. Qi,
“The serious damage of wetland reserve in Jilin Province, China,”
(2000) http://www.people.com.cn/GB/paper39/1673/271439.html October ). 2000). Google Scholar
A. R. HueteC. Justice,
“MODIS vegetation index (MOD13) algorithm theoretical basis document,”
(1999). http://modis.gsfc.nasa.gov/data/atbd/atbd_mod13.pdf Google Scholar
A. R. HueteC. JusticeH. Liu,
“Development of vegetation and soil indices for MODIS-EOS,”
Remote Sens. Environ., 49
(3), 224
–234
(1994). http://dx.doi.org/10.1016/0034-4257(94)90018-3 RSEEA7 0034-4257 Google Scholar
R. SivanpillaiA. V. Latchininsky,
“Mapping locust habitats in the Amudarya River Delta, Uzbekistan with multi-temporal MODIS imagery,”
Envir. Manag., 39
(6), 876
–886
(2007). http://dx.doi.org/10.1007/s00267-006-0193-y 0364-152X. Google Scholar
B. Zhaoet al.,
“Monitoring rapid vegetation succession in estuarine wetland using time series MODIS-based indicators: an application in the Yangtze River Delta area,”
Ecol. Indic., 9
(2), 346
–356
(2009). http://dx.doi.org/10.1016/j.ecolind.2008.05.009 Google Scholar
L. Wanget al.,
“A new time series vegetation-water index of phonological-hydrological trait across species and functional types for Poyang Lake wetland ecosystem,”
Remote Sens. Environ., 125 49
–63
(2012). http://dx.doi.org/10.1016/j.rse.2012.07.003 RSEEA7 0034-4257 Google Scholar
M. L. Zoffoliet al.,
“Seasonal and interannual analysis of wetlands in South America using NOAA-AVHRR NDVI time series: the case of the Parana Delta Region,”
Landsc. Ecol., 23
(8), 833
–848
(2008). http://dx.doi.org/10.1007/s10980-008-9240-9 LAECEH 0921-2973 Google Scholar
T. M. LeeH. C. Yeh,
“Applying remote sensing techniques to monitor shifting wetland vegetation: a case study of Danshui River estuary mangrove communities, Taiwan,”
Ecol. Eng., 35
(4), 487
–496
(2009). http://dx.doi.org/10.1016/j.ecoleng.2008.01.007 0925-8574 Google Scholar
X. Zhanget al.,
“Conservation of wetland soil C stock and climate change of China (in Chinese, with English abstract),”
Adv. Clim. Chang. Res., 4
(4), 202
–208
(2008). http://dx.doi.org/10.3969/j.issn.1673-1719.2008.04.002 1673-1719 Google Scholar
Y. Zhenget al.,
“Protection efficacy of national wetland reserves in China,”
Chin. Sci. Bull., 57
(10), 1116
–1134
(2012). http://dx.doi.org/10.1007/s11434-011-4942-9 CSBUEF 1001-6538 Google Scholar
L. Zhang,
“Primary study on eco-tourism in wetland in Hongze Lake area (in Chinese, with English abstract),”
Yunnan Geogr. Environ. Res., 20
(6), 109
–111
(2008). http://dx.doi.org/10.3969/j.issn.1001-7852.2008.06.022 Google Scholar
L. ZhangM. ZhangJ. Zhou,
“Achievements and suggestions of the construction of Hongze Lake wetland national nature reserve (in Chinese, with English abstract),”
J. Hebei Agric. Sci., 12
(12), 66
–67
(2008). http://dx.doi.org/10.3969/j.issn.1088-1631.2008.12.032 Google Scholar
H. DaiZ. Yang,
“Investigation of wetland ecological condition in Hongze Lake (in Chinese, with English abstract),”
Environ. Sci. Technol., 25
(2), 37
–39
(2002). http://dx.doi.org/10.3969/j.issn.1003-6504.2002.02.015 ESTHAG 0013-936X Google Scholar
L. Zhang,
“Research of eco-tourism development of Hongze Lake wetland of national nature reserve (in Chinese, with English abstract),”
China For. Econ., 3 9
–11
(2008). http://dx.doi.org/10.3969/j.issn.1673-5919.2008.03.003 Google Scholar
E. Chu,
“Study on the hydrological characteristics of Hongze Lake (in Chinese),”
Hydrology, 21
(5), 56
–59
(2001). http://dx.doi.org/10.3969/j.issn.1000-0852.2001.05.018 1000-0852 Google Scholar
S. Frazier, Directory of Wetlands of International Importance, NHBS Press, San Jose, Costa Rica
(1999). Google Scholar
S. Yang,
“Study on protection and sustainable use of wetland around Hongze Lake (in Chinese, with English abstract),”
Chongqing Environ. Sci., 25
(2), 15
–17
(2003). http://dx.doi.org/10.3969/j.issn.1674-2842.2003.02.006 Google Scholar
Z. Q. ChenC. M. HuF. Muller-Karger,
“Monitoring turbidity in Tampa Bay using MODIS/Aqua 250-m imagery,”
Remote Sens. Environ., 109
(2), 207
–220
(2007). http://dx.doi.org/10.1016/j.rse.2006.12.019 RSEEA7 0034-4257 Google Scholar
B. D. WardlowS. L. EgbertJ. H. Kastens,
“Analysis of time-series MODIS 250 m vegetation index data for crop classification in the US Central Great Plains,”
Remote Sens. Environ., 108
(3), 290
–310
(2007). http://dx.doi.org/10.1016/j.rse.2006.11.021 RSEEA7 0034-4257 Google Scholar
S. D. PrinceI. Becker-reshefK. Rishmawi,
“Detection and mapping of long-term land degradation using local net production scaling: application to Zimbabwe,”
Remote Sens. Environ., 113 1046
–1057
(2009). http://dx.doi.org/10.1016/j.rse.2009.01.016 RSEEA7 0034-4257 Google Scholar
R. Fensholtet al.,
“Evaluation of earth observation based long term vegetation trends: intercomparing NDVI time series trend analysis consistency of Sahel from AVHRR GIMMS, Terra MODIS and SPOT VGT data,”
Remote Sens. Environ., 113
(5), 1886
–1898
(2009). http://dx.doi.org/10.1016/j.rse.2009.04.004 RSEEA7 0034-4257 Google Scholar
E. F. Vermoteet al.,
“Second simulation of the satellite signal in the solar spectrum, 6S: an overview,”
IEEE Trans. Geosci. Remote Sens., 35
(3), 675
–686
(1997). http://dx.doi.org/10.1109/36.581987 IGRSD2 0196-2892 Google Scholar
D. W. Deering,
“Rangeland reflectance characteristics measured by aircraft and spacecraft sensors,”
Texas A&M University,
(1978). Google Scholar
C. Hu,
“A novel ocean color index to detect floating algae in the global oceans,”
Remote Sens. Environ., 113
(10), 2118
–2129
(2009). http://dx.doi.org/10.1016/j.rse.2009.05.012 RSEEA7 0034-4257 Google Scholar
A. R. Hueteet al.,
“Overview of the radiometric and biophysical performance of the MODIS vegetation indices,”
Remote Sens. Environ., 83
(1), 195
–213
(2002). http://dx.doi.org/10.1016/S0034-4257(02)00096-2 RSEEA7 0034-4257 Google Scholar
A. R. HueteR. D. JacksonD. F. Post,
“Spectral response of a plant canopy with different soil backgrounds,”
Remote Sens. Environ., 17
(1), 37
–53
(1985). http://dx.doi.org/10.1016/0034-4257(85)90111-7 RSEEA7 0034-4257 Google Scholar
A. R. Huete,
“A soil-adjusted vegetation index (SAVI),”
Remote Sens. Environ., 25
(3), 295
–309
(1988). http://dx.doi.org/10.1016/0034-4257(88)90106-X RSEEA7 0034-4257 Google Scholar
H. LiuA. Huete,
“A feedback based modification of the NDVI to minimize canopy background and atmospheric noise,”
IEEE Trans. Geosci. Remote Sens., 33
(2), 457
–465
(1995). http://dx.doi.org/10.1109/36.377946 IGRSD2 0196-2892 Google Scholar
A. R. Hueteet al.,
“A comparison of vegetation indices over a global set of TM images for EOS-MODIS,”
Remote Sens. Environ., 59
(3), 440
–451
(1997). http://dx.doi.org/10.1016/S0034-4257(96)00112-5 RSEEA7 0034-4257 Google Scholar
A. V. RochaG. R. Shaver,
“Advantages of a two band EVI calculated from solar and photosynthetically active radiation fluxes,”
Agric. For. Meteorol., 149
(9), 1560
–1563
(2009). http://dx.doi.org/10.1016/j.agrformet.2009.03.016 0168-1923 Google Scholar
C. Huet al.,
“Moderate resolution imaging spectroradiometer (MODIS) observations of cyanobacteria blooms in Taihu Lake, China,”
J. Geophys. Res., 115
(c4), C04002
(2010). http://dx.doi.org/10.1029/2009JC005511 JGREA2 0148-0227 Google Scholar
R. G. TangX. XueR. J. Zhi,
“Analyzing the hydrological characteristic of Hongze Lake during ENSO event by observations precipitation data (in Chinese),”
Jiangsu Water Res., 7 27
–29
(2003). http://dx.doi.org/10.1016/10.3969/j.issn.1007-7839.2003.07.015 Google Scholar
Z. YeG. ZhuB. Jiang,
“Analysis on features of Lake Hongze flood hazards for the recent 100 years (in Chinese, with English abstract),”
Water Res. Hydropower Eng., 36
(3), 62
–65
(2005). http://dx.doi.org/10.1016/10.3969/j.issn.1000-0860.2005.03.018 1000-0860 Google Scholar
B. Ratner, Statistical Modeling and Analysis for Database Marketing: Effective Techniques for Mining Big Data, CRC Press, Boca Raton
(2003). Google Scholar
L. A. Voeseneket al.,
“How plants cope with complete submergence,”
N. Phytol., 170
(2), 213
–226
(2006). http://dx.doi.org/10.1111/j.1469-8137.2006.01692.x Google Scholar
J. Bailey-SerresL. A. Voessenek,
“Flooding stress: acclimations and genetic diversity,”
Ann. Rev. Plant Biol., 59 313
–339
(2008). http://dx.doi.org/10.1146/annurev.arplant.59.032607.092752 ARPBDW 1543-5008 Google Scholar
C. L. StrohD. De StenvenG. R. Guntenspergen,
“Effect of climate fluctuations on long-term vegetation dynamics in Carolina Bay wetlands,”
Wetlands, 28
(1), 17
–27
(2008). http://dx.doi.org/10.1672/06-117.1 0277-5212 Google Scholar
Z. Ye,
“A study and appraisal on ecological vulnerability system in Hongze Lake wetland (in Chinese, with English abstract),”
Res. Soil Water Conserv., 15
(6), 245
–249
(2008). Google Scholar
“Convention on wetlands of international importance especially as waterfowl habitat,”
(1971). http://www.ramsar.org/cda/en/ramsar-documents-tests/main/ramsar/1-31-38_4000_0__ Google Scholar
|
||||||||||||||||||||||||||||||||||||||||||||||||||||||||||||||||||||||||||||||||||||||||||||||||||||||||||||||||||||||||||||||||||||||||||||||||||||||||||||||||||||||||||||||||||||||||||||||||||||||||||


