|
|
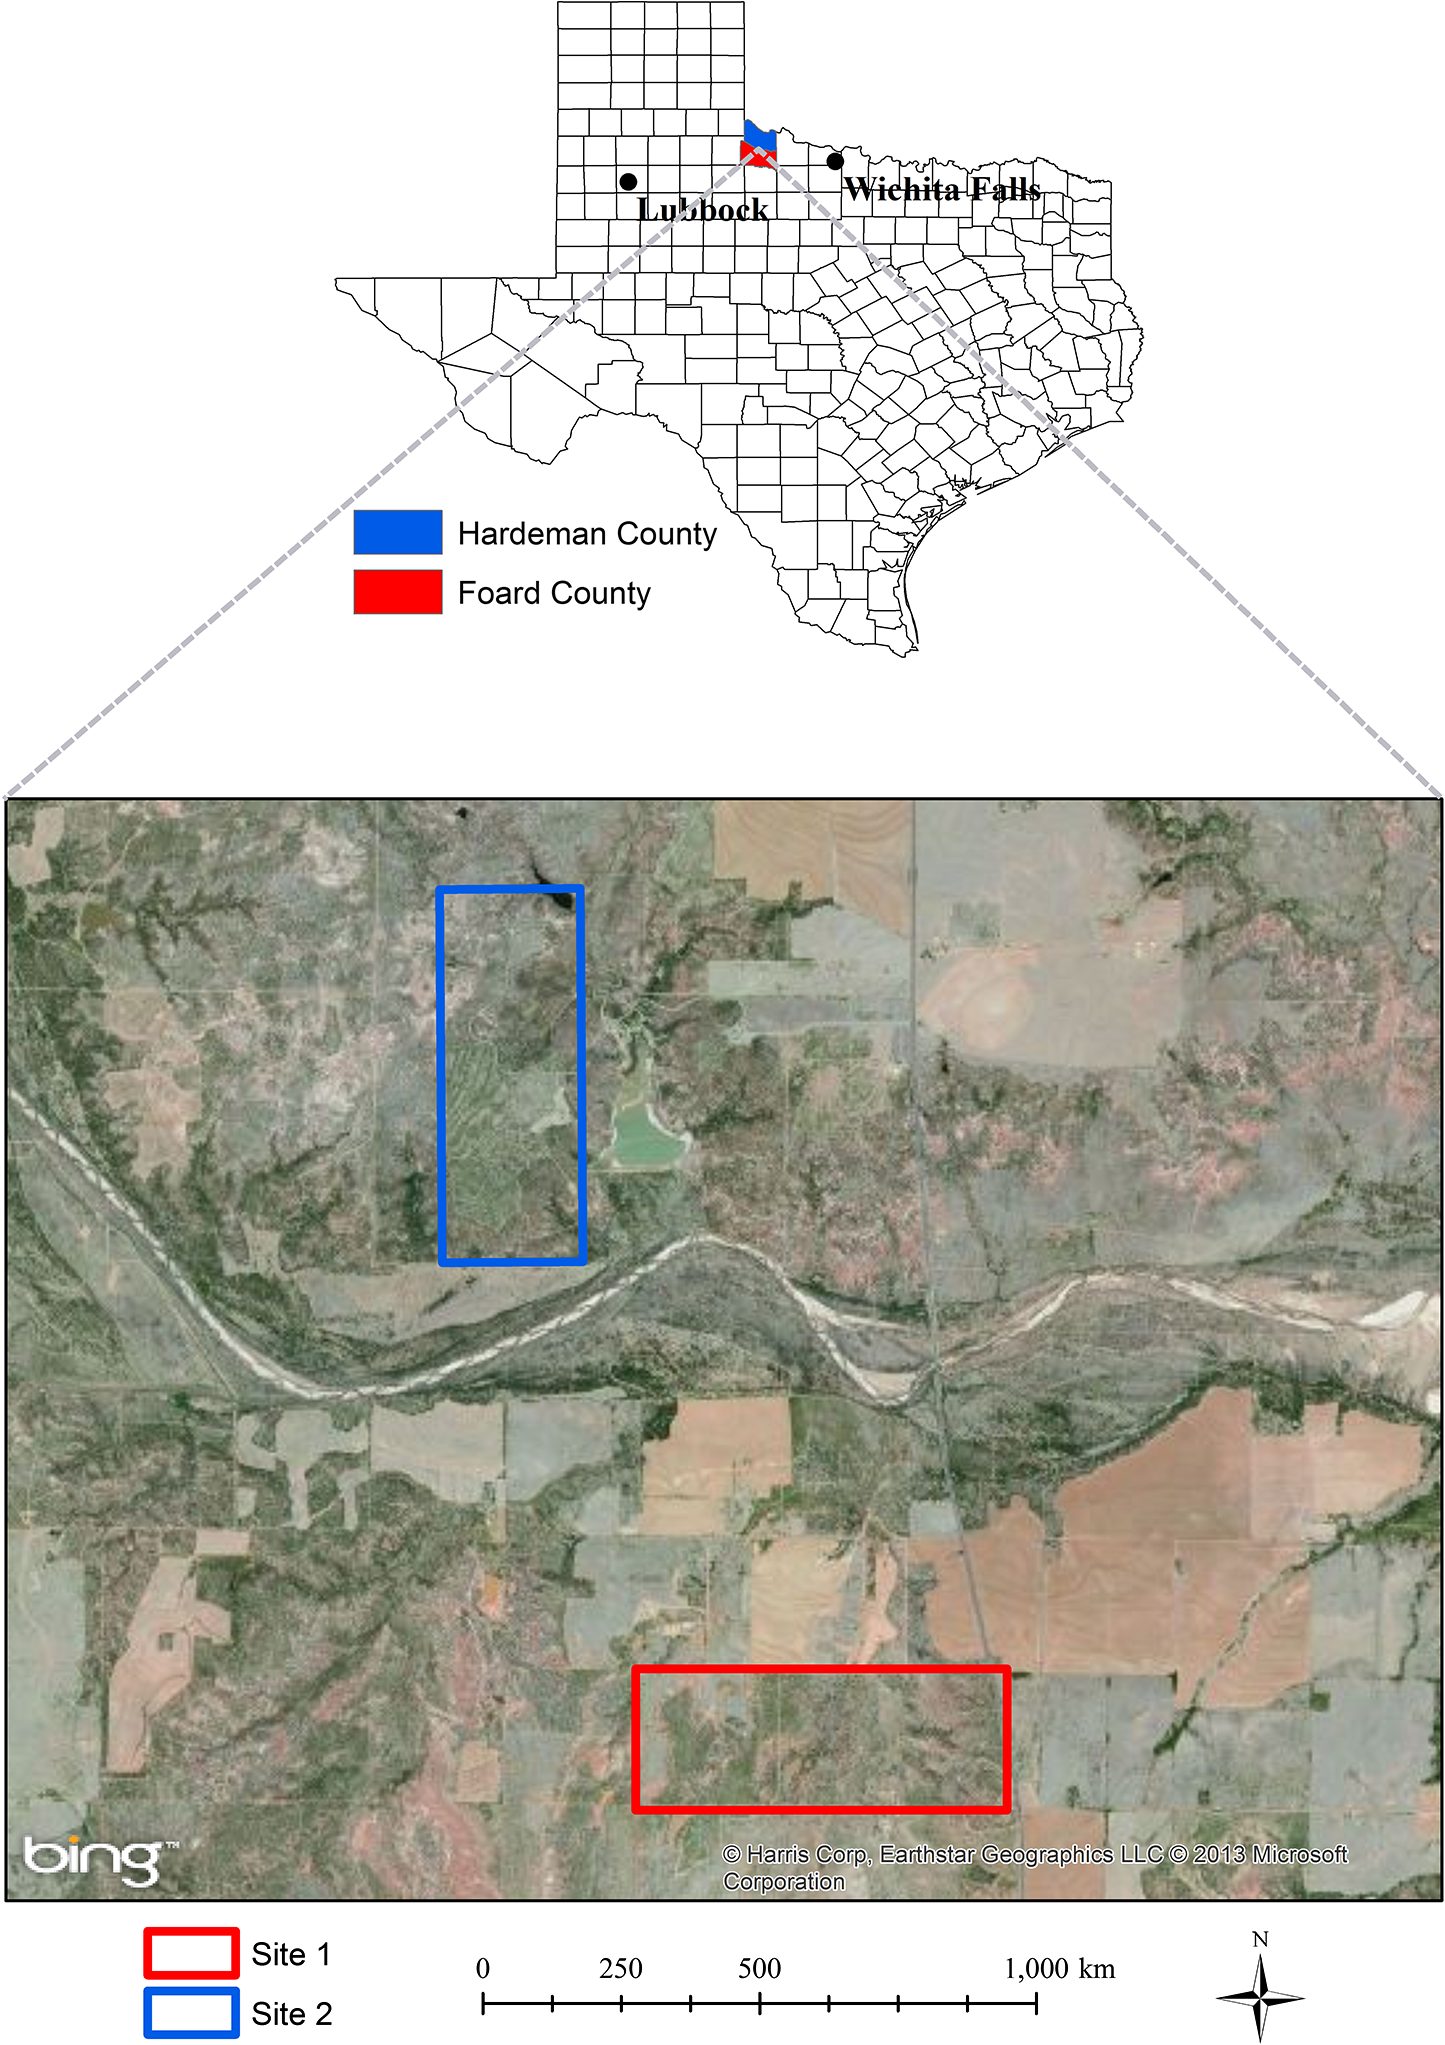
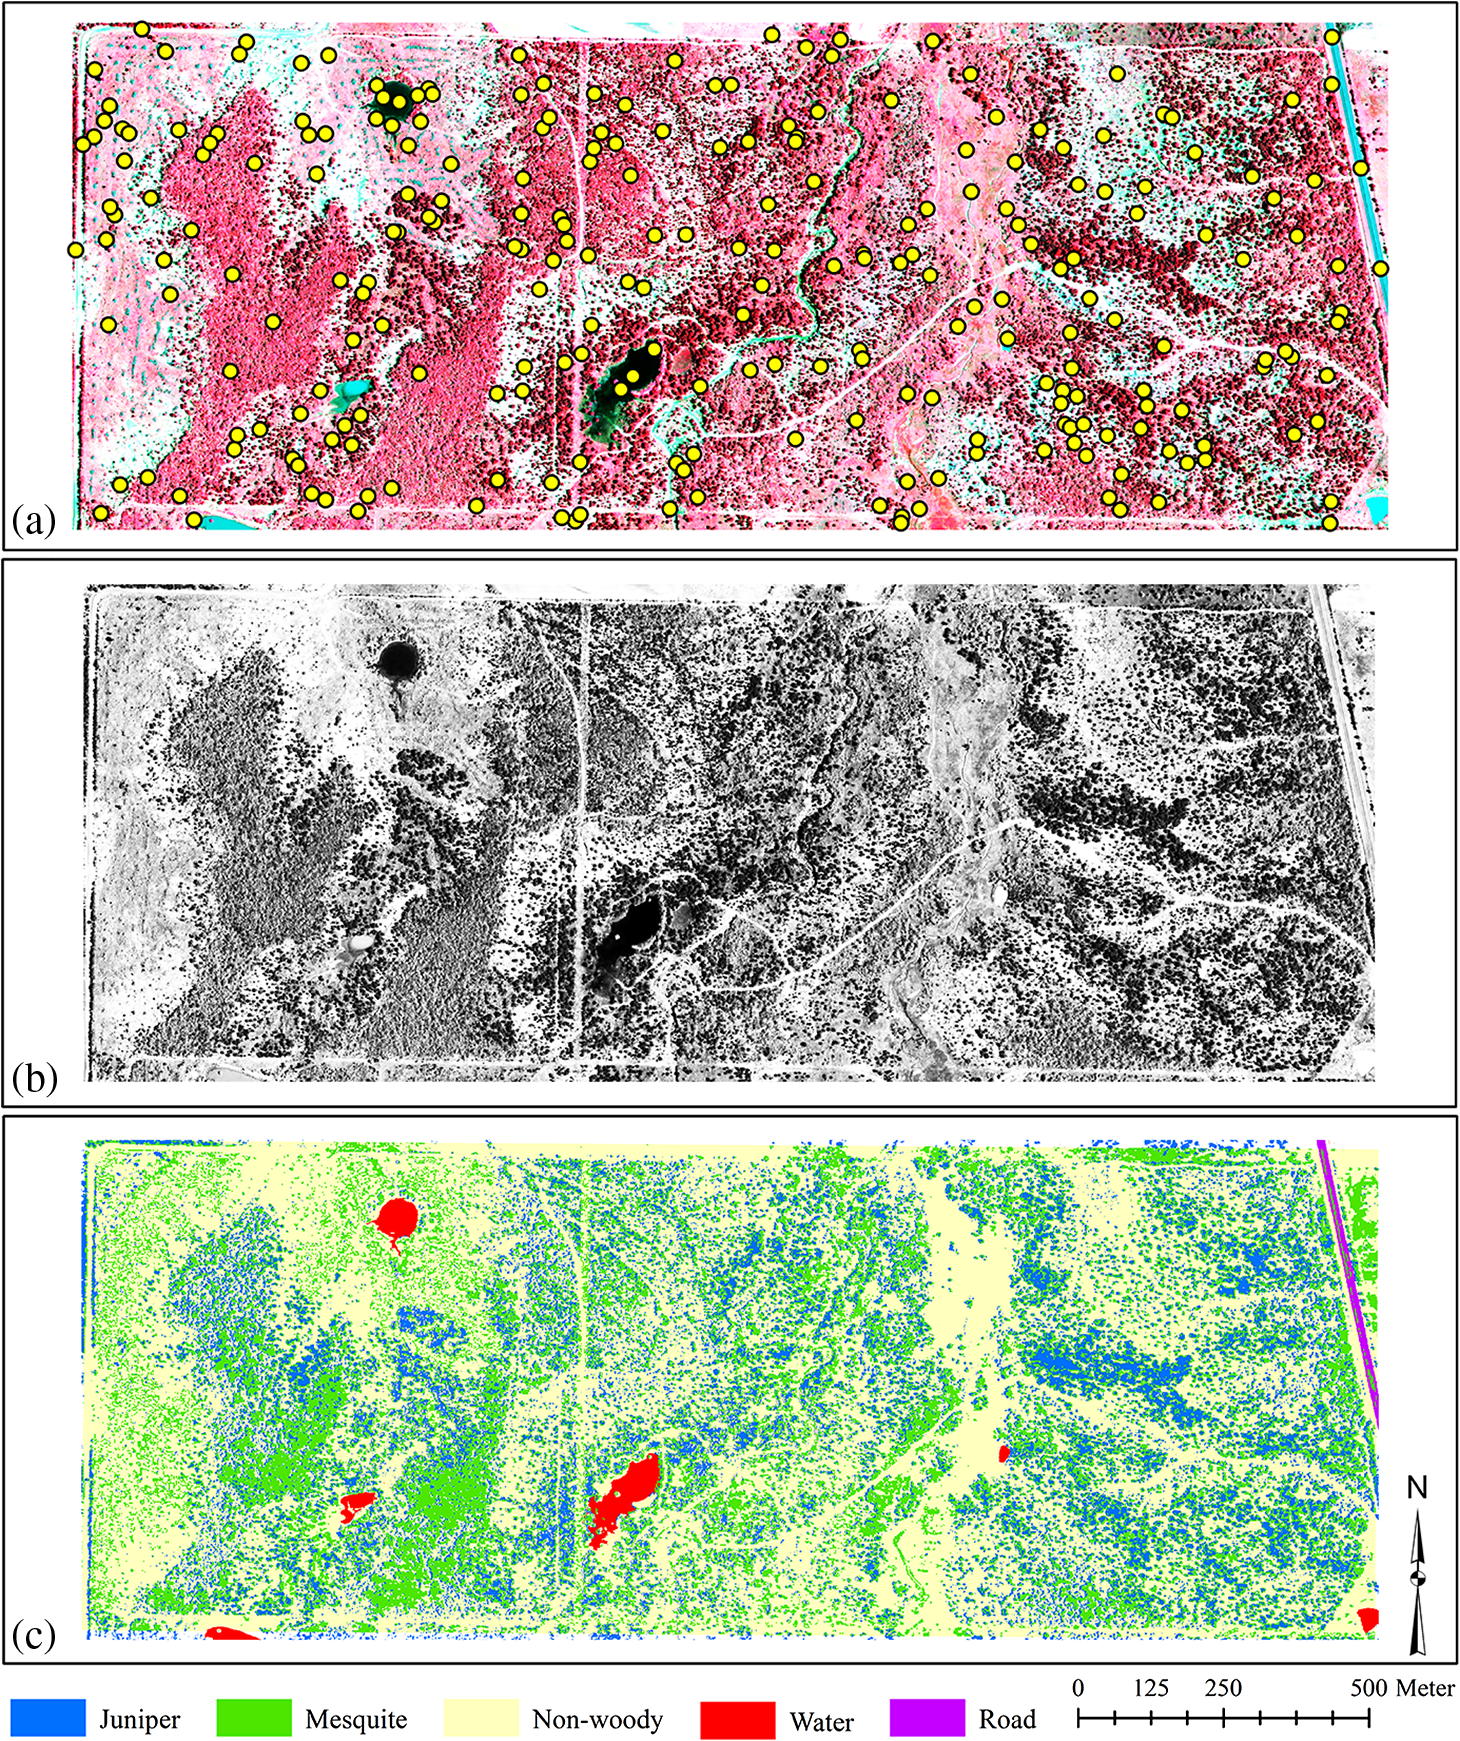
1.IntroductionInvasive plant species are well known for their successful exploitation of natural resources (e.g., water, space, light, and nutrients). This ensues their aggressive and competitive behavior, prolific seed production, and seed longevity.1,2 Invasive weeds are capable of moving from small, manageable infestation to larger areas reaching levels where control is either economically prohibitive and/or cause significant ecological damage.3 Because of their rapid spreading potential and threat to biodiversity and ecosystem processes, invasive plant species have been a long-standing concern to natural resource managers, ecologists, and biological conservationists.4–6 Invasion may alter nutrient cycling, regional hydrologic processes, carbon sequestration, herbaceous production, diversity and composition, and soil erosion characteristics.2,5,7–9 Some invasive species can dominate the vegetative canopy and eventually can form monotypic stands.10 Weed infestation is considered a major reason for loss in global biodiversity including species extinction.6,7,11–17 There is an abundance of redberry juniper (Juniperus pinchotii Sudw; juniper hereafter) and honey mesquite (Prosopis glandulosa Torr; mesquite hereafter) across vast areas of the southern Great Plains of the United States. Both species are native to the region but they are considered “native invasives.” Their encroachment into grasslands and rangelands has been widely attributed to reduced fire intensity and frequency and livestock overgrazing.15,16,18–20 Although there is a common ground that fire suppression and livestock grazing have facilitated woody invasion in the region, some argue that decreased lumbering, increased carbon dioxide emission, landscape fragmentation, and climate change have also accelerated encroachment.21,22 However, invasion by both mesquite and juniper species may also be beneficial to wildlife habitat,23,24 ecosystem carbon storage,25 recreational activity,8 soil stabilization24 and bio-energy production.8,18 Furthermore, juniper and mesquite encroachment in this region has given rise to increased above- and below-ground biomass, root density, soil nitrogen and carbon, and soil microbial biomass pool.26–28 Numerous remote sensing studies have been conducted for detection and mapping of a large number of native and non-native invasive plant species using imagery.4,6–8,11,24,29–33 Remote detection of invasive plant species using geospatial imagery may substantially improve monitoring, planning, and management practices by overcoming some of the shortcomings of ground-based surveys such as observer bias and inaccessibility to certain locations. Remote sensing techniques for accurate mapping of invasion offer a unique set of advantages including repeatability, large area coverage, and cost-effectiveness over ground-based methods over time and space.34–36 Extent of mesquite distribution has been well reported from southwestern United States, South America, Australia, and India,37–40 while that of juniper distribution is well recorded.19,41–43 As both species occupy a significant area of grasslands and rangelands, their invasion has raised several environmental concerns around the world. Information about their specific canopy coverage and distinction from surrounding land cover classes, however, is lacking. In addition, since management practices and mode of interaction with ecosytem process differ between these species, accurate identification of these species is critical, especially when they occur in intermixed stands. Our objectives were to: (1) explore the ability of a gray scale near infrared (NIR) band of multispectral aerial imagery to detect and map land cover types dominated by juniper and mesquite at two sites in north central Texas, (2) use this method of analysis to separately map juniper and mesquite canopy cover, and (3) assess and compare the mapping accuracies between the sites. 2.Materials and Methods2.1.Study AreaThe study sites were located near the town of Crowell, about 132 km west of Wichita Falls and 241 km east of Lubbock in north central Texas (Fig. 1): site 1 (Whatley Ranch), 34°4’N, 99°44’ W, elevation 436 m in Foard County; and site 2 (Copper Breaks State Park), 34°6’N, 99°45’W, elevation 443 m in Hardeman County. The land area of each site was 187 ha. The 30-year mean annual rainfall at Crowell is 616 mm.16 The sites were characterized by similar soil types and dominated by juniper and mesquite with varying densities. Herbaceous understory consists of numerous cool season () and warm season () grass species dominated by perennial grasses, tobosagrass (Pleuraphis mutica Buckl.) and buffalograss (Bouteloua dactyloides [Nutt.] J.T. Columbus). Other grasses are mid-grass Texas wintergrass (Nassella leucotricha [Trin. and Rupr.] Pohl.), annual grass Japanese brome (Bromus japonicus Thunb. ex Murray) and other mid-grasses such as vine mesquite (Panicum obtusum Kunth), sideoats grama (Bouteloua curtipendula [Michx.] Torr.), and dropseeds (Sporobolus spp.).16 Soils are fine-silty, mixed, thermic Typic Calciustolls of the Quanah series and fine-silty, montmorillonitic, thermic typic Haplusterts of the Hollister series.16 2.2.Remote Sensing ImageryA county-level color infrared aerial image of Hardeman County, covering both sites, was obtained from the National Agricultural Imagery Program (NAIP) provided by the Natural Resources Conservation Service Geospatial Data Gateway ( http://datagateway.nrcs.usda.gov/). The NAIP image was a 3-band digital aerial image with a spatial resolution of 1-m taken on August 12, 2010. The image was projected to the Universal Transverse Mercator North American Datum 1983 Zone 14 North by the provider. The image was extracted for the study sites using ArcGIS (ESRI Inc., Redlands, California). 2.3.Imagery ClassificationAfter visually evaluating a few classification methods (minimum distance, maximum likelihood, spectral angle mapper, neural net, etc.) in Environment for Visualizing Images (ENVI; Exelis Visual Information Solutions, Boulder, Colorado), the support vector machine (SVM) classifier was selected for our objectives due to its superior ability to detect live vegetation. The SVM is a supervised machine learning method that performs classification based on the statistical learning theory. The SVM classifies data by separating a hyperplane that provides the best separation between classes in a multidimensional feature space. This hyperplane is the decision surface on which the optimal class separation takes place. The optimal hyperplane is the one that maximizes the distance between the hyperplane and the nearest positive and negative training example called the margin. From a given set of training samples, the optimization problem is solved to find the hyperplane that leads to a sparse solution. Although the SVM is a binary classifier in its simplest form, implementation of the SVM classifier in ENVI was extended to more than two classes by splitting the problem into a series of binary class separations (ENVI User’s Guide). In order to represent more complex shapes than linear hyperplanes, a variety of kernels including the polynomial, the radial basis function, and the sigmoid can be used for performing SVM classification in ENVI. The SVM was employed using the radial basis function kernel for performing the pairwise classification. A penalty parameter also can be introduced to the SVM classifier to allow for misclassification during the training process. The penalty parameter was set to its maximum value, whereas a classification probability threshold of zero was used in order to classify all pixels (ENVI User’s Guide). Default settings of this classifier were used for image classifications. During the classification process, only NIR band of the NAIP imagery was chosen using the spectral subset option in ENVI. 2.4.Extraction of Training SamplesThe 1-m NAIP image allowed clear, visual identification of all dominant land cover classes based on the spectral contrast among the live vegetation (juniper, mesquite, herbaceous) and senescent herbaceous or nonvegetative components (paved road, shadow, exposed soil, water) [Figs. 2(a), 2(b), 3(a), and 3(b)]. Previous studies have found significant differences in reflectance between Ashe juniper (Juniperus ashei Buchholz), mesquite, water, exposed soil, and herbaceous plants.24,31,44,45 In addition, reflectance variation within a deciduous crown is greater than that within a coniferous tree crown because of the nonconical shape, larger branches, and shaded area caused by the neighboring branches.46 Thus, respective training samples to perform image classification were manually extracted from isolated trees and areas on the image.47 Training samples consisted of 5 to 10 polygons, each having 25 to 50 pixels, from pure canopy or each land cover type at identified locations on the ground and on the image. The SVM analysis was performed for the following land cover classes: juniper, mesquite, live herbaceous, senescent herbaceous, bare ground, water, shadow, and paved road. Exposed soil, shadow, dirt roads, live and senescent herbaceous land cover classes were grouped together into a nonwoody class that resulted in a five-category final classification map for each site: juniper, mesquite, nonwoody, water, and paved road. 2.5.Accuracy AssessmentAccuracy assessment for classification was made by constructing an error matrix for each classified image, which compares, on a group by group basis, the relationship between reference categories on the ground and corresponding classified categories on the image. Error matrices for each classification map were generated by comparing the classified classes with the ground verification data. Error matrices were computed to evaluate the classification accuracy including the overall, producer’s, and user’s accuracies. There is no single established standard for selection of the image and ground areas for comparison.46,48–50 Because a pixel in an image represents only an arbitrary location on the ground, and positional errors of maps and global positioning system receivers become significant with smaller pixel sizes, areas based on geographic information system polygons are used frequently.48 However, using individual pixels is appropriate if a per-pixel classification is assessed for accuracy.51,52 This avoids problems caused by generating “homogeneous” polygons on a landscape. It has also been observed that pixel positional error results in conservative bias of the accuracy assessment.53 Therefore, the unavoidable positional error introduced into this assessment would result in lower or conservative estimates of mapping accuracy.49 Field validation (accuracy assessment) was performed using verification data (ground control points) at sites. Verification data for 250 locations at each site were randomly generated using the “create random points” function in ArcGIS [Figs. 2(a) and 3(a)]. The verification points were loaded into a real time differential Trimble GeoXH Global Positioning System (Trimble Navigation Limited, Sunnyvale, California) equipped with the ArcPad (ESRI Inc. Redland, California) software package and a 4-m external antenna, providing a submeter horizontal accuracy (10-cm), and navigated prior to image classification at sites. This created an unbiased field validation method that was visited at sites without any prior knowledge of whether specific locations were delineated for the respective land cover categories by the classification method. Actual land cover type on each of the 250 locations was assessed at the sites and assigned to points that were navigated using the GPS unit. Subsequent to image classification, these points were overlain on the land cover map and a one-to-one matching was performed to contract an error matrix for each site. In addition to accuracy assessment for classified maps and individual land cover classes, kappa coefficients and kappa variances were determined from the error matrix and a two-tailed -test () was performed to compare image classification between sites at the 95% confidence level.54–56 The kappa statistic is an estimate of agreement or accuracy between the imagery-derived classification map and the ground verification data. This is characterized by: (1) the major diagonal and (2) the chance agreement by taking into account of the row and column totals estimates. Kappa values range between 0 and 1, with values representing strong agreement between the classified map and ground truth and values representing poor agreement. Values between 0.40 and 0.80 indicate moderate agreement with the ground truth data.57 3.ResultsFigures 2(a), 2(b), 3(a), and 3(b) show the CIR composite (a) and the grayscale NIR NAIP images (b) for sites 1 and 2, respectively. The CIR composite imagery reveals distinct spatial patterns of juniper, mesquite, herbaceous, and other land cover classes on each site. On the CIR composite image, mesquite is characterized by a lighter reddish tone, juniper by a dark reddish color, herbaceous plants by a grayish to pinkish response (along intermittent stream segments), exposed soil and paved road by a white to light blue color, and water by black or blue tones [Figs. 2(a) to 3(a)]. On the corresponding gray scale NIR image, juniper has a distinct darker gray tone than mesquite which in turn is darker than the herbaceous species (along intermittent stream segments). Exposed soil (bare ground or dirt road) has the brightest white color with distinct shape and spatial geometry on both images. Paved road has a similar gray color as the herbaceous species, but with same spatial characteristics of dirt road. Water varies from having dark gray to bright color with a texture noticeably differing from the other features [Figs. 2(b) to 3(b)]. Image classification resulted in 27.74% juniper, 24.45% mesquite, 0.91% water, 0.36% road, 46.54% nonwoody for site 1 [Fig. 2(c)], whereas 35.43%, 4.87%, 1.01%, 2.03%, and 56.66% were classified as juniper, mesquite, water, road, and nonwoody land cover classes, respectively, at site 2. Land cover classes were identified with the overall accuracy of 90.4% with the associated kappa coefficient of 0.86 for site 1 and 89.2% with kappa coefficient of 0.85 for site 2 (Table 1). The producer’s accuracies ranged from 85.7% for water to 100% for road, while the user’s accuracies varied from 50% for water to 100% for paved road at site 1 (Table 1). The highest and the lowest producer’s accuracies were found for nonwoody (91.67%) and water (77.78%) classes, respectively, at site 2 (Table 1). The classification for the same site had the highest and the lowest user’s accuracies of 94.20% and 53.85%, respectively, for the juniper and water land cover classes (Table 1). The -statistics () indicated an insignificant difference between the classifications for sites at 95% probability level. Table 1Error matrices for image classifications generated from the reference and classified data for study sites.
Note: Classified C: classified category; UA: user’s accuracy; PA: producer’s accuracy; OA: overall accuracy; KC: kappa coefficient; KV: kappa variance. Both sites were similar in the degree to which juniper was misidentified as mesquite and mesquite was misidentified as juniper. Juniper was misidentified as mesquite 4.2% and 3.0% of the time at sites 1 (3/72) and 2 (2/67), respectively. In contrast, the error for misidentifying mesquite as juniper was slightly higher at 6.6% and 5.3% at sites 1 (4/61) and 2 (1/19), respectively. Averaged over both sites, misidentification of juniper as mesquite was 3.6% and mesquite as juniper was 6.0%. 4.DiscussionThis study evaluated the usefulness of geospatial aerial imagery to detect and map intermixed juniper and mesquite distribution on rangeland settings, a land cover type typical for much of the south central and southwestern US. Accurate and timely information concerning current extent of juniper and mesquite over large and inaccessible areas using a relatively cost-effective and quick method can be used for various fields of rangeland ecology and management. We used freely available NAIP imagery currently over the study region for mapping mesquite and juniper at the species level. Our accuracy assessment indicated that land cover classes were successfully mapped with an overall accuracy > 89% with the individual class accuracies ranging from 50% to 100%. The lowest class accuracy (50%) was found for water. This probably resulted from: (1) similar spectral patterns for juniper tree shadow and water bodies in presence of dense aquatic weeds, and (2) few validation points randomly generated for the water land cover class. Separation of different rangeland woody species on an image has received limited attention in the literature. Phenological, structural, and spectral characteristics of plant species have been utilized to distinguish one woody species from another. In a study in central Texas, reflectance spectra of honey mesquite, Ashe juniper, senescing grass, mixed herbaceous, and some other woody plants were recorded in late summer using a hyperspectral handheld field spectroradiometer.45 Mesquite had higher visible and NIR reflectance than Ashe juniper. The shift from higher to lower reflectance occurred around 720 nm. A similar observation was made by the authors in Ref. 44 who reported that Ashe juniper had lower visible and NIR reflectance compared to mesquite in the spectrum they examined. Some juniper and mesquite plants with small canopies might have been classified as nonwoody land cover with the classification method employed in this study. We found that a juniper plant with a 1.75-m canopy diameter and canopy area was undetected with the algorithm used to classify the same imagery. Visual inspection of ground-level images of this plant revealed that the plant was growing on 100% bare soil which suggested that small plants may remain undetected on such soils. Accurate monitoring of semiarid vegetation using remote sensing is hindered by the effects of bare soil because of an “overexposure” effect that washes out smaller objects on the image.58 The correlation between measured woody-plant cover from image classification and ground-based measurements depends strongly on the: (1) image resolution, (2) size of the plants or clusters under surveillance, and (3) time of image acquisition.59–63 In a southern New Mexico study, only 29% of shrubs with canopy areas in size were correctly classified, while 87% of all shrubs with canopies were detected using an image with a spatial resolution 0.86 m.61 In contrast to these studies, a study in Arizona found that the overall classification accuracy for mapping shrub cover dominated by velvet mesquite (Prosopis velutina) derived from a 1-m spatial resolution image was greater than 0.6-m resolution image.59 An image with a spatial resolution of 1-m or less was recommended to estimate percent cover and the areas of individual shrubs in the south-central Mohave Desert in California.60 An optimal pixel size of 6-m or less has been suggested for studying functional properties of chaparral and grassland in southern California using hyperspectral data.62 It is likely that in our study, several newly recruited mesquite and juniper trees with canopy areas were missed in the 1-m image unless the trees were clustered. However, it is also very likely that mesquite or juniper cover within mesquite or juniper clusters and thickets was overestimated because small gaps between canopies were missed. The same conclusion can be given regardless of image pixel size for individual trees or shrubs of different species within a dense patch of other woody species. We are uncertain as to why a slightly higher level of inaccuracy occurred in misidentifying mesquite as juniper (average 6.0% over both sites) compared to misidentifying juniper as mesquite (avg. 3.6%). Due to within-canopy and canopy versus canopy shading effects, there may have been portions of mesquite canopies that exhibited a darker red spectral color and these in some cases were misidentified as juniper canopies. The potential for this error toward a darker color is probably greater than for sunlight portions of juniper canopies becoming sufficiently lighter red or pink to the point of being mistaken as mesquite canopies. This may be due to the conical canopy shape and more uniform reflectance of evergreen juniper species compared to deciduous species as has been noted.46 Regardless, the error margins of cross misidentification between these two woody species were in all cases and were thus not a large concern but more sites with an equal mix of the two species need to be assessed. Our ability to utilize aerial images for quantifying trends and patterns of woody plant cover depends on several factors.59 Spatial, spectral, and radiometric resolutions along with the image scale, image processing methods, atmospheric haze, shadow, terrain effects, angle between the sensor and vegetative layers, relative contrast between vegetative layers and background, canopy architecture, crown size and height, and plant density greatly influence detection capabilities of remotely sensed image.64,65 In cases where canopies of individuals of the same plants or different plants overlap, it cannot be reliably determined from top-down perspective whether a given image object represents one large plant, multiple plants of the same species, or multiple plants of different species.59 5.ConclusionsRemote sensing techniques offer a unique set of algorithms for detecting and mapping plant species and can potentially characterize the extent of an invasion by distinguishing the invading species from the rest of the vegetation mosaic in a timely and spatial manner. This study investigated the use of aerial imagery with 1-m spatial resolution and the SVM classifier for separating juniper, mesquite, and co-occurring herbaceous vegetation in two grassland environments that had been invaded by woody species mesquite and juniper. Given the economic and ecological consequences of invasion by these woody plants, our results clearly indicate that aerial imagery is a valuable tool for identifying and mapping the extent invasion with a high level of accuracy. The 1-m scale level of resolution appeared to be adequate in mapping both mesquite and juniper with the exception of mapping very small plants with -m-diameter canopies. For these plants a higher resolution image may be necessary. This might be critical if the goal is to detect the very early stages of invasion with juvenile plants. These maps can be used for monitoring and planning control measures for both species studied. The ability of the support vector machine (SVM) classifier to accurately separate juniper canopies from those of mesquite also has advantages in estimating biomass levels of each species and determining the extent and type of treatments required for woody invasion mitigation, which can be different for different shrub species. The use of 1-m spatial resolution aerial imagery for obtaining estimates of infestation by undesirable rangeland species was shown in this study and it is recommended that this methodology and technology should be considered when high scale maps are needed for research and land management purposes. AcknowledgmentsThis research was funded in part by a grant from John Deere Renewables Inc., Biomass Energy Resources LLC and the Texas A&M AgriLife Bioenergy Initiative. Copper Breaks State Park and the Whatley Ranch, Crowell, Texas, provided research sites for this project. Images used in this study were made available by the USDA-NRCS NAIP program. We thank Mimi Roy for technical discussion and Andy Bell for assisting with data collection. We also express our thanks to the two anonymous reviewers and the editor, who made critical suggestions and comments to improve the manuscript. ReferencesR. S. FletcherJ. H. EverittH. S. Elder,
“Evaluating airborne multispectral digital video to differentiate giant salvinia from other features in northeast Texas,”
Remote Sens., 2
(10), 2413
–2423
(2010). http://dx.doi.org/10.3390/rs2102413 RSEND3 Google Scholar
M. MirikK. SteddomG. J. Michels Jr.,
“Estimating biophysical characteristics of musk thistle (Carduus nutans) with three remote sensing instruments,”
Rangeland Ecol. Manage., 59
(1), 44
–54
(2006). http://dx.doi.org/10.2111/05-106R2.1 1550-7424 Google Scholar
P. H. Greenfield,
“Remote sensing for invasive species and plant health monitoring,”
in Detecting and Monitoring of Invasive Species: USDA Plant Health Conf.,
37
–43
(2000). Google Scholar
A. E. FrazierL. Wang,
“Characterizing spatial patterns of invasive species using sub-pixel classifications,”
Remote Sens. Environ., 115
(8), 1997
–2007
(2011). http://dx.doi.org/10.1016/j.rse.2011.04.002 RSEEA7 0034-4257 Google Scholar
K. S. Heet al.,
“Benefits of hyperspectral remote sensing for tracking plant invasions,”
Divers. Distrib., 17
(3), 381
–392
(2011). http://dx.doi.org/10.1111/ddi.2011.17.issue-3 1366-9516 Google Scholar
X. Miaoet al.,
“Detection and classification of invasive saltcedar through high spatial resolution airborne hyperspectral imagery,”
Int. J. Remote Sens., 32
(8), 2131
–2150
(2011). http://dx.doi.org/10.1080/01431161003674618 IJSEDK 0143-1161 Google Scholar
J. Oldelandet al.,
“Mapping bush encroaching species by seasonal differences in hyperspectral imagery,”
Remote Sens., 2
(6), 1416
–1438
(2010). http://dx.doi.org/10.3390/rs2061416 RSEND3 Google Scholar
M. MirikR. J. Ansley,
“Comparison of ground-measured and image-classified honey mesquite (Prosopis glandulosa) canopy cover in Texas,”
Rangeland Ecol. Manage., 65
(1), 85
–95
(2012). http://dx.doi.org/10.2111/REM-D-11-00073.1 1550-7424 Google Scholar
M. MirikR. J. Ansley,
“Utility of satellite and aerial images for quantification of canopy cover and infilling rates of an invasive woody species on rangeland,”
Remote Sens., 4
(7), 1947
–1962
(2012). http://dx.doi.org/10.3390/rs4071947 RSEND3 Google Scholar
H. A. MooneyR. J. Hobbs, Invasive Species in a Changing World, Island Press, Washington, DC
(2000). Google Scholar
G. A. Carteret al.,
“Remote sensing and mapping of tamarisk along the Colorado river, USA: a comparative use of summer-acquired hyperion, thematic mapper and quickbird data,”
Remote Sens., 1
(3), 318
–329
(2009). http://dx.doi.org/10.3390/rs1030318 RSEND3 Google Scholar
B. CzechP. R. Krausman,
“Distribution and causation of species endangerment in the United States,”
Science, 277
(5329), 1116
–1117
(1997). http://dx.doi.org/10.1126/science.277.5329.1116 SCIEAS 0036-8075 Google Scholar
D. S. WilcoveL. Y. Chen,
“Management costs for endangered species,”
Conserv. Biol., 12
(6), 1405
–1407
(1998). http://dx.doi.org/10.1046/j.1523-1739.1998.97451.x CBIOEF 0888-8892 Google Scholar
J. A. Drakeet al., Biological Invasions: A Global Perspective, John Wiley & Sons, Chichester, United Kingdom
(1989). Google Scholar
A. RangoK. HavstadR. Estell,
“The utilization of historical data and geospatial technology advances at the Jornada Experimental Range to support western America ranching culture,”
Remote Sens., 3
(9), 2089
–2109
(2011). http://dx.doi.org/10.3390/rs3092089 RSEND3 Google Scholar
R. J. Ansleyet al.,
“Canopy area and aboveground mass of individual redberry juniper (Juniperus pinchotii Sudw.) trees,”
Rangeland Ecol. Manage., 65
(2), 189
–195
(2012). http://dx.doi.org/10.2111/REM-D-11-00112.1 1550-7424 Google Scholar
E. K. Strandet al.,
“Net changes in aboveground woody carbon stock in western juniper woodlands, 1946–1998,”
J. Geophys. Res. Atmos., 113
(G0103), 1
–13
(2008). http://dx.doi.org/10.1029/2007JG000544 JGRDE3 0148-0227 Google Scholar
R. J. AnsleyM. MirikM. J. Castellano,
“Structural biomass partitioning in regrowth and undisturbed mesquite (Prosopis glandulosa): implications for bioenergy uses,”
GCB Bioenerg., 2
(1), 26
–36
(2010). http://dx.doi.org/10.1111/gcbb.2010.2.issue-1 GBCIA7 1757-1693 Google Scholar
R. J. AnsleyW. E. PinchakD. N. Ueckert,
“Changes in redberry juniper distribution in northern Texas (1948 to 1982),”
Rangelands, 17
(2), 49
–53
(1995). RNGLE7 Google Scholar
R. J. Ansleyet al.,
“Herbaceous restoration of juniper-dominated grasslands with chaining and fire,”
Rangeland Ecol. Manage., 59
(2), 171
–178
(2006). http://dx.doi.org/10.2111/05-095R1.1 1550-7424 Google Scholar
K. D. EggemeyerS. Schwinning,
“Biogeography of woody encroachment: why is mesquite excluded from shallow soils?,”
Ecohydrol., 2
(1), 81
–87
(2009). http://dx.doi.org/10.1002/eco.v2:1 ECOHAF 1936-0584 Google Scholar
E. L. Fredricksonet al.,
“Mesquite recruitment in the Chihuahuan Desert: Historic and prehistoric patterns with long-term impacts,”
J. Arid Environ., 65
(2), 285
–295
(2006). http://dx.doi.org/10.1016/j.jaridenv.2005.10.019 JAENDR Google Scholar
R. J. AnsleyD. Rollins,
“Brush Sculpting—A Decade Later,”
51 Texas AgriLife Extention Misc. Pub., San Angelo, Texas
(2008). Google Scholar
J. H. Everittet al.,
“Remote sensing of redberry juniper in the Texas Rolling Plains,”
J. Range Manage., 54
(3), 254
–259
(2001). http://dx.doi.org/10.2307/4003243 JRMGAQ 0022-409X Google Scholar
J. J. San JoseR. A. MontesM. R. Farinas,
“Carbon stocks and fluxes in a temporal scaling from a savanna to a semi-deciduous forest,”
Forest Ecol. Manag., 105
(1–3), 251
–262
(1998). http://dx.doi.org/10.1016/S0378-1127(97)00288-0 FECMDW 0378-1127 Google Scholar
L. A. BiedermanT. W. Boutton,
“Biodiversity and trophic structure of soil nematode communities are altered following woody plant invasion of grassland,”
Soil Biol. Biochem., 41
(9), 1943
–1950
(2009). http://dx.doi.org/10.1016/j.soilbio.2009.06.019 SBIOAH 0038-0717 Google Scholar
T. W. Bouttonet al.,
“Belowground carbon storage and dynamics accompanying woody plant encroachment in a subtropical savanna,”
Soil Carbon Sequestration and the Greenhouse Effect, 181
–205 Soil Science Society of America, Madison, Wisconsin
(2009). Google Scholar
J. D. LiaoT. W. Boutton,
“Soil microbial biomass response to woody plant invasion of grassland,”
Soil Biol. Biochem., 40
(5), 1207
–1216
(2008). http://dx.doi.org/10.1016/j.soilbio.2007.12.018 SBIOAH 0038-0717 Google Scholar
A. S. Laliberteet al.,
“Multispectral remote sensing from unmanned aircraft: image processing workflows and applications for rangeland environments,”
Remote Sens., 3
(11), 2529
–2551
(2011). http://dx.doi.org/10.3390/rs3112529 RSEND3 Google Scholar
A. D. OlssonW. J. D. van LeeuwenS. E. Marsh,
“Feasibility of invasive grass detection in a desertscrub community using hyperspectral field measurements and Landsat TM imagery,”
Remote Sens., 3
(10), 2283
–2304
(2011). http://dx.doi.org/10.3390/rs3102283 RSEND3 Google Scholar
J. H. EverittC. YangH. B. Johnson,
“Canopy spectra and remote sensing of Ashe juniper and associated vegetation,”
Environ. Monit. Assess., 130
(1–3), 403
–413
(2007). http://dx.doi.org/10.1007/s10661-006-9407-2 EMASDH 0167-6369 Google Scholar
A. H. Mohamedet al.,
“Mesquite encroachment impact on southern New Mexico rangelands: remote sensing and geographic information systems approach,”
J. Appl. Remote Sens., 5
(1), 053514
(2011). http://dx.doi.org/10.1117/1.3571040 1931-3195 Google Scholar
P. J. Starkset al.,
“Measuring eastern redcedar (Juniperus virginiana L.) mass with the use of satellite imagery,”
Rangeland Ecol. Manage., 64
(2), 178
–186
(2011). http://dx.doi.org/10.2111/REM-D-10-00057.1 1550-7424 Google Scholar
C. Gibbeset al.,
“Application of object based classification and high resolution satellite imagery for savanna ecosystem analysis,”
Remote Sens., 2
(12), 2748
–2772
(2010). http://dx.doi.org/10.3390/rs2122748 RSEND3 Google Scholar
I. Melendez-Pastoret al.,
“Land-cover phenologies and their relation to climatic variables in an anthropogenically impacted Mediterranean coastal area,”
Remote Sens., 2
(3), 697
–716
(2010). http://dx.doi.org/10.3390/rs2030697 RSEND3 Google Scholar
D. Joneset al.,
“Object-based image analysis for detection of Japanese knotweed s.l. taxa (Polygonaceae) in Wales (UK),”
Remote Sens., 3
(2), 319
–342
(2011). http://dx.doi.org/10.3390/rs3020319 RSEND3 Google Scholar
D. M. Browninget al.,
“Woody plants in grasslands: post-encroachment stand dynamics,”
Ecol. Appl., 18
(4), 928
–944
(2008). http://dx.doi.org/10.1890/07-1559.1 ECAPE7 1051-0761 Google Scholar
A. C. Cabralet al.,
“Shrub encroachment in Argentinean savannas,”
J. Veg. Sci., 14
(2), 145
–152
(2003). http://dx.doi.org/10.1111/j.1654-1103.2003.tb02139.x JVESEK 1100-9233 Google Scholar
R. SharmaK. M. M. Dakshini,
“A comparative assessment of the ecological effects of Prosopis cineraria and P. juliflora on the soil of revegetated spaces,”
Vegetatio, 96
(1), 87
–96
(1991). http://dx.doi.org/10.1007/BF00031654 VGTOA4 0042-3106 Google Scholar
R. D. Van KlinkenJ. GrahamL. K. Flack,
“Population ecology of hybrid mesquite (Prosopis species) in Western Australia: how does it differ from native range invasions and what are the implications for impacts and management?,”
Biol. Invasions, 8
(4), 727
–741
(2006). http://dx.doi.org/10.1007/s10530-005-3427-7 PPQUE8 Google Scholar
K. L. DyeD. N. UeckertS. G. Whisenant,
“Redberry juniper-herbaceous understory interactions,”
J. Range Manage., 48
(2), 100
–107
(1995). http://dx.doi.org/10.2307/4002794 JRMGAQ 0022-409X Google Scholar
P. Johnsonet al.,
“Economics of redberry juniper control in the Texas Rolling Plains,”
J. Range Manage., 52
(6), 569
–574
(1999). http://dx.doi.org/10.2307/4003625 JRMGAQ 0022-409X Google Scholar
D. N. Ueckertet al.,
“Redberry juniper canopy cover dynamics on western Texas rangelands,”
J. Range Manage., 54
(5), 603
–610
(2001). http://dx.doi.org/10.2307/4003591 JRMGAQ 0022-409X Google Scholar
C. YangJ. H. Everitt,
“Mapping three invasive weeds using airborne hyperspectral imagery,”
Ecol. Inform., 5
(5), 429
–439
(2010). http://dx.doi.org/10.1016/j.ecoinf.2010.03.002 1574-9541 Google Scholar
C. YangJ. H. EverittH. B. Johnson,
“Applying image transformation and classification techniques to airborne hyperspectral imagery for mapping Ashe juniper infestations,”
Int. J. Remote Sens., 30
(11), 2741
–2758
(2009). http://dx.doi.org/10.1080/01431160802555812 IJSEDK 0143-1161 Google Scholar
Y. KeL. J. Quackenbush,
“A review of methods for automatic individual tree-crown detection and delineation from passive remote sensing,”
Int. J. Remote Sens., 32
(17), 4725
–4747
(2011). http://dx.doi.org/10.1080/01431161.2010.494184 IJSEDK 0143-1161 Google Scholar
B. Somerset al.,
“Endmember variability in spectral mixture analysis: a review,”
Remote Sens. Environ., 115
(7), 1603
–1616
(2011). http://dx.doi.org/10.1016/j.rse.2011.03.003 RSEEA7 0034-4257 Google Scholar
R. G. CongaltonK. Green, Assessing the Accuracy of Remotely Sensed Data: Principles and Practices, Lewis Publishers, Boca Raton, Florida
(2009). Google Scholar
A. E. Parker WilliamsE. R. J. Hunt,
“Accuracy assessment for detection of leafy spurge with hyperspectral imagery,”
J. Range Manage., 57
(1), 106
–112
(2004). http://dx.doi.org/10.2307/4003961 JRMGAQ 0022-409X Google Scholar
S. V. StehmanR. L. Czaplewski,
“Design and analysis for thematic map accuracy assessment: fundamental principles,”
Remote Sens. Environ., 64
(3), 331
–344
(1998). http://dx.doi.org/10.1016/S0034-4257(98)00010-8 RSEEA7 0034-4257 Google Scholar
L. L. F. JanssenF. J. M. van der Wel,
“Accuracy assessment of satellite derived land-cover data: a review,”
Photogramm. Eng. Remote Sens., 60
(4), 419
–426
(1994). http://dx.doi.org/WebQuery/wurpubs/26471 PGMEA9 0099-1112 Google Scholar
J. R. Jensen, Introductory Digital Image Processing: A Remote Sensing Perspective, Prentice-Hall, Upper Saddle River, New Jersey
(1996). Google Scholar
D. L. VerbylaT. O. Hammond,
“Conservative bias in classification accuracy assessment due to pixel- by-pixel comparison of classified images with reference grids,”
Int. J. Remote Sens., 16
(3), 581
–587
(1995). http://dx.doi.org/10.1080/01431169508954424 IJSEDK 0143-1161 Google Scholar
R. G. CongaltonR. A. Mead,
“A quantitative method to test for consistency and correctness in photointerpretation,”
Photogramm. Eng. Remote Sens., 49
(1), 69
–74
(1983). PGMEA9 0099-1112 Google Scholar
N. D. Riggan Jr.R. C. Weih Jr.,
“A comparison of pixel-based versus object-based land use/land cover classification methodologies,”
J. Arkansas Acad. Sci., 63 145
–152
(2009). JAASFO Google Scholar
G. H. RosenfieldK. Fitzpatrick-Lins,
“A coefficient of agreement as a measure of thematic classification accuracy,”
Photogramm. Eng. Remote Sens., 52
(2), 223
–227
(1986). PGMEA9 0099-1112 Google Scholar
S. Narumalaniet al.,
“Detecting and mapping four invasive species along the floodplain of North Platte River, Nebraska,”
Weed Technol., 23
(1), 99
–107
(2009). http://dx.doi.org/10.1614/WT-08-007.1 WETEE9 Google Scholar
K. Hufkenset al.,
“Impacts and uncertainties of upscaling of remote-sensing data validation for a semi-arid woodland,”
J. Arid Environ., 72
(8), 1490
–1505
(2008). http://dx.doi.org/10.1016/j.jaridenv.2008.02.012 JAENDR Google Scholar
D. M. BrowningS. R. ArcherA. T. Byrne,
“Field validation of 1930s aerial photography: what are we missing?,”
J. Arid Environ., 73
(9), 844
–853
(2009). http://dx.doi.org/10.1016/j.jaridenv.2009.04.003 JAENDR Google Scholar
T. D. FrankS. A. Tweddale,
“The effect of spatial resolution on measurement of vegetation cover in three Mojave Desert shrub communities,”
J. Arid Environ., 67
(Suppl. 1), 88
–99
(2006). http://dx.doi.org/10.1016/j.jaridenv.2006.09.020 JAENDR Google Scholar
A. S. Laliberteet al.,
“Object-oriented image analysis for mapping shrub encroachment from 1937 to 2003 in southern New Mexico,”
Remote Sens. Environ., 93
(1–2), 198
–210
(2004). http://dx.doi.org/10.1016/j.rse.2004.07.011 RSEEA7 0034-4257 Google Scholar
A. F. Rahmanet al.,
“Optimum pixel size for hyperspectral studies of ecosystem function in southern California chaparral and grassland,”
Remote Sens. Environ., 84
(2), 192
–207
(2003). http://dx.doi.org/10.1016/S0034-4257(02)00107-4 RSEEA7 0034-4257 Google Scholar
D. J. Selkowitz,
“A comparison of multi-spectral, multi-angular, and multi-temporal remote sensing datasets for fractional shrub canopy mapping in Arctic Alaska,”
Remote Sens. Environ., 114
(7), 1338
–1352
(2010). http://dx.doi.org/10.1016/j.rse.2010.01.012 RSEEA7 0034-4257 Google Scholar
R. J. FenshamR. J. Fairfax,
“Aerial photography for assessing vegetation change: a review of applications and the relevance of findings for Australian vegetation history,”
Aust. J. Bot., 50
(4), 415
–429
(2002). http://dx.doi.org/10.1071/BT01032 AJBTAP 0067-1924 Google Scholar
R. J. Fenshamet al.,
“Quantitative assessment of vegetation structural attributes from aerial photography,”
Int. J. Remote Sens., 23
(11), 2293
–2317
(2002). http://dx.doi.org/10.1080/01431160110106050 IJSEDK 0143-1161 Google Scholar
Biography Mustafa Mirik is an associate research scientist with Texas A&M AgriLife Research at Vernon, Texas. His research involves in the use of geospatial sciences and technologies for natural recourse assessment and management. He received the BS degree in forest engineering from the Istanbul University, Turkey, in 1992, the MS degree in natural resource ecology and Management from Oklahoma State University in 1997, and the PhD in natural resource sciences from North Dakota State University in 2001.  Sriroop Chaudhuri is a postdoctoral research associate at the Texas A&M AgriLife Research at Vernon. He received his BS and MS from the University of Calcutta, India, and West Virginia University, West Virginia, respectively, in environmental geology, in 1997 and 2003. He received his PhD in 2011 from West Virginia University on soil carbon sequestration and his second MS in hydrogeology from the same institution on acid mine drainage chemistry. His research interests include aqueous geochemistry, the effect of land use change on water quality, groundwater contamination, soil chemistry, GIS, and remote sensing.  Brady Surber is a research technician at Texas A&M AgriLife Research in Vernon, Texas, where he participates in ongoing rangeland and brush ecology research projects. He received his BS in wildlife biology and natural resource management at Sul Ross State University in Alpine, Texas. Prior to his current research, he participated in biological and ecological studies on ground nesting grassland birds as well as greater roadrunners (Geococcyx californianus) also at Texas A&M AgriLife Research Station in Vernon, Texas.  Srinivasulu Ale is an assistant professor and geospatial hydrologist at the Texas AgriLife Research in Vernon, Texas. He received his PhD in agricultural and biological engineering from Purdue University, West Lafayette, in 2009 and MS in agricultural engineering from G.B. Pant University of Agriculture & Technology, India, in 1992. His research interests include water resources management on croplands, rangelands and pasture production systems, water quality assessment and management, land use (focus on bioenergy-induced) and climate change impacts on hydrology and environment, and irrigation and drainage.  R. James Ansley is a professor of rangeland ecology at the Texas A&M AgriLife Research Center in Vernon, Texas. His areas of interest are rangeland shrub ecology, bioenergy, fire ecology, and range plant ecophysiology. His current research focus is to quantify the ecological impact of woody plant encroachment in semi-arid grasslands and rangelands, develop sustainable technologies to reduce woody plant effects, and determine the potential of rangeland woody plants for bioenergy uses. He also teaches introduction to biology as an adjunct instructor at Vernon College. |
||||||||||||||||||||||||||||||||||||||||||||||||||||||||||||||||||||||||||||||||||||||||||||||||||||||||||||||||||||||||||||||||||||||||||||||||||||||||||||||||||||||||||||||||||||||||||||||||||||||