
|
|
1.IntroductionDust storms are hazardous weather events that frequently occur in Asia and North Africa, particularly during boreal spring and summer. The dust storms lead to the long-range transport of a substantial amount of dust from the desert and semiarid dust sources to the downwind regions.1–6 The long-range dust transport can influence the regional and global aerosol loading, radiative energy budget, rainfall pattern, air quality, public health and global climate systems.7–9 Thus, monitoring dust and understanding its effect on atmospheric properties have received a great deal of attention. Due to long-range dust transport, satellite observations are deemed the best approach to delineate the spatial and temporal distributions of airborne dust. Various up-to-date, satellite-based dust storm monitoring techniques have been developed and employed.10,11 Asia and Africa are two major source regions of black carbon, the main component of soot aggregates. These carbon emissions are generally associated with open combustion, such as forest fires, land-clearing by fire, agricultural waste-burning events, and from traditional stoves and kilns. Automobile and industrial emissions also contribute to the emission of black carbon. Airborne dust particles may be coated or attached with carbon from natural and anthropogenic combustion over farmland, forests, and industrial regions. Previous surveys indicate that most Asian dust particles are mixed with soot aggregates,12–16 which dramatically alter the physiochemical characteristics of the particles. Thus, there is a pressing need to develop a method to quantitatively assess the black carbon effect on dust optical properties and analyze the radiative properties of polluted dust particles from satellite observations of dust storms. Numerous studies have been conducted to understand the optical properties of dust particles and soot aggregates,17–28 finding that particle shape is an important physical parameter. As the mineral dust particles are almost exclusively nonspherical,29–31 the nonsphericity effect has to be taken into account when calculating dust optical properties.32–35 Although dust particle morphologies are complicated, approximating the particles as an ensemble of randomly oriented spheroids is valid for computing the bulk optical properties for many applications.36 A triaxial ellipsoidal model with one more degree of morphological freedom than the axially rotational spheroid model has also been suggested.37 The results based on an ellipsoidal model with a set of optimal shapes and weights closely agree with laboratory measurements in terms of both the intensity and polarization state of scattered radiation.37 Using the ellipsoidal model and a combination of the Lorenz-Mie theory, T-matrix method, discrete dipole approximation (DDA) and an improved geometric optics method (IGOM), Meng et al.38 developed a database of the single-scattering properties of tri-axial ellipsoidal mineral dust particles for atmospheric radiative transfer simulations and remote-sensing applications. Yi et al.39 utilized the database and showed the importance of the nonsphericity effect of dust-like aerosol on the radiance and flux simulation. In the study of the optical properties of soot aggregates, Li et al.28 demonstrated that the spherical approximation based on the equivalent volume, equivalent surface area, equivalent ratio of volume to projected area, or radius of gyration, leads to significant errors in the calculation of the optical properties of soot aggregates. To reduce the simulation errors, the fractal aggregates defined by the diffusion-limited cluster-cluster aggregation algorithm (DLCA) are used to derive soot properties. Moreover, the scattering properties of fractal aggregates can be obtained with the Rayleigh-Debye-Gans (RDG) method,40 the T-matrix and superposition T-matrix methods,41,42 or the generalized multiple Mie (GMM) method.43,44 Dust and soot particles attenuate the incident solar energy through absorption and scattering effects. The key parameters for modeling the extinction efficiency of either mineral dust or airborne soot particles are the complex refractive indices. Although the refractive index values cannot be easily specified after dust and soot mixing, the scattering and absorption properties of aerosols in external or semi-external mixtures have been simulated.41,45 The optical properties of a large particle attached with soot clusters can be strongly influenced by the mixing effects. In satellite remote-sensing applications, the single-scattering albedo (SSA) of atmospheric aerosols is important in the forward radiative transfer simulations. This is especially true in retrieving the properties of dust mixed with soot aggregates, because dust aerosols are coarse particles with a strong scattering effect, whereas soot aerosols are fine particles with a strong absorption effect. This study is intended to understand the effect of soot on the retrieval of the optical properties of polluted dust from moderate resolution imaging spectroradiometer (MODIS) observations based on the principle of the Deep Blue algorithm. The remainder of this paper is organized as follows: Sec. 2 describes the methodology to derive the bulk scattering properties of dust-soot mixture with an external mixture scheme and the radiative transfer model used for the present simulations. The effect of black carbon on the dust properties is discussed in Sec. 3. In Sec. 4 the sensitivity of reflectance at the top of the atmosphere (TOA) to the optical properties of dust-soot mixture is illustrated. The retrievals of the pure and polluted dust AOD and SSA from the MODIS observations are presented and discussed in Sec. 5 and conclusions summarized in Sec. 6. 2.Methodology2.1.Models for Soot Aggregation and Mineral DustThe DLCA approximation is employed to define a soot aggregate morphology and to specify the soot particle geometries for the calculation of the single-scattering properties based on the GMM method.28,43,44,46 The bulk (ensemble-averaged) optical properties of the particles can be obtained by weighting the probability distribution function (PDF) of the number of monomers per aggregate. The empirical values of 1.19 and 1.82 for the fractal prefactor and dimension are assumed in the simulation of the soot aggregate geometries.24,40 The PDF for the monomers, , can be expressed as where is the geometric mean of , and is the geometric standard deviation.23,47 The values of 200.0 and 2.3 are used for and 28,48 The ensemble-averaged optical properties, for example the phase function and extinction coefficient, can be obtained in the form43,44 where and indicate the averaged phase function and the extinction coefficient of an ensemble of aggregates. For an aggregate of monomers, and are the phase function and the scattering cross-section, is the scattering angle, and is the extinction coefficient in the present study.The refractive indices of soot aggregates at wavelengths 0.412, 0.470 and 0.650 μm are assumed to be , and ,28,41,42,49,50 respectively. The phase functions for individual aggregates, with a set of the monomer numbers (averaged over 100 to 1500 monomers with a 50-monomer increment) at a selected visible wavelength can be computed with the GMM method. The database software package developed by Meng et al.38 is used for calculating the single-scattering properties of dust-like aerosol particles. Figure 1 shows the variations of mineral dust optical properties with different imaginary parts of the refractive index at 0.470 μm when their real part of the refractive index is 1.55. When the imaginary part of the refractive index increases, the scattering efficiency and SSA decrease, while the asymmetry factor increases. 2.2.Mixing ProcessesDue to the difficulty in determining the optical properties of internal mixtures, the optical properties of polluted dust particles are derived by an external mixing procedure with each aerosol species represented by its own size distribution and complex refractive index. In this study, the dust refractive indices based on aerosol robotic network (AERONET) retrieval51–53 are used. For external mixing, the extinction coefficient of a combination () as a weighted mean of the optical properties of individual components, can be given by Ref. 50, where and is the number-density mixing ratio of dust particles and soot aggregates, and ; and are the corresponding extinction coefficients of dust and soot. The asymmetry factor and the phase function of the dust-soot mixture can be expressed as where and are the scattering cross sections of dust particles and soot aggregates.To understand the aerosol mixing effect on the single-scattering properties, Liu and Mishchenko41 simulated the ensemble-averaged photometric characteristics of mixtures formed by soot aggregates and mineral dust. The simulation was conducted at 0.628 μm by using the superposition T-matrix method with radii inputs of 0.02 and 1.0 μm and refractive indices of and for soot monomers and dust particles, respectively. Their simulated ensemble-averaged SSA (0.797 at 0.628 μm) is close to the present result (0.767 at 0.650 μm) based on Eqs. (4) to (6), suggesting that the external mixture mechanism used in this study can provide reasonable results. As the irradiance observed at TOA may be varied due to both atmospheric aerosol loading and SSA characteristics, uncertainties in AOD retrievals may be induced if the SSA variation by dust-soot mixing is neglected. 2.3.Simulations of TOA ReflectanceTo eliminate the potential errors due to neglecting the radiation polarization state in the simulated spectral radiance/reflectance at the TOA,54,55 we employ a polarized radiative transfer code developed by de Haan et al.46 employing the adding-doubling principle. In the simulation, the vertical distribution of aerosol loading is divided into seven layers from the surface to the TOA following a Gaussian function with a peak at the height of 3 km above the surface.6 Using visible wavelength bands allows the clear-sky atmospheric optical depth () to be calculated as a function of wavelength for the spectral region:56 where is the spectral wavelength in micrometers.The simulation results of the TOA reflectance (470 μm) as a function of the surface reflectance for selected aerosol loadings ( and 1.0) and of different SSA values are depicted in Fig. 2(a). Figure 2(b) demonstrates the simulations of the dust-soot mixture with soot aggregates. The mineral dust SSA values are reduced by about 1.6% after mixing, and the critical reflectance (vertical dashed lines) changes from 0.155 to 0.135 when the SSA is 0.946. Here, the critical reflectance is defined as the surface reflectance in the presence of aerosol, but with the TOA reflectance unchanged. It is difficult to infer aerosol property information as the TOA reflectance approaches the critical reflectance, as seen in Fig. 2(c) and 2(d) with surface reflectances of 0.408 and 0.310, respectively. Both the surface reflectance and the apparent reflectance have the same value as the aerosol loading (AOD) varies between 0.0 and 2.0. Large errors thus can be incurred in the aerosol property retrievals based on the TOA apparent reflectance at values near the critical reflectance. For instance, the error in the AOD retrieval may be as large as 2.0 under the scenario of Fig. 2(c). Fig. 2(a) Simulated TOA reflectance (atmosphere and surface) at 0.470 μm and surface reflectance for AOD and SSA () based on the triaxial ellipsoidal dust database. The solid line represents the TOA reflectance without aerosol, and the dotted, dashed and long dashed lines are the TOA reflectance under the aerosol loading of with different SSA (). (b) Same as (a), but mixed with soot aggregates. (c) Same as (a), but under the aerosol loading, , 0.5, 1.0, 1.5, and 2.0, respectively. (d) Same as (c), but mixed with 5% soot aggregates. (e) The relative difference of TOA reflectance, [], from nonaerosol atmosphere in panel (c) when surface reflectance is 0.08 (solid line), 0.16 (long dashed line) and 0.40 (dashed line). (f) Same as (e), but for panel (d).  In the satellite observations of the apparent reflectance at the TOA, the atmospheric aerosols generally provide positive radiance contributions over dark surface areas and negative contributions over bright surface areas. The critical reflectance can be used to distinguish dark and bright surfaces. The aerosol contribution is positive when the surface reflectance is less than the critical reflectance (0.408). The relative differences can be noticed in Fig. 2(e). On the contrary, the contributions are negative if the surface reflectance is larger than the critical reflectance value (0.310). When the surface reflectance is larger than the critical reflectance (e.g., 0.4), the differences in the nonaerosol case are negative [Fig. 2(f)]. Therefore, the estimation of the critical reflectance value is crucial for both aerosol retrievals and radiative forcing computations. The simulation results indicate the critical reflectance may vary with the atmospheric aerosol SSA, thereby implying the critical reflectance is altered by mixed soot aggregates. 3.Effect of Black Carbon on AOD and SSA RetrievalsThe Deep Blue algorithm, originally developed by Hsu et al.6,57 for the retrieval of mineral dust optical properties over bright surface areas, is also suitable for analyzing the optical properties of dust-soot mixture. Specifically, a set of look-up tables based on the best match between simulated and observed TOA reflectances at MODIS 0.412-, 0.470-, and 0.650-μm channels are used for retrieving AOD and SSA. Two-channel (0.412 and 0.470 μm) and three-channel (0.412, 0.470, and 0.650 μm) retrieval algorithms are utilized to retrieve dust aerosol properties for low and heavy atmospheric aerosol loading. The TOA reflectance of mineral dust mixing with different weighted soot aggregates can be simulated by combining aerosol profiles with the aforementioned soot aggregate optical properties, database of mineral dust, and polarized radiative transfer code. With the Deep Blue algorithm, a set of look-up tables of the TOA reflectance (as functions of AOD and SSA) is established for retrieving the optical properties of dust-soot mixtures. In the look-up tables, the TOA reflectance is calculated for a combination of 13 solar zenith angles ( to 72 deg in 6 deg increments), 14 viewing zenith angles ( to 78 deg in 6 deg increments) and 16 relative azimuthal angles ( to 180 deg in 12 deg increments). Furthermore, the effective radius and effective variance for mineral dust aerosols are 1.0 μm and 1.0, respectively. For the three-channel retrieval technique applied to the simulation scenario with heavy aerosol loading, the look-up tables for the relationships between the simulated TOA apparent reflectances at 0.412 and 0.470 μm, versus those at 0.650 μm as functions of AOD and SSA for pure and polluted dust (dust-soot mixture) aerosols are depicted in Fig. 3. The values of SSA shown in the figures are for the pure dust and dust-soot mixture aerosols at 0.412 (upper panel) and 0.470 μm (lower panel), and the SSA values of pure dust and dust-soot mixture aerosols at 0.650 μm are 0.995 and 0.990, respectively. The look-up tables are constructed based on the relationships between the wavelengths (0.412, 0.470, and 0.650 μm) for simultaneously retrieving the AOD and SSA of aerosols. AOD and SSA retrievals are obviously different between the look-up tables of pure dust (dashed lines) and dust-soot mixture with (solid lines), mainly due to the variation in the single-scattering properties. The retrievals of the mixture aerosol properties have the same weakness as in the two-channel model (for the condition of light aerosol loading). The results in Fig. 3 demonstrates that the failure in incorporating the dust aerosols mixing with soot aggregates can lead to substantial errors in retrieving the AOD and SSA of dust-soot mixtures along the pathway of a dust storm through an industrial region. For example, the differences of retrievals between pure dust and polluted dust are 20.0% and 1.15% for AOD and SSA, respectively, when the aerosol loading in AOD is 1.0. Fig. 3The simulated TOA reflectance as a function of AOD and SSA for 0.412 versus 0.650 μm (top panel), and 0.470 versus 0.650 μm (lower panel) for mineral dust mixed with (solid line ), and without (dashed line) soot aggregates. The SSA of pure dust and dust-soot mixture aerosols at 0.650 μm are 0.995 and 0.990, respectively.  The simulation results show that the major uncertainties in AOD and SSA retrievals for dust aerosols are induced by the variance in the SSA after mixing with soot aggregates. Figure 4 shows the SSA variation with the imaginary part of the refractive index when mineral dust is mixed with and soot aggregates at 0.412 and 0.470 μm. The simulations indicate the stronger the scattering by the dust particles, the larger the variation in the SSA for the mixture. Specifically, the effect of dust mixing with soot aggregates on SSA values is more significant for large values than for low values. The results (Figs. 3 and 4) show that a 1.5% variation in the SSA value could result in 20% uncertainty in the AOD retrieval by the three-channel retrieval technique. 4.Sensitivity Analysis4.1.SSA Variance on TOA ReflectanceFigure 5 shows the phase function differences between the pure dust and the dust-soot mixtures with , which are less than 0.4%. Thus, the change in the TOA reflectance may be mainly due to variations in the SSA. Fig. 5The phase function differences between dust-soot mixtures (with soot aggregates) and pure dust, [], at 0.412, 0.470, and 0.650 μm. 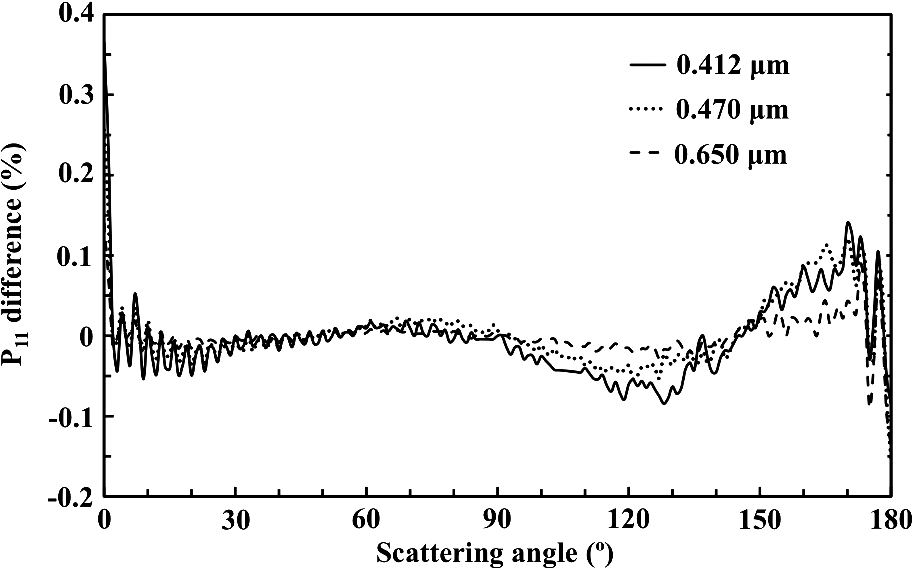 Figure 6 illustrates the results of the influence of the single-scattering properties on the TOA reflectance at 0.470 μm over dark [panels (a), (b), and (c)] and bright surfaces [panels (d), (e), and (f)]. Panels (a) and (d) in Fig. 6 represent the viewing directional TOA reflectance for pure dust, whereas panels (b) and (e) are for the dust-soot mixtures with . Due to the reduction in the SSA values, the TOA reflectance of the dust-soot mixture is less than that of the pure dust over both dark and bright areas, although the TOA reflectance patterns are quite similar to panels (a), (b), (d), and (e), as shown in Fig. 6. Furthermore, Fig. 6(c) and 6(f) shows the geometric distributions of the relative difference in the apparent reflectivity between the pure dust and dust/soot mixture. By comparing the TOA reflectance difference between the pure dust and the dust-soot mixture, as shown in Fig. 6(a) and 6(b), the geometric distribution of the relative difference can be calculated, which is displayed in Fig. 6(c). The relative difference ranges from 7.2% to 10.6%, and the mean and standard deviations are 9.0% and 2.2% respectively over bright surfaces. Similar results are found over the areas of dark surface. Fig. 6The azimuthal variations (radius, view zenith angle; angle, relative azimuthal angle) of the apparent reflectance at TOA simulated from the triaxial ellipsoidal dust and soot aggregation models at 0.470 μm. The solar zenith angle is 24 deg. The AOD and surface reflectance are assumed to be 1.0 and 0.08 [panels (a)–(c)]. Panels (d)–(f) are the results of brighter surface reflectance (0.16). The relative differences in panels (c) and (f) are presented in percentages, [].  For most cases, the TOA reflectance and mean relative difference can be determined by the variance in the SSA between the pure dust and the dust-soot mixture (polluted dust), and the standard deviation is attributed to the phase function’s difference. More cases are investigated to further assess the effect of dust-soot mixtures on the TOA reflectance. SSA and TOA reflectance simulations and the mixing weight of soot aggregates at 0.470 μm show the values over bright surfaces will be approximately reduced by 8% and 18% when mineral dust is mixed with of soot aggregates (Fig. 7). Furthermore, the results suggest that the SSA variance effect on TOA reflectance can be magnified by aerosol loading (i.e., AOD), and the influence contributed by SSA variance is quite similar between the different wavelengths of 0.412, 0.470, and 0.650 μm and over both dark and bright areas. 4.2.Phase Function Variance on TOA ReflectanceTo further assess the phase function influence, a set of the equivalent SSAs (less than 0.5% difference) calculated by the simulations in Sec. 3 is employed, as listed in Table 1. The dust-soot mixture phase function deviates substantially from its dust counterpart in the side-scattering and backscattering directions at 0.470 μm (with the difference ranging from 15% to 30%). A larger difference in the TOA reflectance may occur in the side- and backward-viewing directions between pure dust and polluted dust cases. To evaluate the influence of the phase function differences on the TOA reflectance, the simulations of the reflectance at the TOA at 0.470 μm over dark and bright surfaces are depicted in Fig. 8. Overall, the phase function variation influence on the TOA reflectance ranges from 0.7% to 7.0% when aerosol loading (AOD) is less than 2.0. The influence becomes more significant with increased AOD at shorter wavelengths (0.412 and 0.470 μm) and is noticeable, especially over darker surfaces. For the quantitative analyses, Table 2 summarizes the simulations of SSA and phase function () effects after mixing with soot aggregates on TOA reflectance (Figs. 6 and 8). Table 1Parameters for assessing the phase function effect on TOA reflectance by pure dust and a dust-soot mixture.
Table 2The mean of relative difference in TOA reflectance between pure dust and dust-soot mixture over bright surface.
Note: The mean difference of TOA reflectance is the average of viewing zenith (0 deg to 90 deg) and azimuth (0 deg to 180 deg) angles at 24 deg solar zenith. 5.AOD and SSA Retrievals with MODIS DataObservations from the sun-photometer station (EMA_2 AERONET, 30.08°N, 31.29°E) located in Cairo, Egypt, indicate the aerosol content over the region includes a mixture of three individual components: background pollution by urban activities, biomass burning in the Nile Delta, and mineral dust from the desert regions (e.g., Sahara).58,59 Therefore, the Greater Cairo Region (GCR) is an area where aerosols from different origins are mixed in variable proportions, serving as a proper test site for the validation of the dust-soot mixture look-up tables constructed in this study. During two dust storm events, three MODIS observations around the megacity of Cairo were collected for examination of AOD and SSA retrievals of pure dust and dust-soot mixtures. The events include a pure-dust-like case (May 27, 2010) and two polluted-dust-like cases (May 16, 2010, and February 25, 2011) shown in Fig. 9. During the period from May 15 to 28, 2010, two dust storm events were recorded by the sun-photometer at Cairo_EMA_2 site (Fig. 10). The measurements of the aerosol optical properties indicated the dust plumes began to blow over the greater Cairo region with a slight loading on May 15 (e.g., small AOD value), and the concentration of dust particles was intensified by a storm on May 16 and 17 (see also Fig. 9). After May 18, the mineral dust characteristics could not be tracked (e.g., slight aerosol loading with relative large AE value) until a strong dust plume appeared on May 27. Accordingly, the MODIS/Aqua observations of May 16 and 27 are employed for the case studies; Case 1 for pure dust and Case 2 for polluted dust (dust-soot mixture). Case 3 is the dust storm event on February 25, 2011, similar to the May 16, 2010 polluted dust case, but with heavier dust aerosol loading, and additionally examined for polluted dust (dust-soot mixture). Fig. 9MODIS images acquired on May 16, 2010 (left panel), May 27, 2010, (central panel) and February 25, 2011 (right panel). The red circles mark the target study area—the greater Cairo region.  Fig. 10The variations of AOD (top panel), AE (central panel) and SSA (bottom lower panel) from Cairo_EMA_2 site during May 15 to 28, 2010. Vertical dashed lines indicate the time of MODIS/Aqua observations. 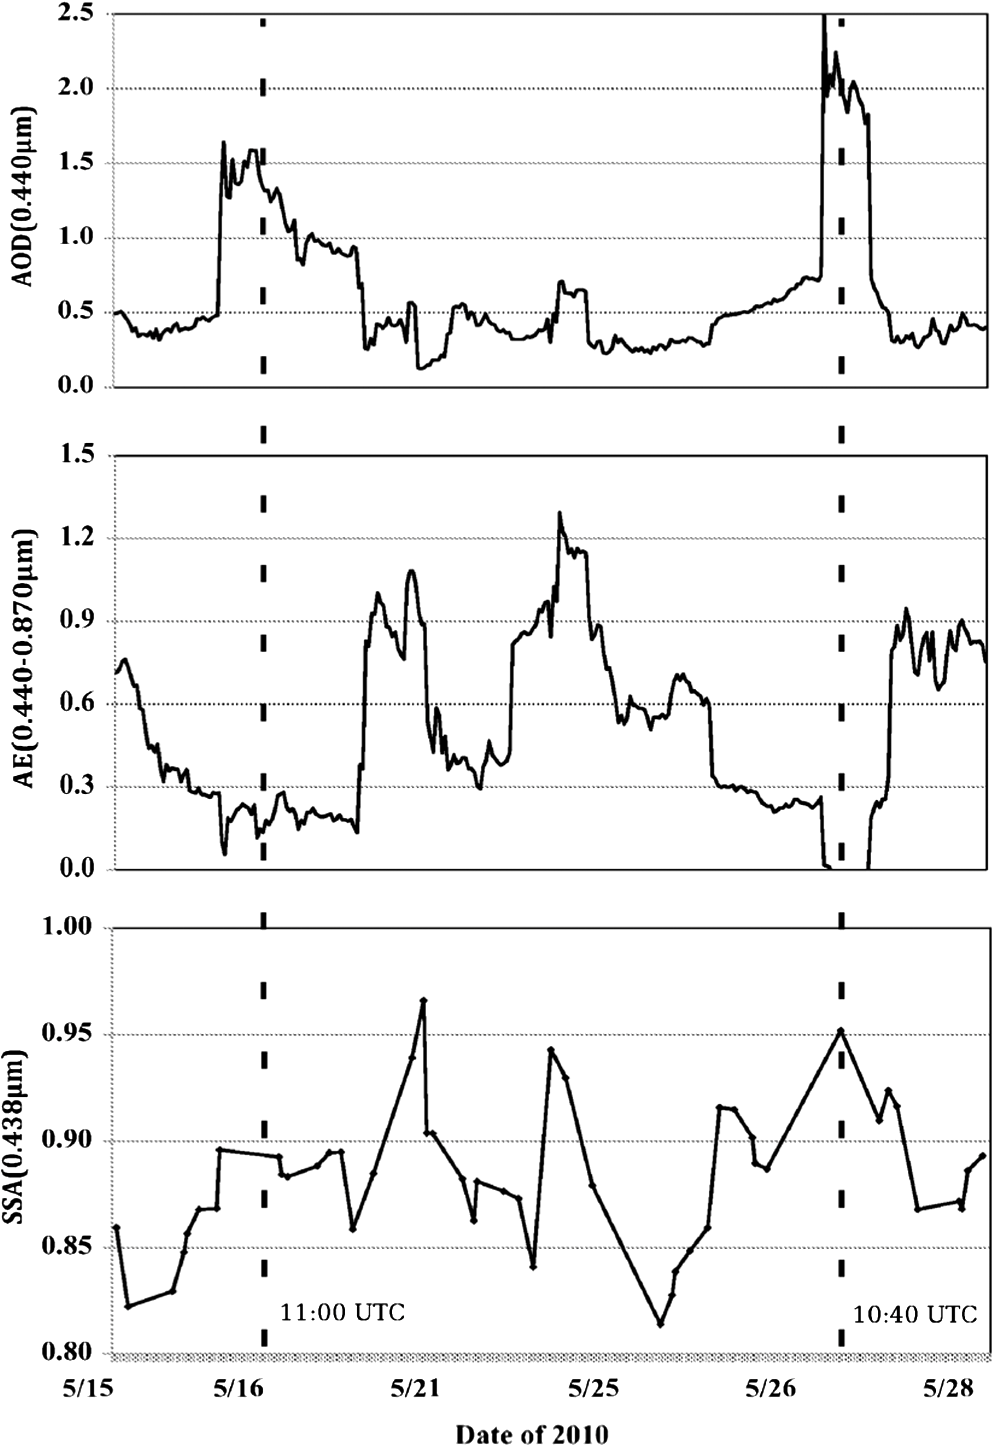 With the MODIS land surface reflectivity products (MOD09, http://lance.nasa.gov/data-products/modis-products/) and the SSA retrieved from the Cairo_EMA_2 site (for the purpose of determining the mixing ratio of soot aggregates), the dust aerosol optical properties, AOD and SSA, can be retrieved from the MODIS apparent reflectance observed at the TOA based on the calculated look-up tables in this study. For Case 1 corresponding to pure dust aerosol, the dust aerosol property retrievals from the look-up tables of the pure dust (dashed line in Fig. 11) are more accurate than those of the dust-soot mixture (solid line) in comparison with the sun-photometer measurements. The mean differences of the retrieved AOD and SSA between the pure dust look-up tables and the ground-based measurements are less than 1% (see also the Case 1 retrievals in Table 3), indicating that the proposed approach for retrieving dust aerosols is both highly reasonable and practical. Meanwhile, according to the spatial distribution of AOD and SSA retrievals over the greater Cairo region in Fig. 12, the AOD and SSA values are larger than 1.5 and 0.94, respectively, and have a homogenous distribution, which suggests a pure-dust-like case. Fig. 11Same as Fig. 3, but for different surface reflectivity and mixed with soot aggregates. The red crosses represent the apparent reflectance from MODIS observations around the greater Cairo region on May 27, 2010 (Case 1). 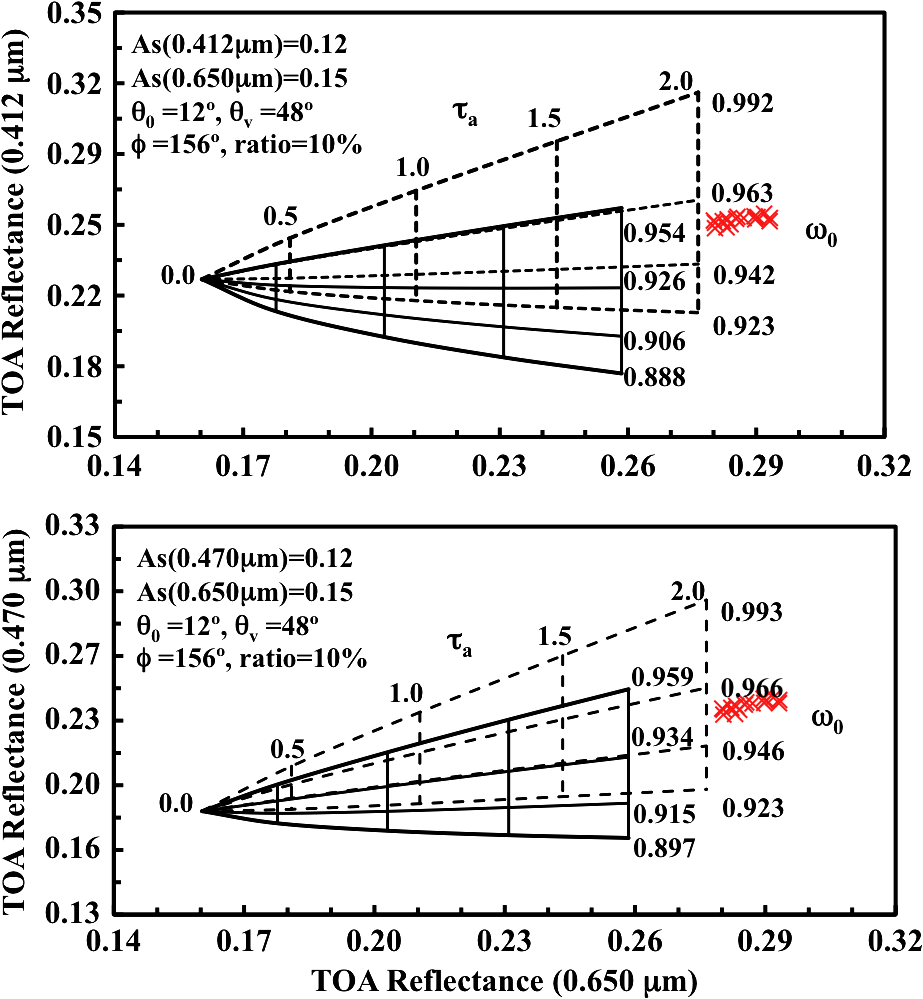 Table 3The comparison of retrieved dust aerosols properties with and without soot aggregates over the greater Cairo region during the dust storm events.
Note: The values of SSA retrieval are the mean of the results at the 0.412 and 0.470 μm bands, and the percentage in the bracket is the difference compared to the retrieval by the sun photometer measurement at Cairo_EMA_2 site. Fig. 12(a) The spatial distributions of AOD and (b) SSA from the look-up tables of dust-soot mixtures over the greater Cairo region, MODIS/Aqua, May 27, 2010 (Case 1). The black cross indicates the location of the Cairo_EMA_2 site.  The Case 2 retrievals of polluted dust aerosol shown in Fig. 13 are more accurate than their pure dust counterparts. The differences between the retrieved AOD and SSA (based on the look-up tables indicated by the solid lines) and the ground-based measurements, are 1.3% and 2.4%, but the differences are as large as 11.9% and 4.1% (based on the look-up tables indicated by the dashed lines) if the effect of dust mixing with soot aggregates is neglected (see the Case 2 retrievals in Table 3). The results indicate that an overestimate of the SSA value will result in an underestimation of the AOD value. In Case 2, spatial distributions of AOD and SSA (Fig. 14) over the greater Cairo region decreases from the east to west side, and may describe the phenomenon of the dust plumes from the southeast gradually mixing with ambient aerosols (e.g., anthropogenic pollutants or smoke from biomass burning). The Case 3 results are similar and listed in Table 3. Fig. 14Same as Fig. 12, but for Case 2 on May 16, 2010, based on the look-up tables of pure dust particles.  6.Summary and DiscussionA simulation technique is applied to dust storm events observed by MODIS, aiming at evaluating the effect of dust mixing with soot aggregates on the dust particle optical properties. The look-up tables for retrieving the AOD and SSA of pure and polluted dust aerosols are constructed with a tri-axial ellipsoidal dust model and the GMM soot aggregation approach associated with the external mixing process. For validation, they are applied to MODIS data from three dust storm cases, one case for pure dust and two cases for the soot-contaminated dust. The results show the phase function of a dust-soot mixture with soot weight to be almost the same as that of pure dust (less than 0.4% difference). The SSA differences are obvious (about 3%) because soot aggregates are strong absorbers of visible light. The apparent reflectance observed at the TOA is thus altered by the variations in the SSA and phase function, roughly 9.0% and 2.3% difference from pure dust at 0.470 μm over bright surfaces when AOD and soot mixing weight are assumed to be 1.0 and . The apparent reflectance variance results in a 20.0% and 1.2% difference for the AOD and SSA retrievals from pure dust. With ancillary information about the surface reflectivity, the optical properties of mineral dust (AOD and SSA) can be retrieved from remotely sensed apparent reflectance. According to the results of the case studies from MODIS observations over the greater Cairo region, more accurate retrievals of pure dust and polluted dust properties are obtained on the basis of proposed look-up tables by means of the Deep Blue algorithm. In case of pure dust, both the AOD and SSA retrieval differences are less than 1% when compared with the ground-based measurements (AERONET). The errors of AOD and SSA retrievals of polluted dust are reduced from 11.9% to 1.3% and from 4.1% to 2.4%, respectively, if the lookup tables for pure dust are replaced by their counterparts for polluted dust with . This indicates that the external mixing process seems reasonable for the optical properties retrieved from satellite observations. Moreover, results from both the simulations and the case studies suggest that by neglecting the mixing of dust aerosols with soot, the Deep Blue approach will underestimate the AOD retrieval and overestimate the SSA, and vice versa. AcknowledgmentsThis study was partially supported by the endowment funds associated with the David Bullock Harris Chair in Geosciences, the College of Geosciences at Texas A&M University and NSF Grant ATM-0803779. ReferencesJ. M. Prospero,
“Long-range transport of mineral dust in the global atmosphere: Impact of African dust on the environment of the southeastern United States,”
Proc. Natl. Acad. Sci. U. S. A., 96
(7), 3396
–3403
(1999). http://dx.doi.org/10.1073/pnas.96.7.3396 Google Scholar
J. QiuL. Yang,
“Variation characteristics of atmospheric aerosol optical depths and visibility in North China during 1980–1994,”
Atmos. Environ., 34
(4), 603
–609
(2000). http://dx.doi.org/10.1016/S1352-2310(99)00173-9 AENVEQ 0004-6981 Google Scholar
Y. IchikawaS. Fujita,
“An analysis of wet deposition of sulfate using a trajectory model for East Asia,”
Water Air Soil Pollut., 85
(4), 1927
–1932
(1995). http://dx.doi.org/10.1007/BF01186116 WAPLAC 0049-6979 Google Scholar
R. L. ArndtG. R. CarmichaelJ. M. Roorda,
“Seasonal source-receptor relationships in Asia,”
Atmos. Environ., 32
(8), 1397
–1406
(1998). http://dx.doi.org/10.1016/S1352-2310(97)00241-0 AENVEQ 0004-6981 Google Scholar
R. B. Husaret al.,
“Asian dust events of April 1998,”
J. Geophys. Res., 106
(D16), 18317
–18330
(2001). http://dx.doi.org/10.1029/2000JD900788 JGREA2 0148-0227 Google Scholar
N. C. Hsuet al.,
“Deep blue retrievals of Asian aerosols properties during ACE-Asia,”
IEEE Trans. Geosci. Remote Sens., 44
(11), 3180
–3195
(2006). http://dx.doi.org/10.1109/TGRS.2006.879540 IGRSD2 0196-2892 Google Scholar
S. K. SatheeshK. K. Moorthy,
“Radiative effects of natural aerosols: a review,”
Atmos. Environ., 39
(11), 2089
–2110,
(2005). http://dx.doi.org/10.1016/j.atmosenv.2004.12.029 AENVEQ 0004-6981 Google Scholar
M. O. AndreaeD. Rosenfeld,
“Aerosol-cloud-precipitation interactions. Part 1. The nature and sources of cloud-active aerosols,”
Earth-Sci. Rev., 89
(1), 13
–41
(2008). http://dx.doi.org/10.1016/j.earscirev.2008.03.001 ESREAV 0012-8252 Google Scholar
I. Unoet al.,
“Asian dust transported one full circuit around the globe,”
Nat. Geosci., 2 557
–560
(2009). http://dx.doi.org/10.1038/ngeo583 1752-0894 Google Scholar
G.-R. LiuT.-H. Lin,
“Application of geostationary satellite observations for monitoring dust storms of Asia,”
Terrest. Atmos. Ocean. Sci., 15
(5), 825
–837
(2004). Google Scholar
T.-H. Linet al.,
“Asian dust weather categorization with satellite and surface observations,”
Int. J. Rem. Sens., 32
(1), 153
–170
(2011). http://dx.doi.org/10.1080/01431160903439932 IJSEDK 0143-1161 Google Scholar
J. LiJ. R. AndersonP. R. Buseck,
“TEM study of aerosol particles from clean and polluted marine boundary layers over the North Atlantic,”
J. Geophys. Res., 108
(D6), 4189
(2003). http://dx.doi.org/10.1029/2002JD002106 JGREA2 0148-0227 Google Scholar
Y. Iwasakaet al.,
“Importance of dust particles in the free troposphere over the Taklamakan Desert: electron microscopic experiments of particles collected with a balloon-borne particle impactor at Dunhuang, China,”
J. Geophys. Res., 108
(D23), 8644
(2003). http://dx.doi.org/10.1029/2002JD003270 JGREA2 0148-0227 Google Scholar
H. J. HwangC.-U. Ro,
“Direct observation of nitrate and sulfate formations from mineral dust and sea-salts using low-Z particle electron probe X-ray microanalysis,”
Atmos. Environ., 40
(2), 3869
–3880
(2006). http://dx.doi.org/10.1016/j.atmosenv.2006.02.022 AENVEQ 0004-6981 Google Scholar
Z. Shiet al.,
“Influences of sulfate and nitrate on the hygroscopic behavior of coarse dust particles,”
Atmos. Environ., 42
(4), 822
–827
(2008). http://dx.doi.org/10.1016/j.atmosenv.2007.10.037 AENVEQ 0004-6981 Google Scholar
Y. Iwasakaet al.,
“Mixture of Kosa (Asian dust) and bioaerosols detected in the atmosphere over the Kosa particles source regions with balloon-borne measurements: possibility of long-range transport,”
Air Qual. Atmos. Health., 2
(1), 29
–38
(2009). http://dx.doi.org/10.1007/s11869-009-0031-5 AQAHAX 1873-9326 Google Scholar
P. Yanget al.,
“Efficient finite-difference time domain scheme for light scattering by dielectric particles: application to aerosols,”
Appl. Opt., 39
(21), 3727
–3737
(2000). http://dx.doi.org/10.1364/AO.39.003727 APOPAI 0003-6935 Google Scholar
O. V. KalashnikovaI. N. Sokolik,
“Modeling the radiative properties of nonspherical soil-derived mineral aerosols,”
J. Quant. Spectrosc. Radiat. Transfer., 87
(2), 137
–166
(2004). http://dx.doi.org/10.1016/j.jqsrt.2003.12.026 JQSRAE 0022-4073 Google Scholar
O. Duboviket al.,
“Application of spheroid models to account for aerosol particle nonsphericity in remote sensing of desert dust,”
J. Geophys. Res., 111
(D11), 1
–34
(2006). http://dx.doi.org/10.1029/2005JD006619 JGREA2 0148-0227 Google Scholar
Q. Fenget al.,
“Effects of particle nonsphericity and radiation polarization on retrieving dust properties from satellite observations,”
J. Aerosol Sci., 40
(9), 776
–789
(2009). http://dx.doi.org/10.1016/j.jaerosci.2009.05.001 JALSB7 0021-8502 Google Scholar
J. M. HaywoodK. P. Shine,
“The effect of anthropogenic sulfate and soot aerosol on the clear sky planetary radiation budget,”
Geophys. Res. Lett., 22
(5), 603
–606
(1995). http://dx.doi.org/10.1029/95GL00075 GPRLAJ 0094-8276 Google Scholar
C. M. SorensenG. C. Roberts,
“The prefactor of fractal aggregates,”
J. Colloid Interface Sci., 186
(2), 447
–452
(1997). http://dx.doi.org/10.1006/jcis.1996.4664 JCISA5 0021-9797 Google Scholar
K. Tianet al.,
“Distribution of the number of primary particles of soot aggregates in a nonpremixed laminar flame,”
Combust Flame., 138 195
–198
(2004). http://dx.doi.org/10.1016/j.combustflame.2004.04.008 CBFMAO 0010-2180 Google Scholar
L. LiuM. I. Mishchenko,
“Effects of aggregation on scattering and radiative properties of soot aerosols,”
J. Geophys. Res., 110
(D11), D11211
(2005). http://dx.doi.org/10.1029/2004JD005649 JGREA2 0148-0227 Google Scholar
P. Gwazeet al.,
“Comparison of three methods of fractal analysis applied to soot aggregates from wood combustion,”
J. Aerosol Sci., 37
(7), 820
–838
(2006). http://dx.doi.org/10.1016/j.jaerosci.2005.06.007 JALSB7 0021-8502 Google Scholar
F. Liuet al.,
“Effects of primary soot particle size distribution on the temperature of soot particles heated by a nanosecond pulsed laser in an atmospheric laminar diffusion flame,”
Int. J. Heat Mass Transfer., 49
(3–4), 777
–788
(2006). http://dx.doi.org/10.1016/j.ijheatmasstransfer.2005.07.041 IJHMAK 0017-9310 Google Scholar
D. W. Mackowski,
“A simplified model to predict the effects of aggregation on the absorption properties of soot particles,”
J. Quant. Spectrosc. Radiat. Transfer., 100
(1–3), 237
–249
(2006). http://dx.doi.org/10.1016/j.jqsrt.2005.11.041 JQSRAE 0022-4073 Google Scholar
H. Liet al.,
“Numerical accuracy of ‘‘equivalent’’ spherical approximations for computing ensemble-averaged scattering properties of fractal soot aggregates,”
J. Quant. Spectrosc. Radiat. Transfer., 111
(14), 2127
–2132
(2010). http://dx.doi.org/10.1016/j.jqsrt.2010.05.009 JQSRAE 0022-4073 Google Scholar
H. Voltenet al.,
“Scattering matrices and reflectance spectra of forsterite particles with different size distributions,”
J. Quant. Spectrosc. Radiat. Transfer., 100
(1–3), 429
–436
(2006). http://dx.doi.org/10.1016/j.jqsrt.2005.11.074 JQSRAE 0022-4073 Google Scholar
O. Muňozet al.,
“Experimental and computational study of light scattering by irregular particles with extreme refractive indices: hematite and rutile,”
Astron. Astrophys., 446
(2), 525
–535
(2006). http://dx.doi.org/10.1051/0004-6361:20053727 AAEJAF 0004-6361 Google Scholar
D. B. Curtiset al.,
“A laboratory investigation of light scattering from representative components of mineral dust aerosol at a wavelength of 550 nm,”
J. Geophys. Res., 113
(D8), 1
–15
(2008). http://dx.doi.org/10.1029/2007JD009387 JGREA2 0148-0227 Google Scholar
M. I. MishchenkoL. TravisA. Lacis,
“Radiative transfer: scattering,”
Encyclopedia of Atmospheric Sciences, Academic Press, San Diego
(2003). Google Scholar
P. Yanget al.,
“Modeling of the scattering and radiative properties of nonspherical dust-like aerosols,”
J. Aerosol Sci., 38
(10), 995
–1014
(2007). http://dx.doi.org/10.1016/j.jaerosci.2007.07.001 JALSB7 0021-8502 Google Scholar
T. X.-P. Zhaoet al.,
“A study of the effect of non-spherical dust particles on the AVHRR aerosol optical thickness retrievals,”
Geophys. Res. Lett., 30
(6), 1317
–1320
(2003). http://dx.doi.org/10.1029/2002GL016379 GPRLAJ 0094-8276 Google Scholar
M. KahnertT. NousiainenP. Raisanen,
“Mie simulations as an error source in mineral aerosol radiative forcing calculations,”
Quarterly J. Royal Meteorol. Soc., 133
(623), 299
–307
(2007). http://dx.doi.org/10.1002/(ISSN)1477-870X QJRMAM 0035-9009 Google Scholar
M. I. Mishchenkoet al.,
“Modeling phase functions for dustlike tropospheric aerosols using a mixture of randomly oriented polydisperse spheroids,”
J. Geophys. Res., 102
(D14), 16831
–16847
(1997). http://dx.doi.org/10.1029/96JD02110 JGREA2 0148-0227 Google Scholar
L. Biet al.,
“ Single-scattering properties of triaxial ellipsoidal particles for a size parameter range from the Rayleigh to geometric-optics regimes,”
Appl. Opt., 48
(1), 114
–126
(2009). http://dx.doi.org/10.1364/AO.48.000114 APOPAI 0003-6935 Google Scholar
Z. Menget al.,
“Single-scattering properties of tri-axial ellipsoidal mineral dust aerosols: a database for application to radiative transfer calculations,”
J. Aerosol Sci., 41
(5), 501
–512
(2010). http://dx.doi.org/10.1016/j.jaerosci.2010.02.008 JALSB7 0021-8502 Google Scholar
B. Yiet al.,
“Radiative transfer simulation of dust-like aerosols: uncertainties from particle shape and refractive index,”
J. Aerosol Sci., 42
(10), 631
–644
(2011). http://dx.doi.org/10.1016/j.jaerosci.2011.06.008 JALSB7 0021-8502 Google Scholar
C. M. Sorensen,
“Light scattering by fractal aggregates: a review,”
Aerosol Sci. Technol., 35
(2), 648
–687
(2001). http://dx.doi.org/10.1080/02786820117868 ASTYDQ 0278-6826 Google Scholar
L. LiuM. I. Mishchenko,
“Scattering and radiative properties of complex soot and soot-containing aggregate particles,”
J. Quant. Spectrosc. Radiat. Transfer., 106
(1–3), 262
–273
(2007). http://dx.doi.org/10.1016/j.jqsrt.2007.01.020 JQSRAE 0022-4073 Google Scholar
L. LiuM. I. MishchenkoW. P. Arnott,
“A study of radiative properties of fractal soot aggregates using the superposition T-matrix method,”
J. Quant. Spectrosc. Radiat. Transfer., 109
(15), 2656
–2663
(2008). http://dx.doi.org/10.1016/j.jqsrt.2008.05.001 JQSRAE 0022-4073 Google Scholar
Y. L. Xu,
“Calculation of the addition coefficients in electromagnetic multisphere-scattering theory,”
J. Comput. Phys., 127
(1), 285
–298
(1996). http://dx.doi.org/10.1006/jcph.1996.0175 JCTPAH 0021-9991 Google Scholar
Y. L. XuB. A. Gustafson,
“A generalized multiparticle Mie-solution: further experimental verification,”
J. Quant. Spectrosc. Radiat. Transfer., 70
(4–6), 395
–419
(2001). http://dx.doi.org/10.1016/S0022-4073(01)00019-X JQSRAE 0022-4073 Google Scholar
M. I. Mishchenkoet al.,
“Scattering and radiative properties of semi-external versus external mixtures of different aerosol types,”
J. Quant. Spectrosc. Radiat. Transfer., 88
(1–3), 139
–147
(2004). http://dx.doi.org/10.1016/j.jqsrt.2003.12.032 JQSRAE 0022-4073 Google Scholar
J. F. De HaanP. B. BosmaJ. W. Hovenier,
“The adding method for multiple scattering calculations of polarized light,”
Astron. Astrophys., 183
(2), 371
–391
(1987). AAEJAF 0004-6361 Google Scholar
A. V. FilippovM. ZuritaD. E. Rosner,
“Fractal-like aggregates: relation between morphology and physical properties,”
J. Colloid Interface Sci., 229
(1), 261
–273
(2000). http://dx.doi.org/10.1006/jcis.2000.7027 JCISA5 0021-9797 Google Scholar
K. W. Lee,
“Change of particle size distribution during Brownian coagulation,”
J. Colloid Interface Sci., 92
(2), 315
–325
(1983). http://dx.doi.org/10.1016/0021-9797(83)90153-4 JCISA5 0021-9797 Google Scholar
G. A. D’AlmeidaP. KeopkeE. P. Shettle, Atmospheric Aerosols: Global Climatology and Radiative Characteristics, A. Deekpak Pub., Hampton
(1991). Google Scholar
C. Levonieet al.,
“Atmospheric aerosol optical properties: a database of radiative characteristics for different components and classes,”
Appl. Opt., 36
(30), 8034
–8041
(1997). http://dx.doi.org/10.1364/AO.36.008031 APOPAI 0003-6935 Google Scholar
M. Chinet al.,
“Aerosol distribution in the Northern Hemisphere during ACE-Asia: results from global model, satellite observations, and Sun photometer measurements,”
J. Geophys. Res., 109
(D23), D23S90
(2004). http://dx.doi.org/10.1029/2004JD004829 JGREA2 0148-0227 Google Scholar
T. F. Ecket al.,
“Columnar aerosol optical properties at AERONET sites in central eastern Asia and aerosol transport to the tropical mid-Pacific,”
J. Geophys. Res., 110
(D6), D06202
(2005). http://dx.doi.org/10.1029/2004JD005274 JGREA2 0148-0227 Google Scholar
D. Mülleret al.,
“Mineral dust observed with AERONET Sun photometer, Raman lidar, and in situ instruments during SAMUM 2006: shape-independent particle properties,”
J. Geophys. Res., 115
(D11), D07202
(2010). http://dx.doi.org/10.1029/2009JD012520 JGREA2 0148-0227 Google Scholar
M. I. MishchenkoA. A. LacisL. D. Travis,
“Errors introduced by the neglect of polarization in radiance calculations for Rayleigh scattering atmospheres,”
J. Quant. Spectrosc. Radiat. Transfer., 51 491
–510
(1994). http://dx.doi.org/10.1016/0022-4073(94)90149-X JQSRAE 0022-4073 Google Scholar
R. C. LevyL. A. RemerY. J. Kaufman,
“Effects of neglecting polarization on the MODIS aerosol retrieval over land,”
IEEE Trans. Geosci. Remote Sens., 42
(11), 2576
–2583
(2004). http://dx.doi.org/10.1109/TGRS.2004.837336 IGRSD2 0196-2892 Google Scholar
B. A. Bodhaineet al.,
“On Rayleigh optical depth calculations,”
J. Atmos. Oceanic Technol., 16
(11), 1854
–1861
(1999). http://dx.doi.org/10.1175/1520-0426(1999)016<1854:ORODC>2.0.CO;2 JAOTES 0739-0572 Google Scholar
N. C. Hsuet al.,
“Aerosol properties over bright-reflecting source regions,”
IEEE Trans. Geosci. Remote Sens., 42
(3), 557
–569
(2004). http://dx.doi.org/10.1109/TGRS.2004.824067 IGRSD2 0196-2892 Google Scholar
M. El-Metwallyet al.,
“Aerosol characteristics over urban Cairo: seasonal variations as retrieved from Sun photometer measurements,”
J. Geophys. Res., 113
(D14), D14219
(2008). http://dx.doi.org/10.1029/2008JD009834 JGREA2 0148-0227 Google Scholar
A. S. ZakeyM. M. Abdel WahabP. A. Makar,
“Atmospheric turbidity over Egypt,”
Atmos. Environ., 38
(11), 1579
–1591
(2004). http://dx.doi.org/10.1016/j.atmosenv.2003.12.017 AENVEQ 0004-6981 Google Scholar
|
||||||||||||||||||||||||||||||||||||||||||||||||||||||||||||||||||||||||||||||||||||||||||||||||||||||||||||||||||||||||||||||||||||||||||||||||||||||||||||||||||


