|
|
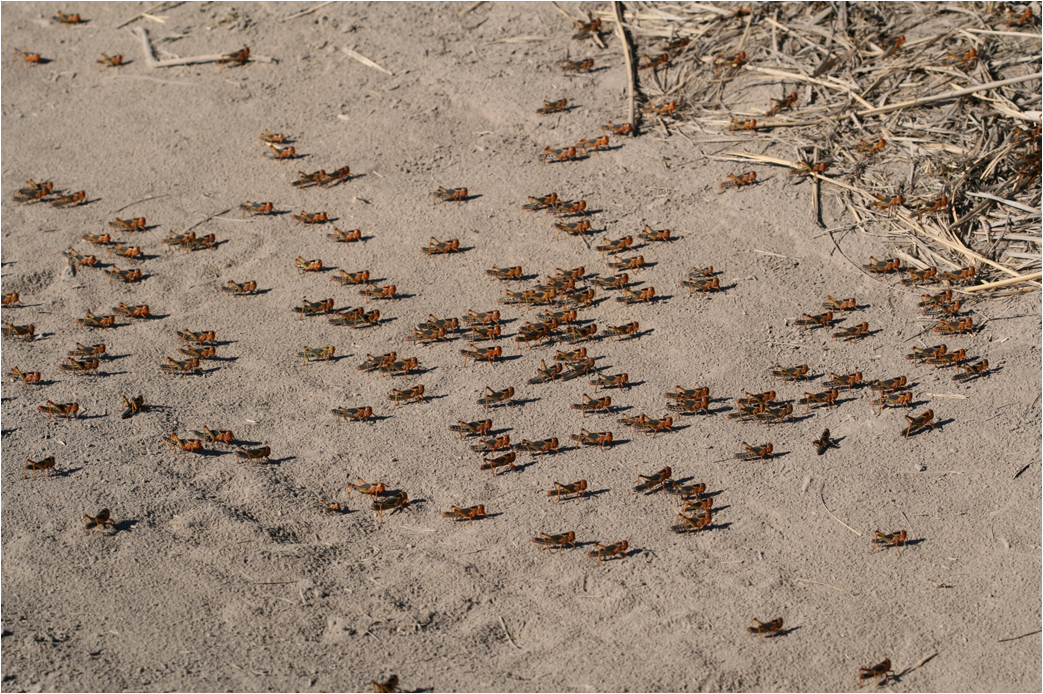
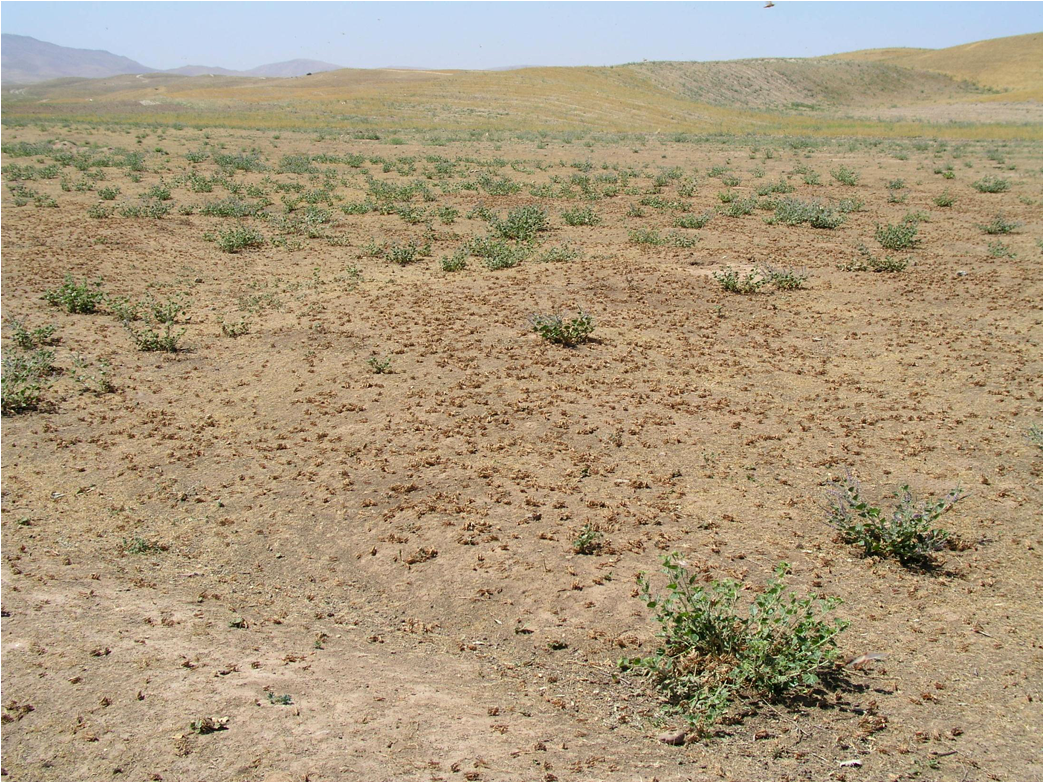
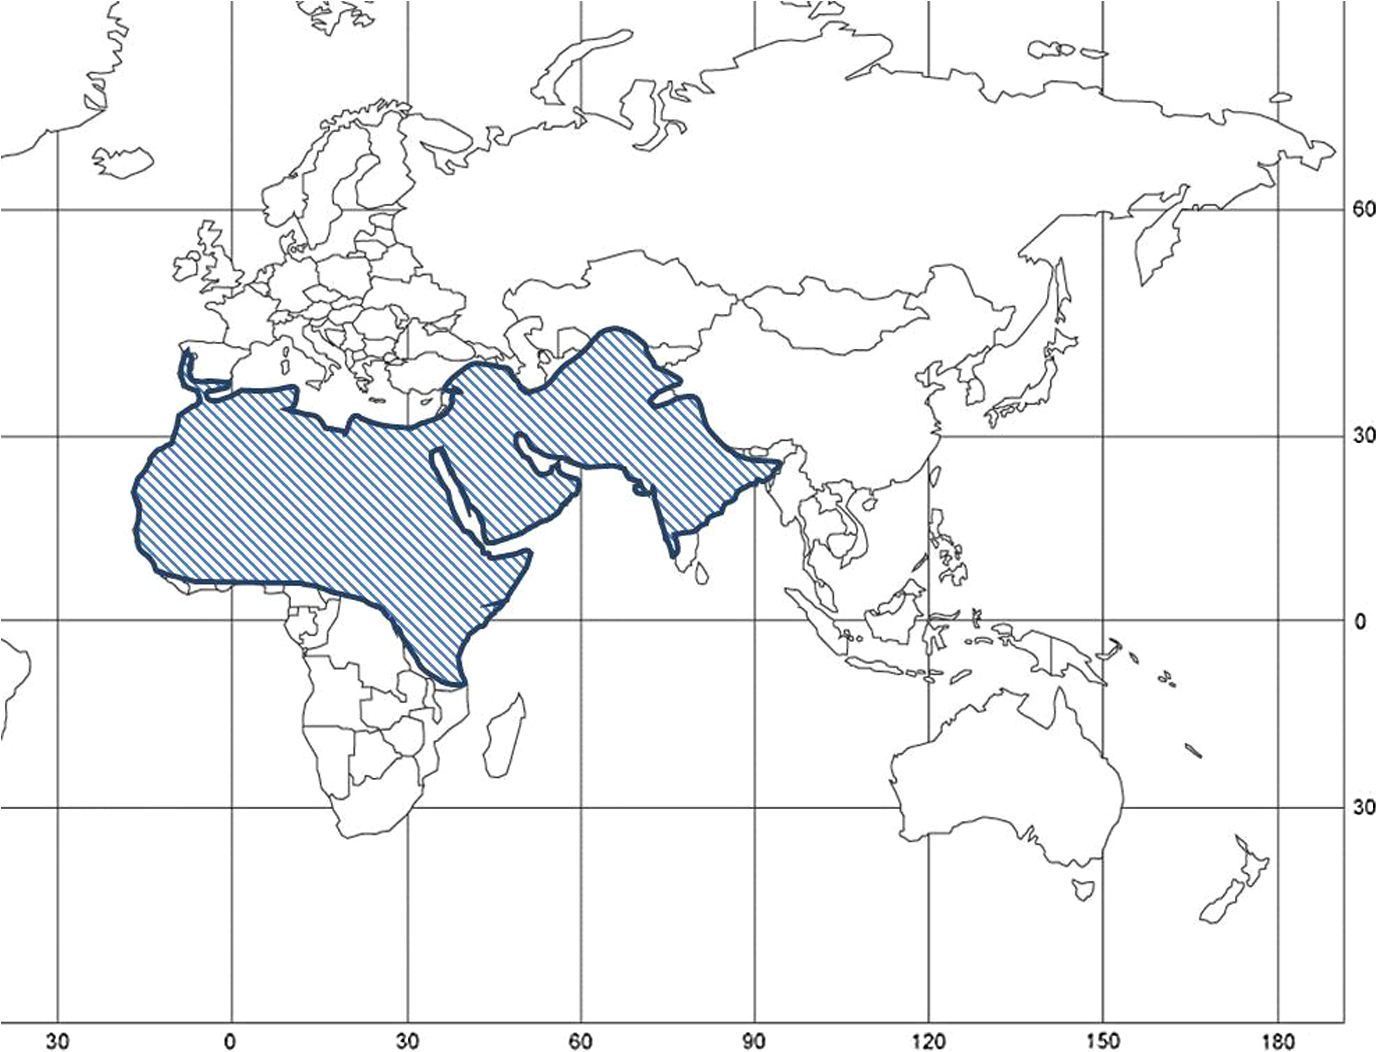
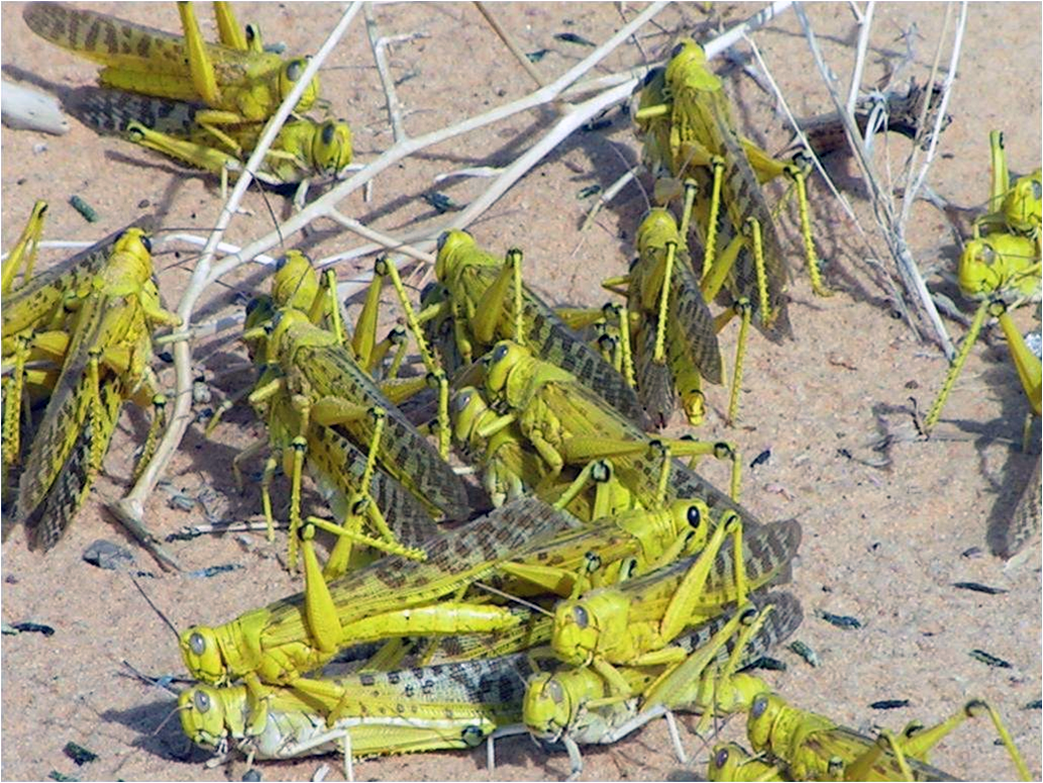
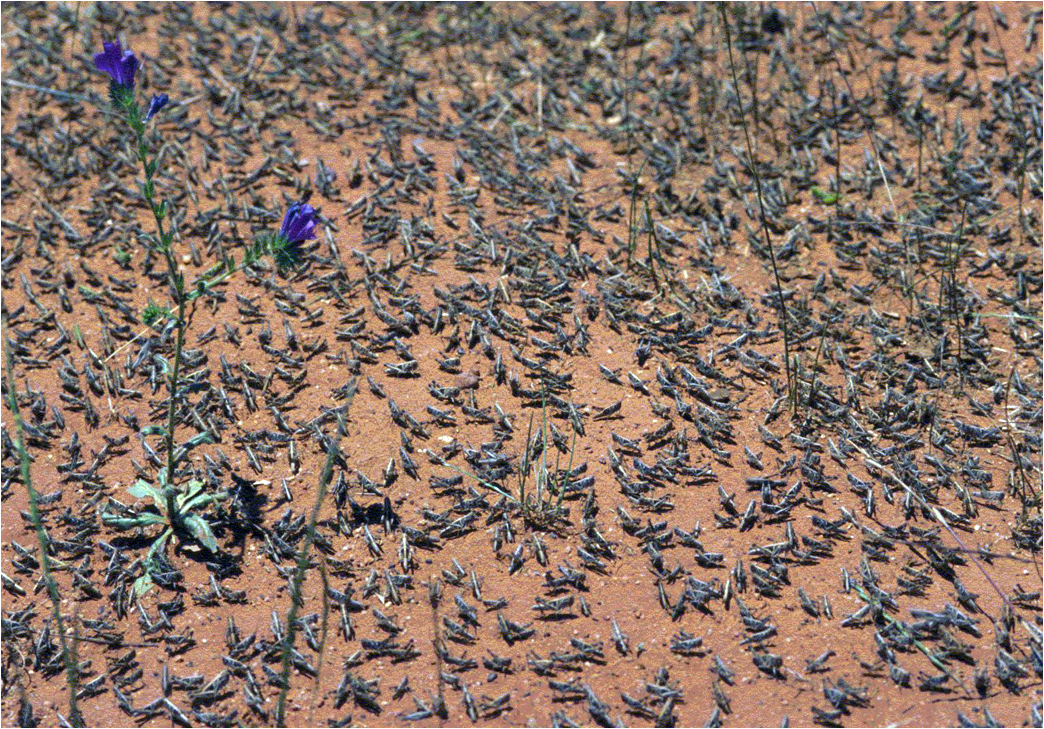
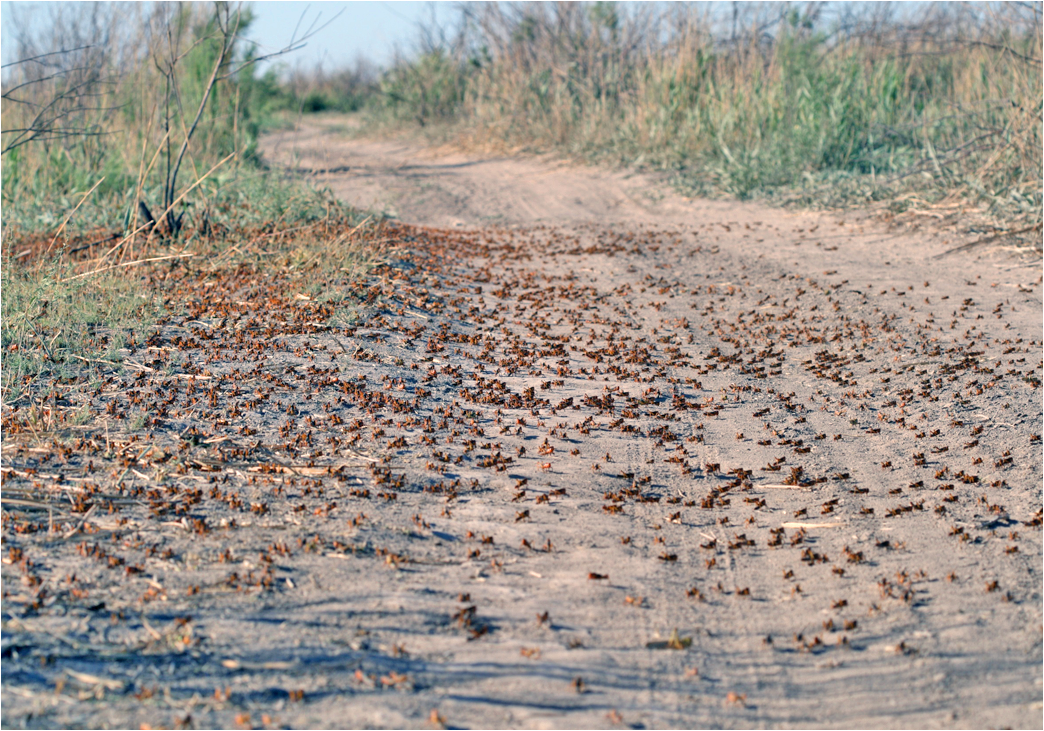
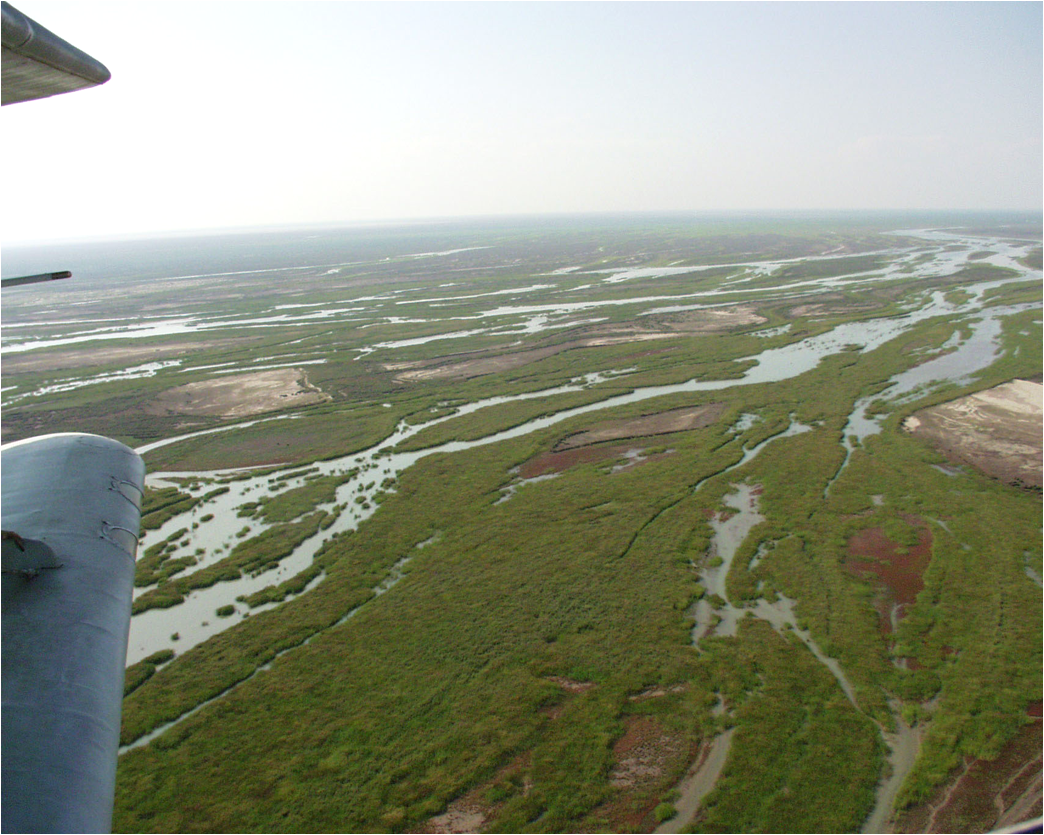
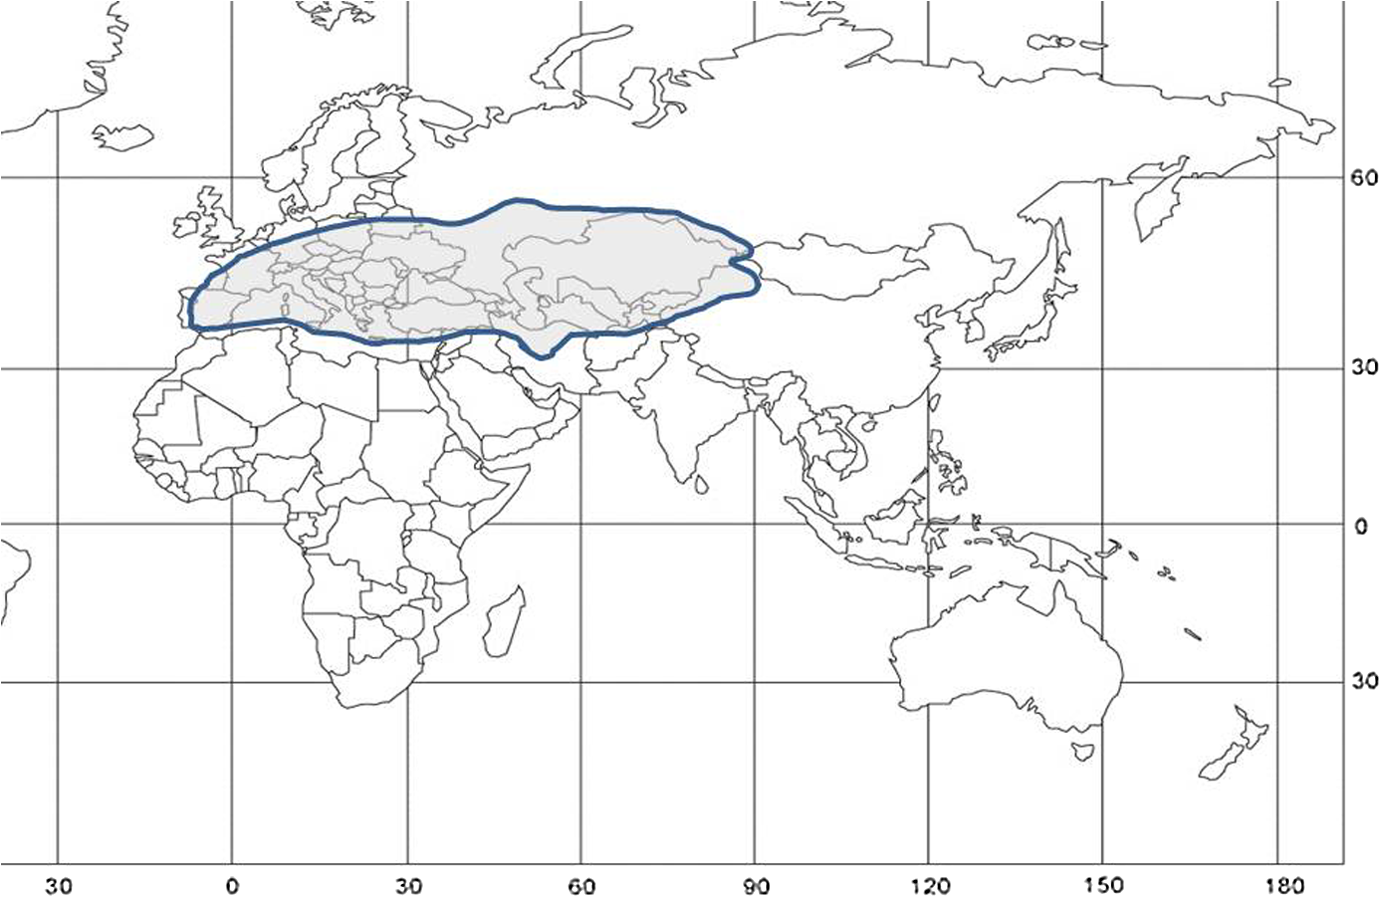
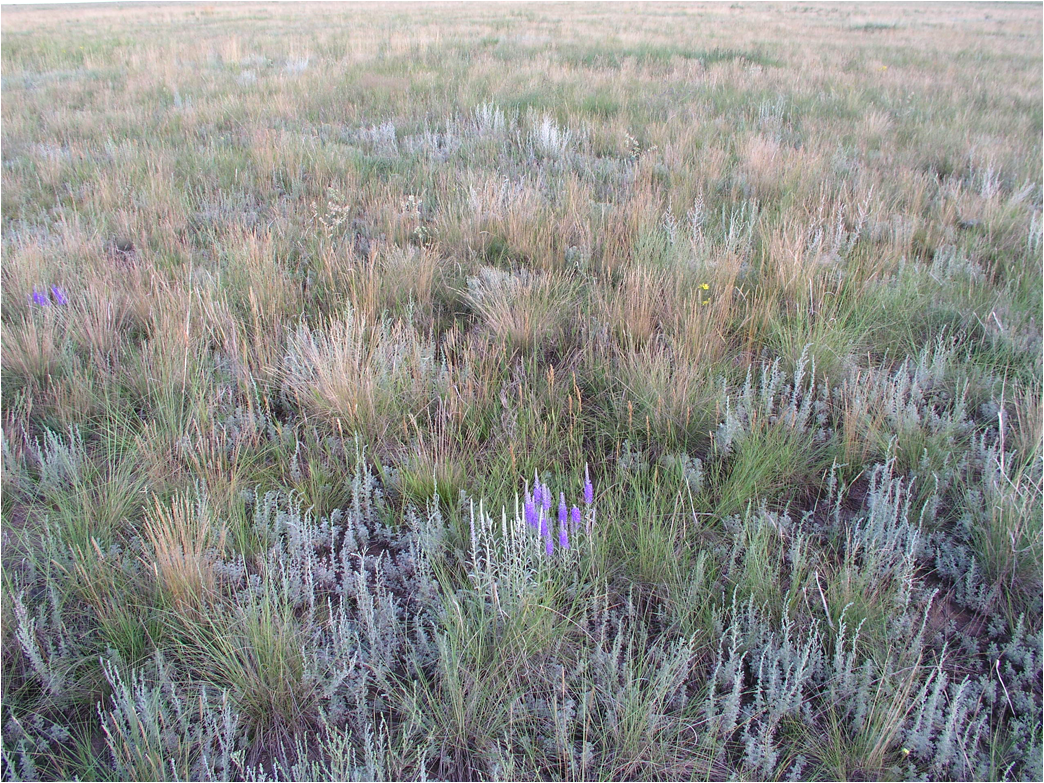
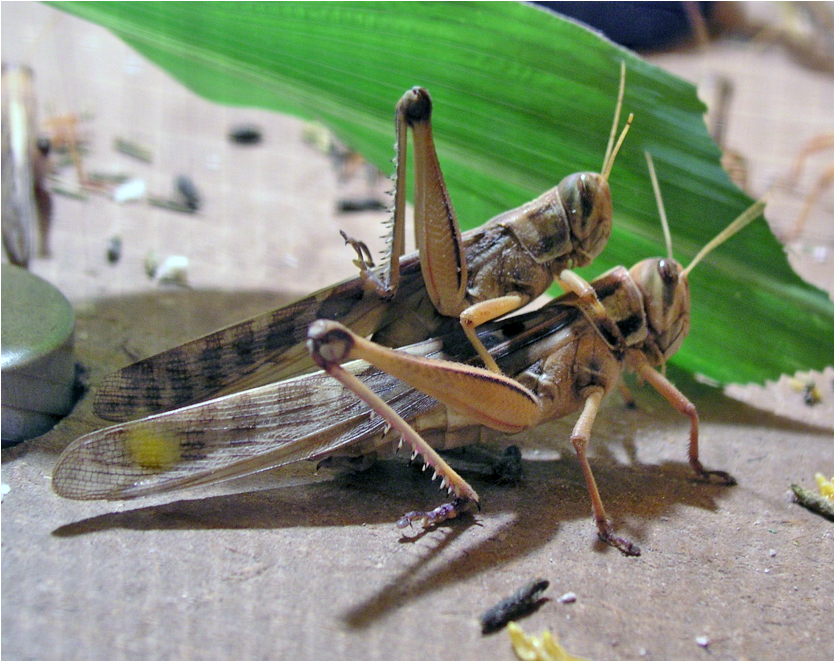
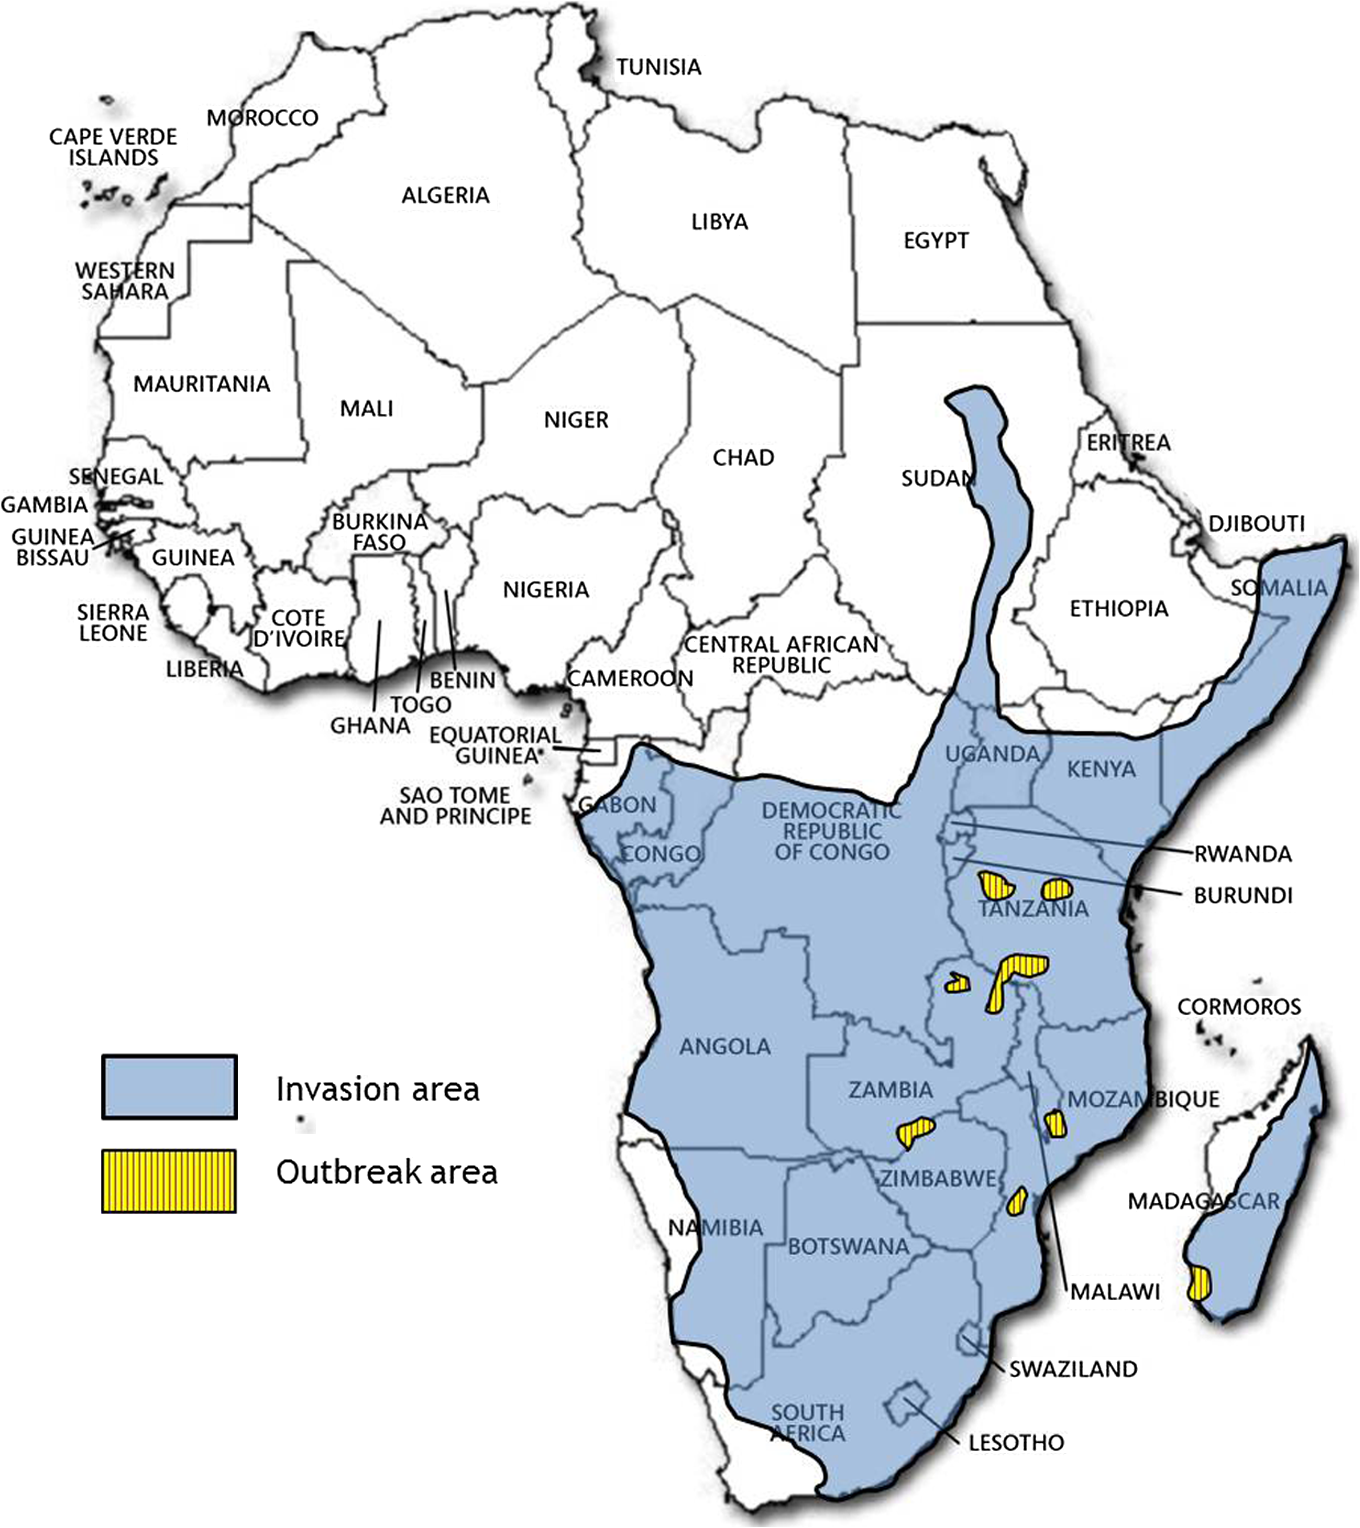
1.IntroductionLocusts have been the enemies of humans since the early days of agriculture. They are mentioned in ancient sacred books such as the Torah, the Koran, and the Bible. In the latter they constitute the infamous Eighth plague of Egypt. In the Old Testament of the Bible, there are about 100 references to insects and other arthropods; among them, the 40 references to locusts and grasshoppers far outnumber all other related quotes.1 Locust swarms often brought devastation and famine to entire nations. According to the ancient Roman historian Pliny the Elder, in 125 BC, 800,000 people died in the Roman colonies of Cyrenaica and Numidia (territories of contemporary Libya, Algeria, and Tunisia) from famine caused by a locust plague.2 In 1958 in Ethiopia, locusts destroyed 167,000 tons of grain, which is enough to feed 1 million people for a year.3 From the taxonomic standpoint, locusts are short-horned grasshoppers (suborder Caelifera, family Acrididae) of the insect order Orthoptera. Locusts are known to exhibit their density-dependent behavioral, physiological, and phenotypic polymorphism.4,5 Under low population densities, locusts live in the “solitarious phase” characterized by camouflage coloration (Fig. 1), infrequent social interactions, and sedentary behavior. At high densities, locusts develop into the “gregarious phase” often with strikingly black-and-orange colored nymphs (Fig. 2), which march in cohesive “hopper bands”4–6 (Fig. 3). The most spectacular differences between the phases are in behavior: the solitarious adults avoid each other except for mating, while the gregarious adults pack together in swarms (Fig. 4); they migrate, feed, mate, and lay eggs in crowds (Fig. 5). Furthermore, locust phases differ in food selection, nutritional physiology, metabolism, reproductive physiology, neurophysiology, endocrinology, pheromone production, longevity, morphology and molecular biology.6 Out of 6,400 described grasshopper species of the family Acrididae in the world, only about a dozen exhibit pronounced behavioral and/or morphological differences between phases, and should be considered locusts.5 In other words, all locusts are grasshoppers, but only a few grasshoppers are locusts. The capacity to produce a swarming phase appeared independently a number of times in four subfamilies (Cyrtacanthacridinae, Calliptaminae, Gomphocerinae, and Oedipodinae) within the family Acrididae and is considered as a relatively recent trait in their evolution.7 Both the locusts and their nonswarming “cousins” the grasshoppers are an essential component of temperate and tropical grassland biomes worldwide, particularly in the arid regions.8,9 At average population densities, they are beneficial for the grasslands ecosystem by stimulating plant growth, facilitating nutrient cycling, and playing vital roles in food webs.9,10 However, from time to time they can produce devastating transcontinental plagues and become a major threat to agriculture.9 The economic importance of locusts is not merely limited to direct crop and pasture damage. During outbreaks, a tremendous and costly effort is applied to control these pests. Although certain progress has been made recently toward locust outbreak prevention, current locust control strategies are still essentially curative, consisting of large-scale applications of broad-spectrum insecticides to locust infestations.11–15 There is a growing concern over the environmental impacts of locust control programs.16–20 Since many locusts inhabit desert and semidesert areas in developing countries, management of these pests is largely dependent on donors’ geopolitical interests, availability of funds, stakeholder inputs, and numerous other socioeconomic aspects.21,22 2.What Makes the Locusts a Threat to Global Food Security?While the proportion of agricultural crop yield lost every year to all pests combined typically ranges between 30 and 40%,23,24 the proportion of crops destroyed by locusts worldwide appears not to exceed 0.2% per year.25,26 Is our perception of locusts as the “worst historical pests”27 disproportionally exaggerated and based on myths rather than facts? The answer to this question is scale-dependent. Locust outbreaks have occurred on all continents except Antarctica and they can harm the livelihood and well-being of 10% of the world’s population.5 The desert locust Schistocerca gregaria (Forskål, 1775) outbreak of 2003–2005 affected 8 million people in over 20 countries with an estimated 80 to 100% of crops lost in afflicted regions, mostly sub-Saharan Africa.28 In Kazakhstan, an outbreak of the Italian locust Calliptamus italicus (Linnaeus, 1758) in 1999 resulted in the destruction of 220,000 ha of grain crops at an estimated cost of USD 15 million.29 Locust damage can be compared to that from a natural disaster like a hurricane or a tornado. For an entire national economy the total crop losses from locusts may seem negligible. For a given farmer or a cooperative, even a brief passage of a locust swarm may result in a complete destruction of the whole season’s work. This is particularly true for subsistence farmers in Africa as well as in Central Asia or Caucasus. Another important feature of locust outbreaks is their transboundary and often transcontinental nature. The invasion range of the desert locust covers over 20% of the Earth’s dry land in over 60 countries of the world (Fig. 6);3 the distribution of the migratory locust, Locusta migratoria Linnaeus 1758, is even larger (Fig. 7).30 Locust infestations in Central Asia annually cover millions of hectares (Fig. 8) and are a threat to all crops and pastures.31 Fig. 7Distribution range of the races/subspecies of the migratory locust Locusta migratoria L. (modified from Refs. 30, 32, and 33). Locusta m. migratoria and L. m. rossica –––; L. m. cinerascens - - -; L. m. burmana •••••; Indian subspecies •••–; L. m. migratorioides– • – •; L. m. capito +•••+; Arabian subspecies +++; L. m. manilensis ….; Australian subspecies -+-+-.  Fig. 8Annual areas (in hectares) surveyed, infested and treated against the three locust species, C. italicus, D. maroccanus, and L. migratoria in five Central Asian countries (Kazakhstan, Kyrgyzstan, Tajikistan, Turkmenistan, and Uzbekistan) in 2006–2012. Data source: FAO “Locust Watch CCA” website ( http://www.fao.org/ag/locusts-CCA/en/index.html).  Besides the enormous distribution ranges, other features that make the locusts extremely dangerous pests are their proverbial voracity and polyphagy. Locusts are known to eat an equivalent of their own weight of green vegetation daily,3 although this is more true for the immature stages than adults.34 Locust swarms can attack numerous species of plants and destroy all major varieties of crops. More details on crop damage by different locust species can be found in Sec. 5. Locusts are also notorious for their high fecundity and reproduction rates. In tropical and subtropical regions locusts develop continuously and produce two to four generations per year.2,3,30 Temperate locusts are univoltine,30 but even in this case their population size can increase dramatically from one year to the next. Locust life cycle includes a succession of three stages: egg, nymph, and adult (Fig. 9). A female lays eggs in the soil (Fig. 10) in batches called egg-pods, with each egg-pod containing from a couple of dozen to over 100 eggs, depending on the species.2 Each female typically deposits one or more egg-pods throughout her lifetime. During oviposition gregarious females aggregate, and the ensuing egg-pod densities commonly reach several thousand per square meter (Fig. 5).2,5 After hatching, nymphs grow through multiple (most frequently five, sometimes up to seven) successive stages or instars to reach adulthood. Early-instar nymphal population densities can be at the order of tens of thousands of individuals per square meter.2,30 After the last molt, the fledging adults mature, mate, and lay eggs, completing the cycle (Fig. 9). Fig. 10Female of Australian plague locust laying eggs in the soil. Photo: David Kleinert Photography (reproduced by permission). 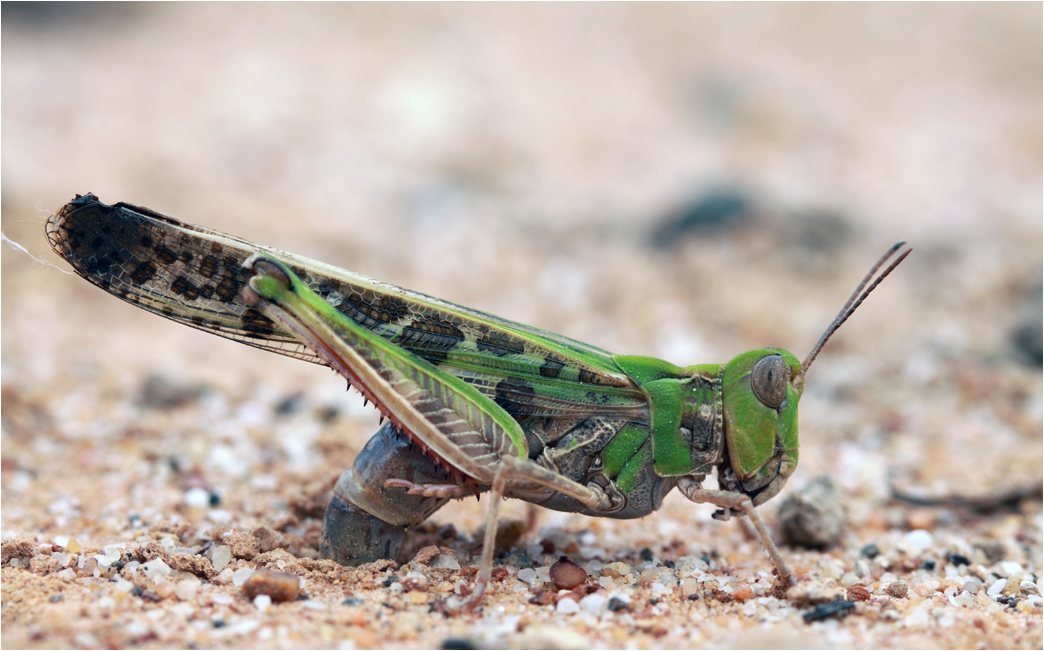 Another trait that makes the locusts extremely dangerous and transboundary pests is their capacity for long-distance migrations, especially during the period of sexual maturation in the adult stage. The average distance covered by a swarm during a day varies from 10 km for the Moroccan locust to 200 km for desert and migratory locusts.2,30 While some locust species only fly several hundred km during their adult life, others fly many hundreds and even thousands of km. For example, migratory locust swarms can fly distances of up to 1000 km. The longest migrations are known for the swarms of the desert locust which flew across the Atlantic Ocean in 1988, having covered 5,000 km in 6 to 10 days.35,36 Swarm sizes, particularly of the desert locust, can be enormous, covering areas up to 800 km2 and containing up to 40 billion locusts, which is the largest terrestrial congregation of animals on Earth.4 3.Locust Outbreaks: Always Unexpected and Unpredictable?Despite many decades of intensive fundamental and applied research,2,6,30,34 our ability to predict spatio-temporal dynamics of locust populations is still not adequate. As a result, locust outbreaks—the dramatic increases in population sizes which translate in spectacular hopper band movements and swarm flights—still often remain “unexpected,” and the current locust management strategy remains inefficient, costly, and unsustainable.15,22 The main reason for this is that the areas of initial locust aggregations (gregarization “hot-spots”) are usually scattered over a vast and sparsely populated territory. For the desert locust, the area of incipient gregarizations (the so-called recession area) covers 16 million , which is roughly equal to the areas of the United States and Australia combined.3,30,37 The breeding areas of the Moroccan locust are spread over 10,000 km across North Africa, the Middle East, and Central Asia.38,39 Despite all national and international efforts to implement efficient locust monitoring, there is always a threat that in some locations locusts may produce an undetected gregarious population, leading to a large-scale outbreak. As a result, curative insecticide treatments are applied to enormous areas to minimize crop losses from locust outbreaks. For example, in Central Asia, over 2 million hectares were treated annually against the Italian, migratory, and Moroccan locusts in 2008–201240 (Fig. 8). Furthermore, locusts produce outbreaks (and thus require control) at irregular intervals, which makes the sustainability of management infrastructure very challenging. Survey programs and logistical expertise do not survive through long recession periods and end up deteriorating and becoming inefficient.41 Furthermore, international donor organizations often lose interest in sustaining locust management in between the plagues, which results in inadequate crisis preparedness of control structures.22 4.Locust Monitoring: How to Address the Problem of Scale?In order to reduce the agriculturists’ exposure to locust outbreaks, numerous national and several international agencies are involved in locust monitoring and control. The goal of locust monitoring is to assess the geographic extent of the locust infestation, find the gregarization hot-spots, evaluate the population parameters such as densities and developmental stages, and, if necessary, plan the control activities. Throughout the world, locust monitoring is typically implemented via ground-based surveys. Field survey data are reported to the national locust control units and shared with neighboring countries and international agencies. To assess locust risks and develop preventive measures, data on land cover habitat conditions are required. Field scouts collect information on the static ecosystem parameters (elevation/topography, soil type, vegetation type), as well as the dynamic parameters (soil moisture, temperature and rainfall, vegetation cover and growth). Particular attention is given to vegetation, which represents the essential component of the locust habitat, providing for them food and shelter. One of the biggest challenges in locust population monitoring is the immense, often transcontinental scale of the problem. Consequently, it requires a scale, which is qualitatively different from most other insect pests. Millions of hectares of potential locust infestations should be surveyed in a narrow window of time (usually just several weeks) dictated by the locust life cycle. As an example, in the recent years areas of locust (C. italicus, L. migratoria, and D. maroccanus) surveys in Central Asia were close to or exceeded 12 million hectares per year42 (Fig. 8). During outbreaks, areas to be surveyed can be ten and more times higher than in recession years. For example, an astronomical area of 34 million hectares (almost equal to the entire area of Montana) was surveyed in 2000 in Kazakhstan.43 For tropical locusts the surveys should be repeated several times per year according to the number of annual generations. It is evident that traditional, ground-monitoring methods can hardly achieve the task of such enormous scale and provide reliable spatio-temporal pest development and distribution data. Remote sensing, in terms of satellite image data, appears to be instrumental in addressing the challenge of scale in locust ecology. The first applications of remote sensing to locust monitoring were attempted as early as the 1970s to 1980s in Africa44,45 and Australia.46 Since then, there is a substantial body of publications on the subject (see Ref. 47 for review and references therein). The use of satellite data over vast areas in combination with GIS significantly improved locust forecasting and risk assessment.48,49 Yet after more than 30 years, satellite remote sensing became a routine part of locust monitoring only in two cases, the desert locust50 and the Australian plague locust.51 There are several reasons for this; the technological and educational ones are beyond the scope of the present review, which in the next section will address only the bio-ecological basis for potential applications of remote sensing to locusts. 5.Biology and Ecology of the Main Locust Species: Can Satellite Data Assist in their Habitat Monitoring?Efficient management of any pest is based on the thorough knowledge of its biology and ecology. The key event in the biology of locusts is the change from a single-living and sedentary solitarious phase to a gregarious phase in which they live in dense bands or swarms, actively migrate, and may devastate crops and rangeland well beyond their breeding sites. This phenomenon is known as locust phase transformation.8 It requires suitable environmental conditions and takes several consecutive generations to complete the density-dependent process of phase transformation from a solitarious to a gregarious phase. Most of the time locusts lead solitarious lives, but at some points in time, changes in their environment may initiate crowding, or “gregarization.” As a general rule, locust aggregation and eventual phase transformation are favored by habitat discontinuity or patchiness, which can result from a variety of meteorological events.5,8,39 Locusts significantly differ in their life cycles, habitat preferences, and other ecological requirements. It is appropriate to consider potential advantages and limitations in their satellite-based monitoring on a species-specific basis, and for most economically important locust species. 5.1.Desert Locust, Schistocerca Gregaria (Fig. 11)The recession area of the desert locust occupies arid and semi-arid lands covering 16 million from the Atlantic Ocean to Northwest India3,8 (Fig. 12). Breeding occurs in the areas that receive 20–25 mm direct rainfall, and preferred oviposition sites are in sandy soils with a mosaic of grasses, herbs, and shrubs.30,37 Although rain over the area is largely erratic, it tends to fall seasonally. Consequently locust breeding also occurs seasonally in different geographic locations. The summer breeding zones include the Sahel, West Africa, Sudan, Eritrea, Ethiopia, and the India-Pakistan border. The winter/spring breeding zones include NW Africa, Iran, Pakistan, the Red Sea and the Gulf of Aden coasts, and the interior of Saudi Arabia and Yemen37 (Fig. 12). Fig. 12Desert locust recession area with seasonal breeding zones and population movements between them (modified from Ref. 52).  Seasonal rains in the deserts trigger the growth of green vegetation, which attracts the desert locusts. This species is extremely sensitive to density changes, and its phase transformation occurs very rapidly and frequently. Females often aggregate to lay eggs (Fig. 13), which triggers and/or maintain the gregarization. The oviposition habitat is a mosaic of bare ground and patches of emerging perennial and annual herbaceous vegetation. For successful incubation, eggs of the desert locust must absorb their own weight of water from the soil.3 If soil moisture is insufficient, the eggs maintain viability for up to six months, after which they succumb from desiccation.37 In case the soil is moist enough, the eggs may hatch in about two weeks.30 Densities of hatching nymphs may reach (Ref. 8). Hopper development includes five or six instars and takes between 22 (hot conditions) and 70 (cool conditions) days.30 During this period hoppers form cohesive bands that can march up to several km per day.8 Immature adults are colored in pink (Fig. 11); they pack in swarms that fly up to 200 km per day in search for areas suitable for egg-laying and successive hopper development. Once such habitat is found, the swarms settle, sexual maturation starts, and adults turn yellow and copulate. Several days later females start laying egg-pods at intervals of 7 to 10 days (Fig. 13). Desert locust is highly polyphagous. The number of plant species it can attack exceeds 500 and includes all agricultural crops.30 Swarms may contain 50 million adults per , so even a moderate swarm would consume 1000 tons of fresh vegetation daily.2,30 The area that can be invaded by the desert locust swarms is 29 million (Ref. 52) (Fig. 6). Damage is reported from almost 50 countries worldwide.30 Most recent large-scale outbreaks of S. gregaria occurred in 1986–1989 and in 2003–2005, mostly on the African continent. In 1986–1989, 16.8 million ha were treated with 11 million liters and 2,700 tons of dust insecticides.53 The costs of campaign to the international donor community amounted to USD 274 million.54 During this outbreak, the transatlantic swarm flights mentioned above were recorded in 1988.35,36,54 In 2003–2005, to curtail the outbreak of the desert locust, 13 million ha were treated with broad-spectrum insecticides in 26 countries on three continents. Such transcontinental operations, together with food aid for affected populations, cost over half a billion USD to the world community, not to mention human and environmental health costs.55 Reliable and timely identification of the areas where vegetation emerges after rainfall is the main goal of the desert locust monitoring and the key to its preventive management, as opposed to a conventional, curative approach. Under the preventive mode, locust control services are proactively searching for incipient gregarizing populations and control them on a small scale before the onset of emigration flights.14 Obviously, location of such areas via ground surveys presents tremendous difficulties. Most of them are scattered over vast unpopulated zones with scarce water sources and virtually no roads. Several key locust breeding areas are in the zones of ongoing military conflicts. Political insecurity hampers all activities in those regions, not to mention the locust monitoring. Taking all this into account, the applications of satellite data and GIS provided an important advance in desert locust monitoring and forecasting. It became possible through financial and institutional support from the international organization, the Food and Agriculture Organization of United Nations (FAO) which operates the desert Locust Information Service (DLIS). An up-to-date account of this system is presented in the current special section.56 In addition to satellite imagery, an interesting possibility for assessment of the soil moisture—one of the key predictors to locate the desert locust breeding sites—is offered by the active remote sensing in the form of RADAR. Although this methodology is widely used for measuring soil moisture worldwide,57–60 to our knowledge its applicability to the desert locust habitat monitoring has not been tested yet. Finally, another RADAR application consists in the use of the Vertically Looking RADAR (VLR) to track the desert locust swarm flights. This tool was applied as early as in 196861 and later was considered a useful complement for the routine locust surveys.62 However, the time-consuming nature of the data analysis made this swarm-tracking tool impractical.63 Analysis of existing publications47,50,56,64–69 reveals that, although the main goal of the desert locust habitat monitoring—to distinguish between the green vegetation and nonvegetative areas—appears to be attainable through processing certain types of satellite data, the method has important limitations. The vast range of the locust makes it very difficult to find an acceptable compromise between the spatial and temporal resolutions when choosing the remote sensing platform. A huge amount of different remotely sensed data (land cover, meteorology, locust information…) makes the processing increasingly sophisticated, time consuming, and expensive. With very few exceptions, most national desert locust control organizations of the affected countries are not capable to perform this task, and therefore they rely on the expertise and funding of an international agency—FAO and its DLIS. Hence the desert locust monitoring and forecasting is becoming increasingly demanding for the international community from both technological and financial standpoints. As such, forecasting and battling the “worst historical insect pest” remain very challenging, even in the 21st century. 5.2.Australian Plague Locust, Chortoicetes Terminifera (Figs. 10 and 14)Australian plague locust occurs throughout Australia, where it is a major agricultural pest. Its preferred habitats consist of a mosaic of bare ground for basking and egg-laying, short-grass cover for feeding, and taller sparse tussocks for night shelter. The locust can produce up to three annual generations under sufficient moisture conditions. Hoppers form dense bands (Fig. 15) that march several hundred meters per day. Outbreaks are triggered by abnormally heavy rains in November through January that fall in several key areas in the arid/semi-arid interior of the continent (SW Queensland and Central New South Wales)30 (Fig. 16). From these breeding areas huge swarms of adults fly into agricultural zones covering distances of up to 600 km in one night.70 Although the rangeland forage is the preferred food for the Australian plague locust, the migrating swarms can inflict severe damage to cereal crops, vineyards, orchards, and vegetable gardens. Australian plague locust nymphs are estimated to consume between 0.04 g (nymphs; averaged across all instars) and 0.2 g (adults) of green vegetation per day. With adult densities in settled swarms up to , a swarm covering an area of could destroy over one ton of green vegetation a day.70 In 1984, during a major outbreak of the Australian plague locust, estimated crop loss was AUS 5 million.70 Fig. 16Areas (shaded) of most frequent infestations of Australian plague locust in 1977–2008 (modified from Refs. 47 and 70). 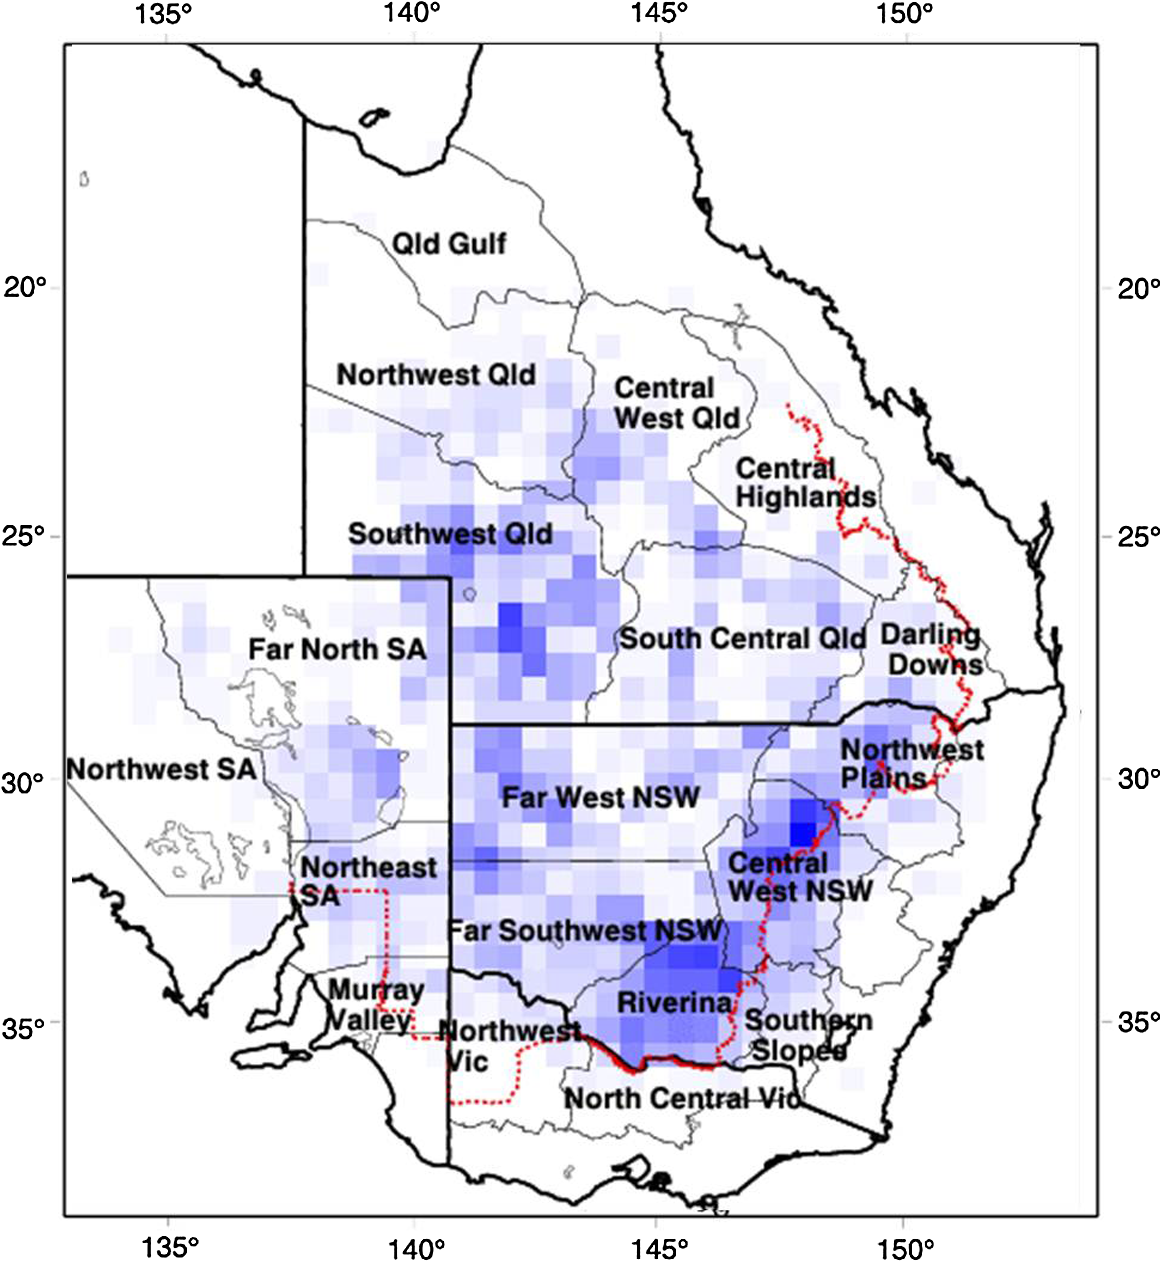 The Australian plague locust populations can reach plague proportions within a single year if a sequence of widespread heavy rains occurs in inland areas.71 Such rains trigger transformation into the gregarious phase, allowing locusts to complete several generations of increasing populations. Less regular rains, falling in both the interior and in the agricultural zone of eastern Australia, can maintain high-density gregarious populations for several years. A plague cycle may involve migrating swarm exchanges between regions of summer and winter rainfall, and the persistence of high-density populations in agricultural regions of inland southeastern Australia. Prolonged periods of drought usually result in a population decline to very low levels and transition to solitarious phase. Between 1934 and 2012, Ch. terminifera produced plague populations in 16 years, infesting over half a million hectares in the agricultural zone; the plagues usually lasted for only one or two years.70 The behavioral pattern and habitat requirements reveal similarities between the bio-ecology and population dynamics of Ch. terminifera and S. gregaria. Similarly, from the remote sensing standpoint, the goal of locust monitoring is to quickly and reliably identify the areas of green vegetation emerging after rains in the arid zones of the continent. Since, like in the case of the desert locust, the breeding zones of the Australian plague locust are situated in remote and semi-desert locations, the Australian entomologists were among the first to use satellite data for locust habitat mapping since the early 1980s.46,72,73 These studies showed that satellite data were instrumental in detecting the emerging vegetation and changes in vegetation condition which could then be associated with locust breeding areas, particularly the egg-bed locations.74 As such, it was possible to locate the areas which served as sources of locust outbreaks.75,76 Australia is the world leader in terms of organization and implementation of locust monitoring and management. These activities are executed by a federal agency, the Australian plague Locust Commission (APLC), which incorporated the use of the remotely sensed data into the practice of locust forecasting.77–79 Multiple information sources, including remotely sensed vegetation and weather data as well as locust infestation data, were integrated into a GIS-based decision support system developed at APLC.80–82 It provides a reliable forecast of the Australian plague locust and other economic locust and grasshopper species, allowing people to devise and implement timely and efficient control plans. During a major outbreak of the Australian plague locust in 1984, a cost-benefit analysis estimated that without locust control over $100 million of crop losses may have occurred.70 More recently, an economicanalysis of APLC locust control during 1999–2004 concluded there was a direct benefit-cost ratio of approximately (Ref. 70). Other remote sensing technologies, such as vertically looking RADAR, are also used in Australia to track locust swarm migrations;83–85 however, because of financial reasons, the current use of the tool is limited to only two devices.70 In summary, in terms of the remote sensing applications to locust management, Australia represents one of the most advanced examples. As for the problems, the APLC control responsibilities do not cover all breeding areas of Ch. terminifera on the continent, which requires cooperation between the APLC and locust control services of non-APLC states (e.g., Western Australia), particularly during outbreaks and swarm migrations. 5.3.Migratory Locust, Locusta MigratoriaDespite the fact that Locusta migratoria has the largest distribution area among all grasshoppers and locusts (Fig. 7), the ecological requirements of the migratory locust are quite narrow. The locust’s breeding sites are restricted to wet grasslands on light soils, for example, stands of common reed (Phragmites australis (Cav.) Trin. ex Steud) along rivers or lakes (Fig. 17).3,8,30 Due to seasonal changes in hydrology, such areas are intermittently inundated, creating a dynamic and ever-changing locust habitat. Typically, population build-up takes place in a dry year (or season) after abnormally wet years (or seasons). Initial aggregations occur when water starts to recede from flooded areas, causing the locusts to concentrate on patches of drying-up soil with reeds or other grasses. The concentrations may lead to gregarization and trigger phase transformation. Such mosaic sites with open sandy patches and grassy vegetation clumps are the primary targets of the locust scouts during field surveys. There are about 10 geographic races (or subspecies) of the migratory locust worldwide, which slightly differ biologically and morphologically.30 The tropical races—for example, the Oriental migratory locust L. m. manilensis (Meyen, 1835) or the Madagascar migratory locust L. m. capito (Saussure, 1884)—develop continuously without winter diapause and may produce up to four annual generations.30 The temperate races—e.g., the Asian migratory locust L. m. migratoria Linnaeus, 1758—are univoltine, with eggs overwintering in the soil.30,32 These three races—the Oriental, the Madagascar, and the Asian migratory locusts—are the most important economically ones and thus are treated in more detail below. It should be noted that the African race of the migratory locust L. m. migratorioides (Reiche & Fairmaire, 1850), which is widespread in Africa south of the Sahara, has lost its economic importance because of the intensive agricultural development in its breeding areas. Therefore it is not covered in the present review. 5.3.1.Asian migratory locust, L. m. migratoria (Fig. 18)L. m. migratoria is one of the most important agricultural pests in the countries of the former Soviet Union, particularly Russia, Kazakhstan, and Uzbekistan. Its main breeding areas cover in total six million hectares. They are situated in reed stands in the deltas of big rivers such as Volga, Amudarya, Syrdarya, Ural, and Ili and around big lakes such as Balkhash, Alakol, and Zaisan.86 Annual infested areas in the Lake Balkhash area and the River Amudarya delta can exceed one million hectares.32 Hoppers usually spend their life in the reeds where they feed and march in very dense groups (Fig. 19). Some hopper bands can be extremely large: Novitsky87 reported a band of 120 km long and 10 km wide. The Asian migratory locust swarms can fly out of the reed areas and damage all major agricultural crops such as rice, wheat, cotton, barley, melon, vegetables, and potatoes.88 Swarms of L. m. migratoria are known to fly distances over 1,000 km; such flights were reported between the River Amudarya delta and west coast of the Caspian Sea.86 The outbreaks are usually preceded by abnormally dry years when larger areas become free from flooding and expand the reed habitat suitable for oviposition. Thus after a severe drought in 1945, the Asian migratory locust infested more than 1 million ha in 1946, and chemical treatments to control the plague were implemented on (Ref. 89). The Asian migratory locust surveys are conducted by Locust Control/Plant Protection services in Kazakhstan, Russia, and Uzbekistan. Wetlands constitute a dynamic system of rivers, canals, lakes, islands, and reed stands with very limited accessibility (Fig. 20). Since locust presence is closely associated with reed stands, the surveys target the spatio-temporal distribution of reed vegetation. Satellite information appeared to be useful in addressing this task. Using satellite data, researchers were able to reliably ( classification accuracy) track the reed distribution in the River Ili (Kazakhstan)90 and Amudarya River (Uzbekistan) deltas.91,92 Using the satellite information, it was possible to map the distribution of reeds in early spring93 or late summer.94 The first period coincides with the Asian migratory locust hatching from the eggs, and the satellite-derived information was useful for directing the ground survey teams towards potential nymphal habitats. The second period coincides with the locust oviposition, and such information could be used for locating locust egg-beds. A combination of remote sensing assessments of vegetation and water depth was proposed to forecast the risk of Asian migratory locust infestations in the Lake Balkhash area of Kazakhstan.95 However, to date, applications of remote sensing to Asian migratory locust monitoring is limited to the use of habitat maps derived from satellite data by the locust control services in Uzbekistan. In other parts of its range (Russia, Kazakhstan, or Northeast China), this methodology is not used yet by locust control services. 5.3.2.Oriental migratory locust, L. m. manilensisThis subspecies is the major agricultural pest in China and Indonesia. In China, it is distributed in central and southeastern provinces but substituted in the north and northwest by the Asian migratory locust33,96 (Fig. 7). Size-wise, L. m. manilensis is slightly smaller than L. m. migratoria. The number of annual generations varies with the latitude. In the northern part of its distribution range between 25 and 40°N usually two generations occur; south of 25°N there are three generations and near 18°N there are four generations.30,33 The preferred habitats of the Oriental migratory locust are very similar to those of the Asian migratory locust: low-lying, intermittently flooded, sandy areas around lakes, particularly near the old bed of the Huang-He (Yellow River) with reeds and other tall grasses and sedges (Cynodon dactylon, Miscanthus sacchariflorus, Bromus japonicus, Eragrostis cilianensis, Setaria viridis, Cyperus rotundus, Scirpus maritimus, etc.30,33 The total potential breeding area of L. m. manilensis covered 405 million hectares in 1950, but after intensive agricultural development it shrank to 323 million hectares in 1986 (Ref. 97). Yet this enormous area (approximately 1/3 of the entire area of the United States) is the largest locust breeding area in the world confined to a single country (China). As in the case of the Asian migratory locust, outbreaks are usually preceded by drought years with higher than the average temperatures.30 Warm winters, which increase egg survival in the soil, appear to be the key climatic factor contributing to outbreak formation; however, it is thought to be less powerful in the wet-humid Yangtze River region.98 Historical records of locust outbreaks in China, which are attributed to L. m. manilensis, exist from 200 B.C.98,99 Although like all other migratory locusts, the Oriental locust prefers to feed on grasses and frequently damages grain crops, it can also attack a wide array of other crops, such as banana, bamboo, citrus, sugar cane, coconut, cotton, lettuce, potato, soybeans, and tobacco.30 An adult locust consumes up to 5 g of fresh vegetation daily, which amounts to over 80 g during its entire life span (nymph and adult).33 Twelve thousand locusts would destroy one ton of food plants during their lifetime.100 Because of the similarity in habitats between the Asian and the Oriental migratory locusts, the remote sensing applications to their monitoring are also similar, targeting the seasonal distribution of the reeds and associated wetland vegetation. In addition, satellite data acquired prior to and after an outbreak in China have been used for quantifying damages to vegetation inflicted by the Oriental migratory locust. It was possible to monitor the ongoing outbreak101 and identify the affected areas with 89 to 98% accuracy.102,103 Satellite-derived information was more accurate than the one derived from traditional ground surveys, but the situation was complicated by overlapping annual generations of the locust.104 Despite these research efforts, to our knowledge, remote sensing is not yet a part of practical monitoring and forecasting of the Oriental migratory locust by Chinese locust control services. 5.3.3.Madagascar migratory locust, L. m. capitoThe Madagascar migratory locust is morphologically similar to the African race, although females have noticeably longer tegmina.105 Its distribution extends from Madagascar to several other islands in the Indian Ocean (Mauritius, Reunion, the Seychelles) (Fig. 7). The locust is multivoltine and usually produces four annual generations, one in the dry season and three in the rainy season.106 The generations overlap, which creates serious difficulties for monitoring and control. The outbreaks are usually short, lasting for one to three years, with much longer recession periods.107 The outbreak area is concentrated in the SW corner of Madagascar in areas covered with Phragmites and Cynodon, from which the swarms fly northward and eastward into the agricultural areas. If the conditions are favorable (e.g., 50 to 125 mm of monthly precipitation during rainy season), significant population build-up and the phase transformation to gregarization, may occur during a single rainy season.108 However, initial concentrations of locusts occur during the dry season breeding, and most of the known outbreaks were preceded by unusually dry seasons. In this respect the population dynamics of the Madagascar migratory locust are similar to those of the other migratory locust races. L. m. capito is the most important economic pest in Madagascar, particularly of rice and sugar cane, as well as banana, coconut, cotton, maize, sorghum, wheat, pineapple, and millet.30 The plague between 1996 and 2000, during which economic losses of USD 50 million were recorded mainly in rice fields, was controlled by large-scale application of synthetic chemical insecticides.109 Given that Madagascar has a unique and rich biodiversity, such spraying may produce significant negative impacts on the environment and nontarget beneficiary organisms.110 In 2010, during another plague, the government estimated that over 460,000 rural families (2.3 million people) were at risk of famine caused by the locust swarms and potential crop losses were up to USD 135 million.111 To date, there was only one attempt to assess the risk of the Madagascar migratory locust infestations using remote sensing. Using a Landsat 7 image, the researchers identified the locust habitats by combining visual interpretation with a supervised image classification.112 The data on the habitat type were combined with rainfall information in a GIS system, permitting a real-time assessment of the locust infestation risk. However, the geospatial methodology has never been used operationally for L. m. capito monitoring and forecasting. To summarize, remote sensing is a useful tool in tracking the tall grass wetland habitats which are favored by the migratory locust races regardless of their geographic origin. For the tropical Locusta, the satellite-based monitoring is complicated by the overlapping annual generations. Research showed that satellite-derived information can be used to assist in habitat classification, ongoing outbreak monitoring, evaluation of vegetation damage, and assessment of risk of infestations of Asian migratory locust in Central Asia, Oriental migratory locust in China, and Madagascar migratory locust in Madagascar. However, because of the insufficient capacities of the local anti-locust agencies, the method had a hard time to find its way into the practical management of the migratory locusts. To our knowledge, for other subspecies of Locusta migratoria, the applications of satellite data to habitat monitoring have never been attempted. 5.4.Moroccan Locust, Dociostaurus Maroccanus (Fig. 21)The geographic range of the Moroccan locust stretches for 10,000 km in the east-west direction, from the Canary and Madeira Islands to E. Kazakhstan38 (Fig. 22). Its distribution is discontinuous, consisting of isolated permanent breeding areas, separated from one another by natural obstacles like mountains or water bodies.39 During rather long periods of recession, this isolation is absolute. During short (one to three years) periods of outbreaks, some exchange between the adjacent populations is possible due to migrating swarms, which can cover distances up to 200 km (Ref. 113). In the course of such periods the populations expand from the permanent breeding areas and establish secondary breeding areas, which may function for several years. The outbreaks are initiated during drier than usual springs when most of the ephemeral vegetation dries up and the locusts concentrate on remaining green patches.38 According to some authors, if such conditions are maintained for two years in a row, solitarious D. maroccanus may accomplish the transformation into gregarious phase and produce an outbreak;114 other authors believe that the process of outbreak formation takes at least four years.38 The patchiness of the Moroccan locust’s distribution suggests that the locust has rather narrow ecological requirements. Indeed, the preferred habitats of D. maroccanus are restricted to virgin foothills in the Mediterranean (s. l.) region located at altitudes between 400 and 1200 m above sea level and receiving about 300 to 500 mm of annual precipitation.39 This zone is covered by arid steppe or semi-desert vegetation consisting of ephemeral short grasses (particularly Poa bulbosa), sedges, and forbs (Fig. 23). For egg-laying, the Moroccan locust females choose areas with a mosaic of vegetation and bare soil, where they aggregate in dense clusters (Fig. 5). Fig. 23Typical habitat of the Moroccan locust in Central Asia with ephemeral grass Poa bulbosa. Photo: A. Latchininsky.  Being highly polyphagous, Moroccan locust attacks all principal cereal crops (wheat, barley, millet, sorghum, rye, oats, and corn), legumes (beans, peas, and lentils), vegetables (cabbage, onions, lettuce, carrots, beets, potatoes, tomatoes, pepper, and cucumber), and forage, oil, and industrial crops (alfalfa, clover, vetch, sesame, cotton, olives, sugar beets, rape, and tobacco), as well as pasture lands. Many tree species, including fruit trees (cherry, apple, pear, peach, apricot, plum, fig, and mulberry), date palms, and even conifers (pine and juniper) are also ravaged.38 Damage from D. maroccanus is reported from 25 countries, mostly in Central Asia.39 For example, in 1958 in Afghanistan, Moroccan locusts ravaged 25% of the country’s crop area and destroyed 100,000 tons of cereals and vegetables.115 In 1983 in Uzbekistan, this locust destroyed 2500 ha of cotton.116 Annual chemical treatments in one country against this species can reach 651,600 ha (1984 in Uzbekistan).38 The Moroccan locust is an early spring species, with hatching in March or April, depending on the latitude.38,39 At one location, all eggs usually hatch within a week, and the nymphal development is very synchronized. Hoppers aggregate in dense bands capable of long-distance marching, adults fly in loose swarms. After mating and egg-laying, the adults die off in early summer. D. maroccanus exhibits a strong embryonic diapause and remains univoltine throughout its entire range, from Morocco to Kazakhstan.30,38,39 The nymphal and adult stages last for two to three months, while the overwintering embryonic stage makes up for the rest of the annual cycle (up to nine months). Hence the time window for locust surveys is extremely limited while the areas to be surveyed every year cover millions of hectares in Central Asia. Furthermore, the transboundary nature of the Moroccan locust habitats in Central Asia is another obstacle to its efficient monitoring and management. Numerous permanent breeding areas are located on both sides of the border between adjacent countries.117 Although the migratory flights of this locust are relatively short (70–200 km), they often occur across the national boundaries.118 This trait of the Moroccan locust behavior requires cooperation and joint efforts between the neighboring states. Such cooperation is only making its first steps thanks to the FAO’s “Five-Year Program on Improving National and Regional Locust Management in Caucasus and Central Asia,”119 but it is far from being fully operational yet. The bio-ecology of the Moroccan locust presents certain challenges to its successful monitoring and management. As in the cases of other locust species described above, satellite information may provide valuable insights in tracking the Moroccan locust habitats and assessing risk of its infestations, especially along the national borders where ground surveys are limited. Yet there are significant hurdles. First, the patchiness and mosaic character of D. maroccanus habitats makes it difficult to characterize them based on satellite data. A recent attempt to map Moroccan locust oviposition areas in S. Uzbekistan, based on vegetation density and using Landsat data, was only partially successful.120 To our knowledge, it is the only study that applied satellite data to the Moroccan locust’s habitat monitoring. Second, the short duration of the post-embryonic stages, which coincides with the development of ephemeral vegetation, limits the availability of the satellite data to a very narrow period of spring time. In Central Asia, where D. maroccanus is the most important economic pest, spring is characterized by a high percentage of cloudy days, which is a serious impediment for the use of earth-observing satellites in this season.120 Third, most breeding areas of the Moroccan locust are located at an altitudinal gradient from 400 to 1200 m, which requires special techniques and approaches in analyzing satellite data.121,122 To sum up, the remote sensing applications to the Moroccan locust habitat monitoring are just making their first and tentative steps, and the potential of this geospatial technology is yet to be tested for D. maroccanus. 5.5.Italian Locust, Calliptamus Italicus (Fig. 24)The Italian locust is a major agricultural pest in the dry grasslands of the countries of the former Soviet Union, particularly Kazakhstan, Russia, Uzbekistan, Kyrgyzstan and, to a lesser extent Afghanistan and Pakistan.32 Contrary to the migratory or Moroccan locusts, which exhibit relatively narrow ecological requirements, C. italicus is an ecologically plastic species that can occupy a wide range of habitats, such as overgrazed pastures, field edges, weedy fallows, etc.32 Its vast distribution range occupies temperate and subtropical Eurasia from Iberian Peninsula to Eastern Siberia (Fig. 25). In the northern and central parts of its range (e.g., forest-steppe of Kazakhstan and Russia), typical breeding areas are located in the forest-steppe transitional zone covered by herbaceous vegetation with a significant proportion of sagebrush (Artemisia spp.).123 At more southern latitudes (e.g., deserts of Uzbekistan and Afghanistan), its distribution is restricted to humid areas in agricultural oases.124 The areas that need to be surveyed on an annual basis cover tens of millions of hectares, primarily in Kazakhstan and Russia. During outbreaks, the infested areas can be extremely high: in 2000, over eight million hectares (almost equals to the entire area of South Carolina) were treated against C. italicus in Kazakhstan, which is the world record of treatment area of locust control campaign per country per year.29 While the native steppe vegetation harbors very sparse Italian locust populations, its densities increase sharply in the disturbed areas, such as overgrazed pastures, road and field edges, etc.32 (Fig. 26). In other words, the preferred habitats of the Italian locust are man-made. Often they appear in the abandoned crop fields, which become vegetated by weedy forbs including Artemisia spp.32 (Fig. 27). After the collapse of the Soviet Union in 1991, more than 12 million hectares of former grain crops were abandoned in Kazakhstan, providing favorable conditions for the Italian locust habitat. In Kazakhstan, it may take between 10 and 25 years until a fallow returns to its original (precrop) grassland state.125 During the entire period such areas are prone to C. italicus infestations.126 Fig. 26Italian locust habitat in Kazakhstan, an overgrazed pasture with Artemisia spp. Photo: A. Latchininsky.  The Italian locust can attack grains such as wheat, millet, and oats; it is also a serious pest of cotton, citrus, grapes, alfalfa, mulberry, potato, beet, sunflower, tobacco, walnut, vegetables, and fodder grasses.30 During outbreaks, damage from the Italian locust feeding can be quite substantial (see Sec. 2). As most other temperate locusts, C. italicus has a single generation per year. Females are known to oviposit in very dense clusters: the egg-pod density can reach 4,000 or even 10,000 per (Ref. 123), which is an absolute record for all locusts. After hatching hoppers form bands marching 200 m per day and up to four km during the entire hopper life; adult swarms fly up to 220 km (Ref. 123). Unlike D. maroccanus, the Italian locust’s development is not synchronized. It may take several weeks for all eggs from a site to hatch,127 and early-instar nymphs often co-exist with adults in the same population.32 Such an extended developmental pattern makes it challenging to choose the appropriate timing for ground surveys. Another problem consists in the fact that the locust’s broad habitat preferences become even broader during outbreaks.32 The locust becomes less restrictive in its choices of oviposition sites, which complicates tracking its infestations and significantly expands the area to be surveyed. The population dynamics of this species are not fully comprehended yet. Population increases are thought to be associated with dry and warm summers, which extend the oviposition period and egg production.8,32,123 However, the environmental conditions that trigger phase transformation in C. italicus are still poorly understood. Ground monitoring of the Italian locust presents two important challenges: extremely vast and very heterogeneous areas to survey and extended period of development. The latter results in a complex population structure causing problems in choosing the appropriate timing of control. Satellite information may be useful to address the first of the two challenges. From the remote sensing perspective, the identification of the Italian locust’s habitats is a two-step process. It consists of: (1) distinguishing fallows and other similar disturbed noncrop areas from active cropland, and (2) within those fallows, distinguishing sagebrush associations from non-Artemisia shrub cover. The first task can be accomplished through a time-series analysis of images of the same geographic area taken at different seasons or in a historical retrospective. Availability of reliable historical land use information is critical to accomplish this step. As for the second task—identification of sagebrush-based plant associations using satellite data—examples from North America demonstrated its feasibility in a similar semi-arid environment.128 Landscape heterogeneity adds complexity to the analyses of C. italicus habitats; nonetheless, first attempts of mapping the Italian locust’s habitats using remotely sensed data appeared to be promising.129,130 However, as of today, application of satellite data to the Italian locust monitoring is still in the initial research phase. 5.6.Red Locust, Nomadacris Septemfasciata (Fig. 28)The distribution range of the red locust Nomadacris septemfasciata (Serville, 1838) covers most of Africa south of the Sahara, Madagascar, Mauritius, and Reunion30 (Fig. 29). It inhabits treeless grasslands on seasonally flooded plains. The most important breeding areas of the red locust are located in NW Zambia, SW and central Tanzania, and SW Madagascar. Seasonal variations in flood levels result in a mosaic of tall grasses and sedges (Echinochloa, Hyparrhenia, and Cyperus spp.) with shorter grasses (Cynodon) and patches of open ground.8 There is only one generation per year. Females lay eggs at the beginning of the rainy season when most of the grassland is burned by the rural inhabitants. Eggs hatch in as few as 18 days. Hoppers tend to roost in taller grasses (Fig. 30). Nymphal development is rather long; it includes 6 to 8 hopper instars and lasts for about two months (although it is shorter in Madagascar). Adults appear between February and May. Gregarization increases during dry years when the vegetation becomes increasingly patchy, resulting in locust concentration in the remaining clumps of green grasses and sedges. After fledging, swarms fly out the breeding areas covering 20 to 30 km per day. Settled swarms roost in trees.8 Plagues of the red locust are not frequent, but in contrast to those of most other locusts, they can last quite long. For example, one serious plague lasted from 1930 to 1944. Damage is reported from 20 countries. The list of useful plants attacked includes over 50 species of crops.30 Although the invasion area of the red locust covers 8 million , the outbreak sources are restricted to only 0.1% of it. They are mostly located in Tanzania and Zambia.30 Therefore, to prevent the build-up of large-scale red locust outbreak it is necessary to closely monitor and if necessary, apply control to locust populations in these source areas. An International red Locust Control Organization funded by several central and south African countries is mandated to monitor and manage the locust. Monitoring is done mostly aerially from helicopters. If warranted, control treatments are also applied from aircraft. One particular source area is located on Iku Plains in Katavi National Park in SW Tanzania, which imposes additional restrictions on pesticide applications. Challenges in the red locust monitoring include difficult accessibility (particularly from the ground) to source outbreak areas which are scattered over a vast territory in several countries. Remote sensing may be a right tool to address these challenges. Locust oviposition usually occurs in freshly burnt grasslands, so locating such areas is the key to outbreak prevention. Satellite data is widely used worldwide to assess the extent of forest and grassland fires.132–134 This methodology can be applied to identify the red locust breeding habitats. However, to date, the only reported application of remote sensing to N. septemfasciata lies in a different domain and uses a historical analysis to elucidate the migration pathways of this locust in Madagascar.135 Until recently, red locust was a secondary locust pest on Madagascar, compared to L. m. capito confined to southwestern corner of the island.30 However, forest clearing and land development for agricultural purposes changed this situation. Comparing two high-resolution SPOT images taken 18 years apart, it was possible to calculate the areas of deforested zones which served as migration routes for red locust. The area of such “corridors” increased from 1986 to 2004 by 62% as a result of intensive deforestation. Using the newly cleared pathways, the red locust reached zones where it has never been recorded before and produced a spectacular outbreak in the early 2000s for the first time in Madagascar.135 As for continental Africa, which harbors the most important breeding areas of N. septemfasciata, remote sensing techniques to habitat monitoring have not been applied to date. To sum up, the use of satellite data in red locust monitoring, particularly in locating freshly burnt grassland areas, holds a promising potential which is yet to be explored. 5.7.Other LocustsThere are about half a dozen other economically important locust species in the world. At least three of them in our opinion are of interest in terms of application of remote sensing data to their ecology and habitat monitoring.
Economic importance, distinct habitat preferences, and solid baseline ecology knowledge make these three locusts suitable candidates for applied remote sensing studies. To our knowledge, such studies have not been attempted yet. Finally, there exist several other acridid species (e.g., Brazilian Rhammatocerus schistocercoides Rehn), which are considered borderline between grasshoppers and locusts,6,7 and which also may have a certain potential for remote sensing applications. 6.Locusts and Climate Change: What Is Happening and What to Expect?Insect responses to global climate change are a topic of numerous studies. As poikilothermal animals, insects are particularly sensitive to climate warming (see Ref. 136 and references therein). Their responses to increasing temperatures can be grouped into three major categories: (1) expansion of ranges, (2) shifts in phenology, and (3) acceleration of developmental rates. Each of these three responses is attributable to different grasshopper species, which were shown to expand their distribution range to the north,137 show earlier phenology compared to previous decades,138 and exhibit faster development both at embryonic139 and post-embryonic138,140 stages. For locusts, however, information on effects of global climate change is scarce, and, to our knowledge, deals exclusively with the Oriental migratory locust. Researchers analyzed a thousand years (957–1956) of records of locust outbreaks and weather in China and came to unexpected results: the outbreaks appeared to be associated with cold and wet, rather than hot and dry, periods141 and with drought/flood frequencies.142 When the span of analysis was extended to almost two thousand years, the negative association with temperature still held while that with precipitation became inconsistent, and more locusts were found in dry years.143 The authors concluded that global warming will be beneficial in terms of reducing the locust outbreak frequency,142 but in view of very inconsistent and even contradictory results of their studies, such prediction appears more a speculation. It also contradicts another Chinese study that found the locust outbreaks benefitting from higher temperatures, and thus would be more recurrent with global warming.98 As a side note, recent worldwide molecular studies on L. migratoria revealed a very complex genetic structure of its populations.144 In particular, it appears that contrary to traditional views, most of Central and Eastern China is inhabited not by the Oriental migratory locust L. m. migratoria but by the Asian migratory locust L. m. migratoria.145 However, to avoid confusion, we followed the conventional point of view on Chinese races of Locusta migratoria (Sec. 5.3.2). As limited as the existing data are, recent observations support the notion that certain locusts would benefit from recent climate changes, in particular from increasing temperatures. For example, the Moroccan locust in Turkmenistan in the past few years consistently breeds at much higher altitudes than 20 or more years ago.146 According to our observations, this holds true throughout Central Asia (Uzbekistan, Tajikistan, Turkmenistan, Kyrgyzstan), where the vertical limit of permanent breeding areas of this locust shifted up by 300 m on average. Phenology of the Moroccan locust appears to be more precocious, and development faster than in the 20th century.147 The Asian migratory locust responded to the increased thermal resources by starting to produce second annual generation in two separate geographic locations, Uzbekistan and Russia. This phenomenon was considered a rare anomaly in the 20th century and recorded in the literature as a single case in 1927.148 These (admittedly limited) observations indicate, however, that locusts are likely to expand their ranges and, at least for species of tropical origin, increase the rate of development and possibly the number of annual generations. If this is true, the role of remote sensing in tracking expanding locust habitats may also increase. This is particularly important for the mountainous areas which have limited access for ground scouts. 7.Conclusions. Remote Sensing in Locust Monitoring: a Panacea or Just Another Tool in the Box?As soon as the data from Earth-observing satellites became available for nonmilitary purposes, remote sensing became a hope for locust managers and forecasters worldwide. Indeed, over the last three decades, satellite imagery is increasingly applied to locust monitoring (Ref. 47 and references therein). After the pioneer studies by Pedgley44 and Hielkema,45,64 remote sensing has been used for finding and mapping emerging vegetation in the desert to help monitor and forecast the desert locust50,56,66,68,69 and the Australian plague locust.46,49,51,72–82 The tool allows assessing the ecological conditions favorable for locust survival, breeding, and gregarization. Identification of areas with emerging green vegetation helps in rapid decision-making regarding control interventions against the initial locust congregations.65 Based on the satellite imagery, locust management teams can target specific, high-risk locust gregarization sites. This significantly reduces the costs and contributes toward changing the paradigm of locust control from curative to preventive.14 However, despite an important progress in this direction, remote sensing alone cannot solve all locust problems, and the pest still can get out of control, as was illustrated by the desert locust upsurge 2003–2005.15,22,23,28 Furthermore, this tool is currently applied to the practice of locust monitoring and management to only two above-mentioned species, S. gregaria and Ch. terminifera and, to a very limited extent, to L. migratoria.90–95,101–104 Applications to other locusts range from scarce to nonexistent.47 Therefore, after a period of over-enthusiastic claims and views of the remote sensing as a panacea for solving locust problems, the research reports in the beginning of the 2000s sounded more cautious, if not skeptical.149,150 Yet the satellite data and associated GIS are believed to be very powerful instruments in the arsenal of locust managers, especially if accompanied by thorough ground work.47 With the advancement of our knowledge of the bio-ecology of different locust species and increasing availability of satellites and processing software, remote sensing is gradually making its way to become a routine and efficient tool in the practice of locust management, especially forecasting.50,51 Finally, the role of geospatial technologies may increase with locusts expanding their habitats, both latitudinal and altitudinal, because of the global climate change. AcknowledgmentsThe author thanks Dr. Ramesh Sivanpillai, University of Wyoming, and two anonymous reviewers for their thoughtful suggestions and constructive criticism which helped to improve the paper. ReferencesG. Kritsky,
“The insects and other arthropods of the Bible, the New Revised Version,”
Am. Entomol., 44
(3), 183
–188
(1997). AENUEN 1046-2821 Google Scholar
B. P. Uvarov,
“The Locust Plague,”
J. Econ. Entomol., 37
(1), 93
–99
(1944). JEENAI 0022-0493 Google Scholar
A. Steedman, Locust Handbook, 2nd Ed.Overseas Development Natural Resource Institute, London
(1988). Google Scholar
S. J. SimpsonG. A. Sword,
“Locusts,”
Curr. Biol., 18 R364
–366
(2008). http://dx.doi.org/10.1016/j.cub.2008.02.029 CUBLE2 0960-9822 Google Scholar
A. V. Latchininsky,
“Locusts,”
Encyclopedia of Animal Behavior, 288
–297 Academic Press, Oxford
(2010). Google Scholar
M. P. PenerS. J. Simpson,
“Locust phase polyphenism: an update,”
Adv. Insect Physiol., 36 1
–272
(2009). http://dx.doi.org/10.1016/S0065-2806(08)36001-9 AIPYAZ 0065-2806 Google Scholar
H. Song,
“Density-dependent phase polyphenism in nonmodel locusts: a minireview,”
Psyche, 2011 16
(2011). http://dx.doi.org/10.1155/2011/741769 PSYEDK 0033-2615 Google Scholar
B. P. Uvarov, Grasshoppers and Locusts: A Handbook of General Acridology, Behaviour, Ecology, Biogeography, Population Dynamics, COPR, London
(1977). Google Scholar
A. V. Latchininskyet al.,
“Locusts and grasshoppers: behavior, ecology and biogeography,”
Psyche, 2011 4
(2011). http://dx.doi.org/10.1155/2011/578327 PSYEDK 0033-2615 Google Scholar
S. K. GangwereM. C. MuraliranganM. Muralirangan, The Bionomics of Grasshoppers, Katydids and Their Kin, CAB International, Wallingford
(1997). Google Scholar
A. van Huis,
“Can we combat the desert locust successfully?,”
in Proc. Seminar Desert Locust Control with Existing Techniques, an Evaluation of Strategies, Wageningen, 1993,
11
–17
(1994). Google Scholar
A. van HuisK. CressmanJ. I. Magor,
“Preventing desert locust plagues: optimizing management interventions,”
Entomol. Exp. Appl., 122
(3), 191
–214
(2007). http://dx.doi.org/10.1111/eea.2007.122.issue-3 ETEAAT 0013-8703 Google Scholar
S. R. Joffe, Desert Locust Management, a Time for Change, World Bank, Washington, DC
(1995). Google Scholar
J. I. MagorM. LecoqD. M. Hunter,
“Preventive control and Desert Locust plagues,”
Crop Prot., 27
(12), 1527
–1533
(2008). http://dx.doi.org/10.1016/j.cropro.2008.08.006 CRPTD6 0261-2194 Google Scholar
P. Symmons,
“A critique of preventive control and desert locust plagues,”
Crop Prot., 28
(10), 905
–907
(2009). http://dx.doi.org/10.1016/j.cropro.2009.04.012 CRPTD6 0261-2194 Google Scholar
P. C. Matteson,
“A review of field studies of the environmental impacts of locust/grasshopper control programmes in Africa,”
in Proc. Biological Control of Locusts and Grasshoppers, International Institute of Tropical Agriculture, Cotonou, Republic of Benin, 29 April—1 May 1991,
347
–355
(1992). Google Scholar
R. Pevelinget al.,
“Environmental impact of the locust control agents fenitrothion, fenitrothion-esfenvalerate, and triflumuron on terrestrial arthropods in Madagascar,”
Crop Prot., 18
(10), 659
–676
(1999). http://dx.doi.org/10.1016/S0261-2194(99)00072-1 CRPTD6 0261-2194 Google Scholar
R. Peveling,
“Environmental conservation and locust control: possible conflicts and solutions,”
J. Orthoptera Res., 10
(2), 171
–187
(2001). http://dx.doi.org/10.1665/1082-6467(2001)010[0171:ECALCP]2.0.CO;2 1082-6467 Google Scholar
Environmental Side-Effects of Locust and Grasshopper Control, FAO and CERES/Locustox Foundation, Rome/Dakar
(2002). Google Scholar
W. C. Mullié,
“Monitoring Desert Locust control in Africa: the QUEST approach,”
in Proc. ANCAP/SETAC International Conference on Pesticide use in Developing Countries: Environmental Fate, Effects and Public Health Implications,
83
–84
(2006). Google Scholar
R. Peveling,
“We believe what we see—and vice versa: evidence versus perception in locust control,”
J. Orthoptera Res., 14
(2), 207
–212
(2005). http://dx.doi.org/10.1665/1082-6467(2005)14[207:WBWWSV]2.0.CO;2 1082-6467 Google Scholar
M. Lecoq,
“Desert locust management: from ecology to anthropology,”
J. Orthoptera Res., 14
(2), 179
–186
(2005). http://dx.doi.org/10.1665/1082-6467(2005)14[179:DLMFET]2.0.CO;2 1082-6467 Google Scholar
W. J. Lewiset al.,
“A total system approach to sustainable pest management,”
PNAS, 94
(23), 12243
–12248
(1997). http://dx.doi.org/10.1073/pnas.94.23.12243 PNASA6 0027-8424 Google Scholar
Save and grow. A policymaker’s guide to the sustainable intensification of smallholder crop production, FAO, FAO, Rome
(2011). Google Scholar
F. T. Bullen,
“A review of the assessment of crop losses caused by locusts and grasshoppers,”
in Proc. Int. Study Conf. of Current and Future Problems of Acridology,
163
–171
(1970). Google Scholar
A. WewetzerS. KrallF. A. Schulz, Methods of the assessment of crop losses due to grasshoppers and locusts, GTZ, Eschborn
(1993). Google Scholar
CABI in BBC news, “Plant pests: the biggest threats to food security?,”
(2012) http://www.bbc.co.uk/news/science-environment-15623490 December ). 2012). Google Scholar
L. BraderH. DjiboF. G. Faye,
“Towards a more effective response to desert locusts and their impacts on food insecurity, livelihoods and poverty,”
in Proc. Independent Multilateral Evaluation of the 2003–2005 Desert Locust Campaign,
(2006). Google Scholar
S. S. Khasenov,
“Locust problem in Kazakhstan,”
Plant Protection and Quarantine in Kazakhstan, 2
–6 2001). Google Scholar
The Locust and Grasshopper Agricultural Manual, COPR, Centre for Overseas Pest Research, London
(1982). Google Scholar
, “Locust watch CCA,”
(2012) http://www.fao.org/ag/locusts-CCA/en/index.html December ). 2012). Google Scholar
A. V. Latchininskyet al.,
“Acridids of Kazakhstan, Central Asia and adjacent territories,”
Association for Applied Acridology International, University of Wyoming, Laramie, WY
(2002). Google Scholar
Y.-l. Chen, The Locust and Grasshopper Pests of China, China Forestry Publishing House, Beijing
(1999). Google Scholar
B. P. Uvarov, Locusts and Grasshoppers. A Handbook for Their Study and Control, Imperial Bureau of Entomology, London
(1928). Google Scholar
D. K. M. Kevan,
“Transatlantic travelers,”
Antenna, 13 12
–15
(1989). IAPSBG Google Scholar
M. RitchieD. E. Pedgley,
“Desert locusts cross the Atlantic,”
Antenna, 13 10
–12
(1989). IAPSBG Google Scholar
J.-F. DurantonM. Lecoq,
“Le Criquet Pèlerin au Sahel,”
(1990). Google Scholar
A. V. LatchininskyM. H. Launois-Luong,
“Le Criquet marocain, Dociostaurus maroccanus (Thunberg, 1815), dans la partie orientale de son aire de distribution. Etude monographique relative à l’ex-URSS et aux pays proches,”
St. Petersburg, Russia
(1992). Google Scholar
A. V. Latchininsky,
“Moroccan locust Dociostaurus maroccanus (Thunberg, 1815): a faunistic rarity or an important economic pest?,”
J. Insect Conservation, 2 167
–178
(1998). http://dx.doi.org/10.1023/A:1009639628627 1366-638X Google Scholar
, “Locust Watch CCA,”
(2012) http://www.fao.org/ag/locusts-CCA/common/ecg/1125/en/Report_TechWorkshop2011_ENG_2010_12_19.pdf December ). 2012). Google Scholar
J. A. LockwoodA. T. ShowlerA. V. Latchininsky,
“Can we make locust and grasshopper management sustainable?,”
J. Orthoptera Res., 10
(2), 315
–329
(2001). http://dx.doi.org/10.1665/1082-6467(2001)010[0315:CWMLAG]2.0.CO;2 1082-6467 Google Scholar
, “Locust Watch CCA,”
(2012) http://www.fao.org/ag/locusts-CCA/common/ecg/1121/en/Report_TechWorkshop_ENG_rev.pdf December ). 2012). Google Scholar
A. V. Latchininsky,
“Emergency program for the control of locust outbreaks. Kazakhstan. TCP/KAZ/0065(E),”
(2000). Google Scholar
D. E. Pedgley,
“ERTS surveys a locust breeding site in Saudi Arabia,”
in Proc. 3rd Earth Resources Technology Satellite – Symposium (December 1973),
233
–246
(1974). Google Scholar
J. U. Hielkema,
“Desert locust habitat monitoring with satellite remote sensing: a new technology for an old problem,”
ITC J., 4 387
–417
(1981). ITCJDP 0303-2434 Google Scholar
L. McCullochD. M. Hunter,
“Identification and monitoring of Australian plague locust habitats from Landsat,”
Remote Sens. Environ., 13
(2), 95
–102
(1983). http://dx.doi.org/10.1016/0034-4257(83)90015-9 RSEEA7 0034-4257 Google Scholar
A. V. LatchininskyR. Sivanpillai,
“Locust habitat monitoring and risk assessment using remote sensing and GIS technologies,”
Integrated Management of Arthropod Pests and Insect Borne Diseases, Integrated Management of Plant Pests and Diseases, 163
–188 Springer Science+Business Media B.V., Dordrecht, Heidelberg, London, New York
(2010). Google Scholar
FAO UN, Desert Locust Information Service (DLIS),
(2012) http://www.fao.org/ag/locusts/en/activ/DLIS/satel/index.html December ). 2012). Google Scholar
T. DevesonD. M. Hunter,
“The operation of a GIS-based decision support system for Australian locust management,”
Entomologia Sinica, 9
(4), 1
–12
(2002). 1005-295X Google Scholar
K. Cressman,
“Satellites and GIS in desert locust monitoring worldwide: lessons learned,”
in Proc. 7th Int. IPM Symposium March 27–29, 2012,
(2012). Google Scholar
T. DevesonH. Wang,
“GIS and Remote Sensing data use in forecasting, monitoring and managing locusts in Australia,”
in Proc. 7th Int. IPM Symposium March 27–29, 2012,
(2012). Google Scholar
P. M. SymmonsK. Cressman, Desert Locust Guidelines. Vol. 1. Biology and behavior, FAO, Rome
(2001). Google Scholar
N. D. Jago,
“The 1985–1989 grasshopper/locust upsurge in Sub-Saharan Africa: the usage of conventional pesticides and equipment,”
Bol. San. Veg. Plagas (Fuera de serie), 20 11
–20
(1990). Google Scholar
R. SkafG. B. PopovJ. Roffey,
“The desert locust: an international challenge,”
Phil. Trans. R Soc. Lond. B, 328
(1251), 525
–538
(1990). http://dx.doi.org/10.1098/rstb.1990.0125 PTRBAE 0962-8436 Google Scholar
Y. T. Belayneh,
“Acridid pest management in the developing world: a challenge to the rural population, a dilemma to the international community,”
J. Orthoptera Res., 14
(2), 187
–195
(2005). http://dx.doi.org/10.1665/1082-6467(2005)14[187:APMITD]2.0.CO;2 1082-6467 Google Scholar
K. Cressman,
“The role of remote sensing in Desert Locust early warning,”
J. Appl. Remote Sens.,
(2013). 1931-3195 Google Scholar
N. Baghdadiet al.,
“Operational mapping of soil moisture using synthetic aperture radar: application to the Touch Basin (France),”
Sensors, 7
(10), 2458
–2483
(2007). http://dx.doi.org/10.3390/s7102458 SNSRES 0746-9462 Google Scholar
F. Baupet al.,
“Surface soil moisture estimation over the AMMA Sahelian site in Mali using ENVISAT/ASAR data,”
Remote Sens. Environ., 109
(4), 473
–481
(2007). http://dx.doi.org/10.1016/j.rse.2007.01.015 RSEEA7 0034-4257 Google Scholar
D. G. BlumbergV. Freilikher,
“Soil water-content and surface roughness retrieval using ERS-2 SAR data in the Negev Desert, Israel,”
J. Arid Environ., 49
(3), 449
–464
(2001). http://dx.doi.org/10.1006/jare.2001.0809 JAENDR 0140-1963 Google Scholar
I. A. LuntS. S. HubbardY. Rubin,
“Soil moisture content estimation using ground-penetrating radar reflection data,”
J. Hydrol., 307
(1–4), 254
–269
(2005). http://dx.doi.org/10.1016/j.jhydrol.2004.10.014 JHYDA7 0022-1694 Google Scholar
J. Roffey,
“Report on radar studies on the desert locust, Schistocerca gregaria (Forskål) in the Niger Republic (September-October 1968),”
(1969). Google Scholar
J. R. RileyD. R. Reynolds,
“Vertical-looking radar as a means to improve forecasting and control of desert locusts,”
New Strategies in Locust Control, 47
–54 Birkhauser Verlag, Basel, Switzerland
(1997). Google Scholar
J. R. Riley,
“Remote sensing in entomology,”
Ann. Rev. Entomol., 34 247
–271
(1989). http://dx.doi.org/10.1146/annurev.en.34.010189.001335 ARENAA 0066-4170 Google Scholar
J. U. HielkemaF. L. Snijders,
“Operational use of environmental satellite remote sensing and satellite communications technology for global food security and locust control by FAO: The ARTEMIS and DIANA systems,”
Acta Astronautica, 32 603
–616
(1994). http://dx.doi.org/10.1016/0094-5765(94)90071-X AASTCF 0094-5765 Google Scholar
M. A. Babah Ebbe, Biogéographie du Criquet pèlerin en Mauritanie, Hermann, Paris(2010). Google Scholar
K. Cressman,
“Current methods of Desert Locust forecasting at FAO,”
OEPP/EPPO Bulletin, 26
(3–4), 577
–585
(1996). http://dx.doi.org/10.1111/j.1365-2338.1996.tb01500.x 0250-8052 Google Scholar
R. T. Pinkeret al.,
“Diurnal and season variability of rainfall in the sub-Sahel as seen from observations, satellites and a numerical model,”
Geophys. Res. Lett., 33
(7), 2073
(2006). http://dx.doi.org/10.1029/2005GL025192 GPRLAJ 0094-8276 Google Scholar
T. Dinkuet al.,
“Evaluating detection skills of satellite rainfall estimates over desert locust recession areas,”
J. App. Meteorol. Climatol., 49
(6), 1322
–1332
(2010). Google Scholar
J. F. Pekelet al.,
“Development and application of multi-temporal colorimetric transformation to monitor vegetation in the desert locust habitat,”
IEEE J. Sel. Top. Appl. Earth Observ. Remote Sens., 4
(2), 318
–326
(2011). http://dx.doi.org/10.1109/JSTARS.2010.2052591 1939-1404 Google Scholar
, “History of locust and grasshopper outbreaks in Australia,”
(2013) http://www.daff.gov.au/animal-plant-health/locusts/about/history#australian January ). 2013). Google Scholar
J. I. Magor,
“Outbreaks of the Australian plague locust (Chortoicetes terminifera Walk.) in New South Wales during the period 1937–1962 particularly in relation to rainfall,”
Anti-Locust Memoir, ALRC, London
(1970). Google Scholar
K. P. Bryceson,
“Discrimination of small areas of vegetation growth after localised rain in semiarid environments using Landsat,”
in Proc. of the 3rd Australian Remote Sensing Conf.,
541
–550
(1984). Google Scholar
K. P. BrycesonD. E. Wright,
“An analysis of the 1984 locust plague in Australia using multitemporal Landsat multispectral data and a simulation model of locust development,”
Agr. Ecosyst. Environ., 16
(2), 87
–102
(1986). http://dx.doi.org/10.1016/0167-8809(86)90096-4 AEENDO 0167-8809 Google Scholar
K. P. Bryceson,
“The use of Landsat MSS data to determine the distribution of locust eggbeds in the Riverina region of New South Wales, Australia,”
Int. J. Remote Sens., 10
(11), 1749
–1762
(1989). http://dx.doi.org/10.1080/01431168908904005 IJSEDK 0143-1161 Google Scholar
K. P. Bryceson,
“Digitally processed satellite data as a tool in detecting potential Australian plague locust outbreak areas,”
J. Environ. Manag., 30
(3), 191
–207
(1990). http://dx.doi.org/10.1016/0301-4797(90)90001-D JEVMAW 0301-4797 Google Scholar
K. P. Bryceson,
“Likely locust infestation areas in western New South Wales, Australia, located by satellite,”
Geocarta Int., 6
(4), 21
–37
(1991). http://dx.doi.org/10.1080/10106049109354337 1010-6049 Google Scholar
K. P. BrycesonR. Cannon,
“Acquisition and use of low-cost meteorological satellite data in the Australian Plague Locust Commission,”
Comput. Electron. Agr., 5
(1), 47
–64
(1990). http://dx.doi.org/10.1016/0168-1699(90)90047-S CEAGE6 0168-1699 Google Scholar
K. P. Bryceson,
“The Australian Plague Locust Commission’s weather satellite receiving system,”
Pest Control and Sustainable Agriculture, 440
–443 CSIRO, Melbourne
(1993). Google Scholar
K.P. BrycesonD. M. HunterJ. G. Hamilton,
“Use of remotely sensed data in the Australian Plague Locust Commission,”
Pest Control and Sustainable Agriculture, 435
–439 CSIRO, Melbourne
(1993). Google Scholar
J. G. HamiltonK. P. Bryceson,
“Use of enhanced GMS weather satellite data in locust forecasting,”
Pest Control and Sustainable Agriculture, 444
–448 CSIRO, Melbourne
(1993). Google Scholar
L. McCullochE. BieP. A. Spurgin,
“A prototype decision support system model for control of the Australian plague locust,”
FAO Plant Protect. Bull., 41
(3–4), 171
–176
(1994). FAOPA2 Google Scholar
T. Deveson,
“Decision support for locust management using GIS to integrate multiple information sources,”
NSW Agriculture, 361
–374
(2001). Google Scholar
V. A. DrakeI. T. HarmanD. M. Hunter,
“Monitoring locust migratory flight with radar: an Australian study,”
in Proc. 2nd Urban Environment Symposium & 13th Conf. on Biometeorology and Aerobiology,
313
–316
(1998). Google Scholar
V. A. Drakeet al.,
“Characterizing insect migration systems in inland Australia with novel and traditional methodologies,”
in Proc. Royal Entomological Society’s 20th Symposium on Insect Movement: Mechanisms and Consequences,
207
–234
(2001). Google Scholar
E. D. Devesonet al.,
“Evidence from traditional and new technologies for northward migrations of Australian plague locusts (Chorticetes terminifera) (Walker) (Orthoptera: Acrididae) to western Queensland,”
Aust. Ecol., 30 928
–943
(2005). http://dx.doi.org/10.1111/aec.2005.30.issue-8 AJECDQ 1442-9993 Google Scholar
E. P. Tsyplenkov, Injurious Acridid Pests of the USSR, Kolos Publishers, Leningrad
(1970). Google Scholar
V. Y. Novitsky,
“Ecological conditions of the permanent breeding area of the Asian migratory locust in the Amudarya delta,”
Entomologicheskoe Obozrenie, 42 252
–263
(1963). ETOBAE 0367-1445 Google Scholar
F. A. GapparovA. V. Latchininsky,
“What are the consequences of ecosystem disruption on acridid diversity and abundance?,”
Grasshoppers and Grassland Health, 31
–59 Kluwer Academic Publishers, Dordrecht/Boston/London
(2000). Google Scholar
G. S. ShamuratovA. V. Latchininsky,
“Migratory locust in the Amudarya delta,”
Principal Agricultural Insect Pests in Karakalpakia, 6
–7 Karakalpakstan, Nukus(in Russian).Google Scholar
R. Sivanpillaiet al.,
“Mapping locust habitats in River Ili Delta, Kazakhstan, using Landsat imagery,”
Agr. Ecosyst. Environ., 117
(2–3), 128
–134
(2006). http://dx.doi.org/10.1016/j.agee.2006.03.028 AEENDO 0167-8809 Google Scholar
R. SivanpillaiA. V. Latchininsky,
“Mapping locust habitats in Amudarya River Delta, Uzbekistan with multi-temporal MODIS imagery,”
Environ. Manag., 39
(36), 876
–886
(2007). http://dx.doi.org/10.1007/s00267-006-0193-y EMNGDC 1432-1009 Google Scholar
P. Navratil,
“Object based locust habitat mapping using very high resolution satellite data in the southern Aral Sea Basin, Uzbekistan,”
University of Regensburg,
(2007). Google Scholar
A. V. Latchininskyet al.,
“Can early season Landsat image improve locust habitat monitoring in the Amudarya River Delta, Uzbekistan?,”
J. Orthoptrea Res., 16 167
–173
(2007). http://dx.doi.org/10.1665/1082-6467(2007)16[167:CESLII]2.0.CO;2 1082-6467 Google Scholar
R. SivanpillaiA. V. Latchininsky,
“Can late summer Landsat data be used for mapping Asian migratory locust, Locusta migratoria, oviposition sites in the Amudarya River delta, Uzbekistan?,”
Entomol. Exp. Appl., 128 346
–353
(2008). http://dx.doi.org/10.1111/eea.2008.128.issue-2 ETEAAT 0013-8703 Google Scholar
P. Propastin,
“Multisensor monitoring system for assessment of locust hazard risk in the Lake Balkhash drainage basin,”
Environ. Manag., 50
(6), 1234
–1246
(2012). http://dx.doi.org/10.1007/s00267-012-9950-2 JEVMAW 0301-4797 Google Scholar
E. P. Tsyplenkov,
“Area of mass breeding of Locusta migratoria L. in western China,”
Zoologicheskiy Zhurnal, 39
(6), 867
–878
(1959). Google Scholar
R.-l. Wang,
“Occurrence of Oriental Migratory locust and its trend’s analysis,”
in Proc. National Conf. on Forecast of Insects and Pests,
(1986). Google Scholar
G. YuH. ShenJ. Liu,
“Impacts of climate change on historical locust outbreaks in China,”
J. Geophys. Res., 114
(D18), D18104
(2009). http://dx.doi.org/10.1029/2009JD011833 JGREA2 0148-0227 Google Scholar
T. Chi,
“An analysis of the historical records of locust outbreaks in China,”
Chinese J. Agr. Res., 1 57
–66
(1950). Google Scholar
C. Chun-tehQ. FuChu-yun,
“Food specialization and food utilization of the Oriental migratory locust and the influence of different food plants on its growth and fecundity,”
Acta ent. sin., 7
(2), 143
–146
(1957). Google Scholar
Y. Zhaet al.,
“Temporal filtering of successive MODIS data in monitoring a locust outbreak,”
Int. J. Remote Sens., 26
(24), 5665
–5674
(2005). http://dx.doi.org/10.1080/01431160500196349 IJSEDK 0143-1161 Google Scholar
R. Jiet al.,
“Use of MODIS data to monitor the oriental migratory locust plague,”
Agr. Ecosyst. Environ., 104
(3), 615
–620
(2004). http://dx.doi.org/10.1016/j.agee.2004.01.041 AEENDO 0167-8809 Google Scholar
J. Maet al.,
“Monitoring East Asian migratory locust plagues using remote sensing data and field investigations,”
Int. J. Remote Sens., 26
(3), 629
–634
(2005). http://dx.doi.org/10.1080/01431160310001595019 IJSEDK 0143-1161 Google Scholar
H. D. Tianet al.,
“Using multi-temporal Landsat ETM+ data to monitor the plague of oriental migratory locust,”
Int. J. Remote Sens., 29
(6), 1685
–1692
(2008). http://dx.doi.org/10.1080/01431160701250424 IJSEDK 0143-1161 Google Scholar
D. Wintrebert,
“Identité, écologie et comportement du criquet migrateur dans le sud-ouest Malgache,”
Annales soc. ent. Fr. (N. S.), 6 35
–152
(1970). Google Scholar
J. P. Têtefort,
“Les sauterelles migratrices et les recherché acridiennes à Madagascar,”
Bull. Madagascar, 280–281 31
(1969). Google Scholar
J. P. TêtefortD. Wintrebert,
“Elements d’acridologie pratique à Madagascar,”
Agr. Trop., Nogent, 18 876
–932
(1963). Google Scholar
B. N. Zolotarevsky,
“Le criquet migrateur à Madagascar,”
Annales Epiphyt., 15
(4), 185
–236
(1930). Google Scholar
V. Razafindranaivo,
“Studies on the nymphal aggregation pheromone of Malagasy Migratory Locust, Locusta migratoria capito (Saussure, 1884) and its effects on adult maturation,”
Jomo Kenyatta University of Agriculture and Technology,
(2010). Google Scholar
R. Pevelinget al.,
“Impact of locust control on harvester termites and endemic vertebrate predators in Madagascar,”
J. Appl. Ecol., 40
(4), 729
–741
(2003). http://dx.doi.org/10.1046/j.1365-2664.2003.00833.x JAPEAI 1365-2664 Google Scholar
IRIN website, “Madagascar: fears of another locust plague,”
(2013) http://www.irinnews.org/Report/90439/MADAGASCAR-Fears-of-another-locust-plague January ). 2013). Google Scholar
A. Francet al.,
“Using remote sensing to improve the evaluation of the Malagasy migratory locust risk Locusta migratoria capito (Saussure, 1884), Orthoptera: Acrididae,”
Metaleptea, 39 2005). Google Scholar
T. Tokgaev, Fauna and Ecology of Acridids in Turkmenia, YlymAshkhabad,1973). Google Scholar
A. A. Safarov,
“Population dynamics and methods of survey of the Moroccan locust,”
in Proc. All-Union Institute for Plant Protection Acridids—Ecology and Control Methods,
22
–25
(1987). Google Scholar
E. M. Shumakov,
“Acridoidea of Afghanistan and Iran,”
Trudy Vsesoyuznogo Entomol. Obstchestva, 49 3
–248
(1963). Google Scholar
F. A. Gapparov,
“Biological foundation of locust control in Uzbekistan,”
All-Union Institute for Plant Protection (VIZR),
(1988). Google Scholar
F. A. GapparovA. V. LatchininskyM. G. Sergeev,
“Moroccan locust outbreaks in Central Asia,”
Plant Protect. Quarant., 3 22
–25
(2008). Google Scholar
A. V. LatchininskyF. A. Gapparov,
“Locust problem in Central Asia,”
in Proc. Int. Conf. on Fundamental Problems of Entomology in XXI Century,
30
(2011). Google Scholar
, “Locust Watch in Caucasus and Central Asia,”
(2013) http://www.fao.org/ag/locusts-CCA/en/1011/1074/index.html January ). 2013). Google Scholar
J. L. Smith,
“Application of remote sensing to Moroccan locust (Dociostaurus maroccanus Thunberg, 1815) habitat in southern Uzbekistan,”
University of Wyoming,
(2012). Google Scholar
D. J. WeissS. J. Walsh,
“Remote sensing of mountain environments,”
Geogr. Compass, 3
(1), 1
–21
(2009). http://dx.doi.org/10.1111/geco.2009.3.issue-1 1749-8198 Google Scholar
T. Podobnikar,
“Detecting mountain peaks and delineating their shapes using digital elevation models, remote sensing and geographic information systems using autometric methodological procedures,”
Remote Sens., 4
(12), 784
–809
(2012). http://dx.doi.org/10.3390/rs4030784 17LUAF 2072-4292 Google Scholar
K. A. Vasil’ev,
“Italian locust (Calliptamus italicus) in Central Kazakhstan,”
in Proc. All-Union Institute for Plant Protection,
123
–190
(1962). Google Scholar
S. N. Lepeshkin,
“Geo-botanical conditions of habitat of Calliptamus italicus L. and the distribution of its egg-beds in the Zeravshan Oasis,”
Works of the Locust Expedition of Uzbek Plant Protection Station, 10
–93 UzoSTAZR, Tashkent
(1931). Google Scholar
V. E. KambulinS. YskakK. M. Toleubaev,
“Locust population dynamics in Kazakhstan,”
Plant Protect. Quarant., 4 17
–20
(2010). Google Scholar
I. A. Chetyrkina,
“Italian locust (Calliptamus italicus L.) in Eastern Kazakhstan,”
Proc. All-Union Entomol. Soc., 46 5
–67
(1958). Google Scholar
I. L. Safarova,
“On the embryonic development of the Italian locust,”
in Proc. All-Union Institute for Plant Protection Acridids: Ecology and Control Methods,
75
–83
(1987). Google Scholar
R. SivanpillaiS. D. PragerT. O. Storey,
“Estimating sagebrush cover in semi-arid environments using Landsat data,”
Int. J. Appl. Earth Observ. Geoinform., 11
(2), 102
–106
(2009). http://dx.doi.org/10.1016/j.jag.2008.10.001 0303-2434 Google Scholar
R. Sivanpillaiet al.,
“Utility of the IRS-AWiFS Data to map the potential Italian locust (Calliptamus italicus) habitats in northeast Kazakhstan,”
in Proc. SPRS Ann. Conf.,
Google Scholar
V. I. Gornyyet al.,
“Measuring approach of satellite locust monitoring,”
J. Earth Sci. Eng., 1
(2), 126
–131
(2011). Google Scholar
K. CressmanH. M. Dobson, Desert Locust Guidelines, FAO, Rome
(2001). Google Scholar
L. B. Lentileet al.,
“Remote sensing techniques to assess active fire characteristics and post-fire effects,”
Int. J. Wildland Fire, 15
(3), 319
–345
(2006). http://dx.doi.org/10.1071/WF05097 IJWFEA 1049-8001 Google Scholar
M. Dubininet al.,
“Reconstructing long time series of burned areas in arid grasslands of southern Russia by satellite remote sensing,”
Remote Sens. Environ., 114
(8), 1638
–1648
(2010). http://dx.doi.org/10.1016/j.rse.2010.02.010 RSEEA7 0034-4257 Google Scholar
Remote Sensing and Modeling Applications to Wild Fires, Springer-Tsinghua University Press, Dordrecht
(2013). Google Scholar
A. Franc,
“Impact des transformations mésologiques sur la dynamique des populations et la grégarisation du criquet nomade dans le bassin de la Sofia (Madagascar),”
University Montpellier III—Paul Valéry,
(2007). Google Scholar
K. GuoO. J. SunL. Kang,
“The responses of insects to global warming,”
Recent Advances in Entomological Research. From Molecular Biology to Pest Management, 201
–212 Springer-Verlag, Berlin Heidelberg
(2012). Google Scholar
O. OlfertR. M. WeissD. Kriticos,
“Application of general circulation models to assess the potential impact of climate change on potential distribution and relative abundance of Melanoplus sanguinipes (Fabricius) (Orthoptera: Acrididae) in North America,”
Psyche, 2011 980372
(2011). http://dx.doi.org/10.1155/2011/980372 PSYEDK 0033-2615 Google Scholar
K. Guoet al.,
“Differential responses to warming and increased precipitation among three contrasting grasshopper species,”
Global Change Biol., 15
(10), 2539
–2548
(2009). http://dx.doi.org/10.1111/j.1365-2486.2009.01861.x 1354-1013 Google Scholar
D. J. FieldingL. S. Defoliarte,
“Embryonic developmental rates of northern grasshoppers (orthoptera: Acrididae): implications for climate change and habitat management,”
Environ. Entomol., 39
(5), 1643
–1651
(2010). http://dx.doi.org/10.1603/EN09356 EVETBX Google Scholar
T. Wuet al.,
“Specificity responses of grasshoppers in temperate grasslands to diel asymmetric warming,”
PLoS ONE, 7
(7), e41764
(2012). http://dx.doi.org/10.1371/journal.pone.0041764 1932-6203 Google Scholar
L. C. Stigeet al.,
“Thousand-year-long Chinese time series reveals climatic forcing of decadal locust dynamics,”
PNAS, 104
(41), 16188
–16193
(2007). http://dx.doi.org/10.1073/pnas.0706813104 PNASA6 0027-8424 Google Scholar
Z. Zhanget al.,
“Periodic temperature-associated drought/flood drives locust plagues in China,”
Proc. Biol. Sci., 276
(1658), 823
–831
(2009). Google Scholar
H. Tianet al.,
“Reconstruction of a 1,910-y-long locust series reveals consistent associations with climate fluctuations in China,”
PNAS, 108
(35), 14521
–14526
(2011). http://dx.doi.org/10.1073/pnas.1100189108 PNASA6 0027-8424 Google Scholar
M. P. Chapuiset al.,
“Do outbreaks affect genetic population structure? A worldwide survey in Locusta migratoria, a pest plagued by microsatellite null alleles,”
Mol. Ecol., 17 3640
–3653
(2008). http://dx.doi.org/10.1111/mec.2008.17.issue-16 MOECEO 1365-294X Google Scholar
D. X. Zhanget al.,
“Unexpected relationships of substructured populations in Chinese Locusta migratoria,”
BMC Evol. Biol., 9
(144), 12
(2009). http://dx.doi.org/10.1186/1471-2148-9-144 BEBMCG 1471-2148 Google Scholar
E. O. Kokanowa,
“Dynamics of the breeding areas of the Moroccan locust (Dociostaurus maroccanus Thunberg, 1815) in Turkmenistan,”
in Proc. Int. Scientific Conf. Turkmen Science on the Way of Renaissance and International Relations,
535
–548 Google Scholar
F. A. GapparovN. K. TuflievB. Yusupova,
“Population dynamics of the Moroccan locust (Dociostaurus maroccanus Thunb.) in Central Asia,”
in Proc. Int. Conf. Fundamental Problems of Entomology in XXI Century,
31 Google Scholar
A. M. FranciN. N. Diukov,
“The fall generation of Locusta migratoria L. in Dagestan in 1927,”
Bull. Plant. Prot. Entomol., 1
(1), 179
–189
(1930). Google Scholar
E. DesplandJ. RosenbergS. J. Simpson,
“Landscape structure and locust swarming: a satellite’s eye view,”
Ecography, 27
(3), 381
–391
(2004). http://dx.doi.org/10.1111/eco.2004.27.issue-3 ECOGEG 0906-7590 Google Scholar
J. A. TratalosR. A. Cheke,
“Can NDVI GAC imagery be used to monitor desert locust breeding areas?,”
J. Arid Environ., 64
(2), 342
–356
(2006). http://dx.doi.org/10.1016/j.jaridenv.2005.05.004 JAENDR 0140-1963 Google Scholar
Biography Alexandre V. Latchininsky received his BS and MS in entomology at St. Petersburg State University in Russia, and PhD in entomology at the University of Wyoming, USA. He currently works as associate professor/extension entomologist in the Department of Ecosystem Science and Management, University of Wyoming. Author of over 30 peer-reviewed papers and 7 books and book chapters on biology, ecology and management of grasshoppers and locusts. He is president of the U.S. National Grasshopper Management Board and an International Consultant—locust expert at the Food and Agriculture Organization of the United Nations (FAO). He has been featured on “Discovery Channel” and “History Channel” shows on locusts. |