
|
|
1.IntroductionNitrogen dioxide () is an important trace gas in both the troposphere and the stratosphere and plays an important role in atmospheric chemistry. As described by Martin et al.,1 the columns are approximately linearly related to emissions. Nitrogen oxides () take part in the catalytic destruction of ozone in the stratosphere.2,3 can react with to form the nitrate radical , which is a strong oxidant and this influences nighttime chemistry.4 Nitric acid is produced by the daytime reaction of with the OH radical or by nighttime formation of followed by hydrolysis on aerosols.5 Moreover, may also play a significant role in radiative forcing of the atmosphere.6,7 The sources and sinks of are distributed nonuniformly over the Earth’s surface, both spatially and temporally.8 The abundance of in the troposphere is highly variable and influenced by both anthropogenic and natural emissions. On a global scale, the major sources of are fossil fuel combustion, biomass burning, lightning, and soil microbial production.9 It is estimated that more than half of the total emissions are anthropogenic, dominated by the burning of fossil fuels for transportation and industrial activities.9 Anthropogenic is mainly concentrated in North America, Europe, and east Asia.10 An increase in global emissions of is expected over 2000 to 2020 with most of this increase from Asia. More than 90% of the tropospheric is believed to be emitted into continental air.6 Satellites provide a powerful tool for the measurement of trace gas emission. Data from the Global Ozone Monitoring Experiment (GOME, launched in 1995) has successfully been used to analyze the general features of the global distribution of tropospheric .11–14 More recently, improved satellite instruments have been deployed, e.g., the Scanning Imaging Absorption Spectrometer for Atmospheric Chartography (SCIAMACHY, launched in 2002),15 which has been used to study the trends, seasonal variability, and dominant sources over the globe,16 the GOME-2 (launched in 2006) and Ozone Monitoring Instrument (OMI, launched in 2004) with better spatial and temporal resolution. OMI’s spatial resolution () is finer than GOME (), GOME-2 (), and SCIAMACHY ().17,18 Its daily global coverage is an improvement over that of GOME and SCIAMACHY which can provide global coverage at intervals of 3 and 6 days, respectively. Therefore, OMI is a better data source for the study of atmospheric . Several pieces of research work have validated the OMI column densities using ground-based measurements and have been used to analyze the characteristics of tropospheric .17–21 This investigation of the similarities and differences between tropospheric and total column in terms of their global distribution and seasonal variations will provide further understanding about the global distribution of . In particular, the ratios of tropospheric to total column can reflect the contribution of anthropogenic emissions of , which may help us to understand the regional and global acid deposition, distribution of nitrate aerosols, and the potential influence on climate change. In this article, we focus on the variations of tropospheric and total column over the globe, and their intercorrelation. Finally, we focus on the characteristics of three typical regions of northern America, western and southern Europe, and eastern Asia (EAS), which are the regions of largest anthropogenic emissions. 2.OMI Columns DatasetThe column products retrieved from OMI (OMNO2e version 3) are used to investigate the tropospheric and total column distribution and its variability at a global scale. The OMI instrument onboard the Aura satellite provides the capability for global measurement of atmospheric column amounts. The satellite was launched in July 2004, follows in a near-polar, sun-synchronous orbit with a 13:45 local time equator crossing time, and is equipped with 740 bands (270 to 500 nm) hyperspectral imaging grating spectrometer in push broom mode. The pixel resolution is at nadir and off nadir at the two ends of the track. On occasions, a resolution will be set in local mode to detect and track urban-scale pollution sources. In the global observation mode, the total 60 measurements covering a swath of 2600 km can provide daily global coverage. The OMNO2e data product contains total column and tropospheric column , and the data format is HDF-EOS 5.1 with a spatial resolution of . We obtained the data from NASA Goddard Earth Science DISC (Data and Information Services Center). In order to analyze the temporal and spatial variation of , the data was averaged on monthly, multiyear seasonal and global scale. 3.Results and Discussions3.1.Temporal Variations of Global Monthly Averaged NO2The temporal evolutions of global tropospheric and total column from October 2004 to December 2010 are shown in more detail in Fig. 1, where global monthly averages are plotted. Similar temporal evolutions are found for the total and tropospheric column . The global tropospheric column increased by 11.10% from late (October, November, and December) 2004 to 2010 at a 1.76% annual growth rate, and this result is similar to the studies of Lamsal et al.,10 in which the authors argued that global anthropogenic emissions increased by 5.2% during 3 years from 2003 to 2006. The largest tropospheric and total values appear in 2009 with and , respectively. The yearly mean value increased 13.44 and 2.50% compared with those of 2008, respectively. In December 2009, the tropospheric and total values were and , respectively, with increases of 25.16 and 5.20% compared with those of December 2008. In March 2010, the tropospheric and total column showed the smallest value of and since 2004. Fig. 1Variation of global monthly tropospheric and total column from October 2004 to December 2010. The dashed line is the linear regression of the tropospheric column from October 2004 to December 2010.  The seasonal concentration is determined by the variability of meteorological conditions, atmospheric chemistry, and emissions. In regions which have strong anthropogenic emissions, an expected maximum in winter and minimum in summer can usually be observed (Fig. 1). The general pattern of annual variation of the tropospheric column is similar to the total column with a typical “” shape. The peak values generally appear in January, June, and December, and the low values appear in March and September. For anthropogenic emissions, the maximum values generally appear in January or December because of domestic heating needs, and the minimum values generally appear in March. The emissions in June were slightly higher than April and May because of the considerable biomass burning activity over southern Africa, Brazil, and Indonesia or lightning production in the dry season.22 The lower tropospheric column in August or September can be attributed to a decrease in traffic and industrial activity. The above-mentioned seasonal characteristics about the distribution of is mainly linked to the hydroxyl radical (OH) and the photolysis frequency of . The primary source of OH radicals is the photolysis of and other species like nitrous acid (HONO) and aldehydes.4 The higher winter values are likely to be the result of a decreasing loss of by reaction with OH (the major loss process in the lower troposphere), and a lower photolysis rate to deplete due to less sunlight in winter the northern hemisphere, and possibly also by higher winter emissions.22 On the other hand, in the lower stratosphere, the reactions of and control the transformation processes of . Higher in northern hemisphere and lower makes the reaction of easier in winter which enhances concentration in the atmosphere. Figure 2 plots the ratio variation of global mean tropospheric column accounting for total column . Compared with the tropospheric and total column , the annual cycling is weak for the ratio variation. In the long term, the ratio continually increases with the temporal evolution, which can be used to reflect the influence of anthropogenic emissions. The global ratio of tropospheric to total column increased by 11.11% during 2005 to 2010 at a 1.76% annual growth rate, the annual growth rate being almost the same as for the tropospheric column . In late 2004, the ratio was about 0.19, whereas in late 2009, the ratio was up to 0.24. The fastest increase started from 2009, while the ratios appeared obviously decreasing in 2010, due to the global decrease of tropospheric column , especially over oceans. Therefore, it can be deduced that emissions showed a dramatic growth during 2009, for the tropospheric columns are strongly related to surface emissions due to the short lifetime combined with the high ratio in the boundary layer.10 Fig. 2Ratio variation of global mean tropospheric to total column . The solid line is the linear regression of the ratios from October 2004 to December 2010. 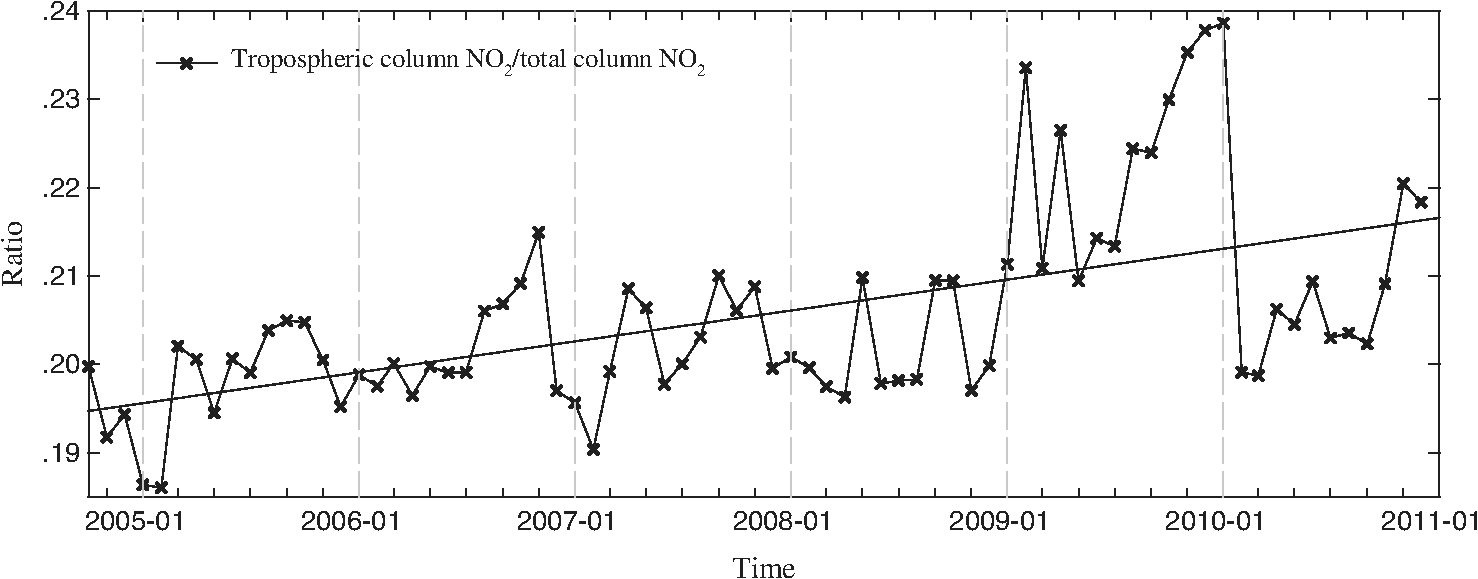 Figures 3 and 4 map the linear increasing trend from October 2004 to December 2010 of total and tropospheric column , respectively. A linear regression was applied to obtain the global trend according to the monthly averages of each pixel. Most of the world’s regions were increasing, particularly in eastern China. This increase is mainly due to the rising consumption of fossil fuels23 and less policy regulation.24 However, in eastern America (EAM), the trend is decreasing (Figs. 3 and 4). In central Africa, emissions caused by biomass burning showed a significant increase. A linearly increasing trend is also significant in the Persian Gulf region due to the oil industry and maritime shipping growth. Although the tropospheric column is larger over Johannesburg in South Africa, the linearly increasing trend is not significant. Over the remote ocean, the linearly increasing trend is generally not significant. Fig. 3Global spatial distribution of linear increasing trend of total column (), the gradient obtained from a linear regression of the monthly averages of total columns from October 2004 to December 2010.  Fig. 4Global spatial distribution of linear increasing trend of tropospheric column (), the gradient obtained from a linear regression of the monthly averages of tropospheric columns from October 2004 to December 2010. 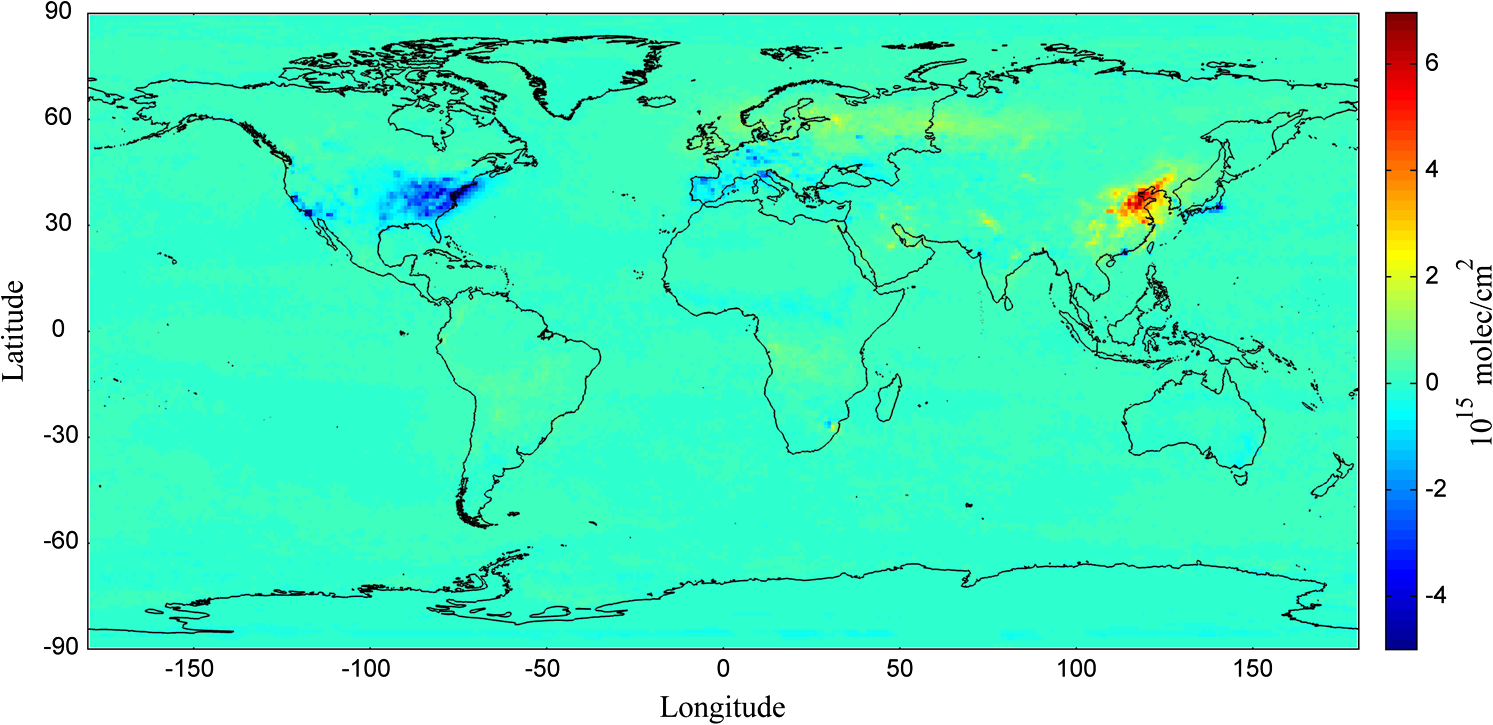 Figures 3 and 4 show the highest increasing trend in EAS. The region with the highest increasing trend corresponds to the regions that have the faster industrial and economic development. This is especially so in northern China where the atmospheric increased by from late 2004 to 2010. One can clearly note that the trend over EAM decreased by from late 2004 to 2010. This is probably due to the high level of economic activity, technical development, and policy regulation. This is also in agreement with the research of Lamsal et al.,10 in which the authors deduced a decrease of 5.7% in North America and an increase of 18.8% in east Asia, and a 6.7% annual growth rate in China due to anthropogenic emissions during 2006 to 2009. The tropospheric and total column over western Europe decreased by while it increased by in eastern and northern Europe from late 2004 to 2010. The reason for this result may be the increase in emissions from eastern and northern Europe following an increase in fuel consumption. An economic recovery may have contributed to emission growth. In western Europe, environmental and political concerns have driven a decision to abate emissions. European Commission regulations specifically targeted toward the transportation sector were introduced between 1992 and 2005. The UN Protocol obligations may have led to substantial reductions, and the introduction of improved vehicle technologies and stringent inspection systems related to European standards are the primary forces in reducing and road transport emissions of decreased by 44% between 1990 and 2005 in western Europe. The implementation of strict measures to control emissions demonstrated was deemed to be a major reason for the continued western Europe emission reductions.25 3.2.Spatial Characteristics of NO2To illustrate the spatial distribution of , the seasonal averages of the total and tropospheric columns derived from OMI measurements from October 2004 to December 2010 are shown in Figs. 5 and 6. The seasons in this article are divided into spring (March, April, and May, MAM), summer (June, July, and August, JJA), autumn (September, October, and November, SON), and winter (December, January and February, DJF). The load generally reflects human activity (Fig. 6) and might help to distinguish the sources of . As expected the largest tropospheric and total column occur over industrialized regions in North America, Europe, and east Asia where the multiyear mean values are and , and , and , respectively. This implies that the east Asia region is the largest emission source in the world. Fig. 5Global spatial distribution of multiyear (2005 to 2010) mean total column (). The top-left, top-right, bottom-left, and bottom-right panels are the MAM (March, April, May), JJA (June, July, August), SON (September, October, November), and DJF (December, January, February), respectively. 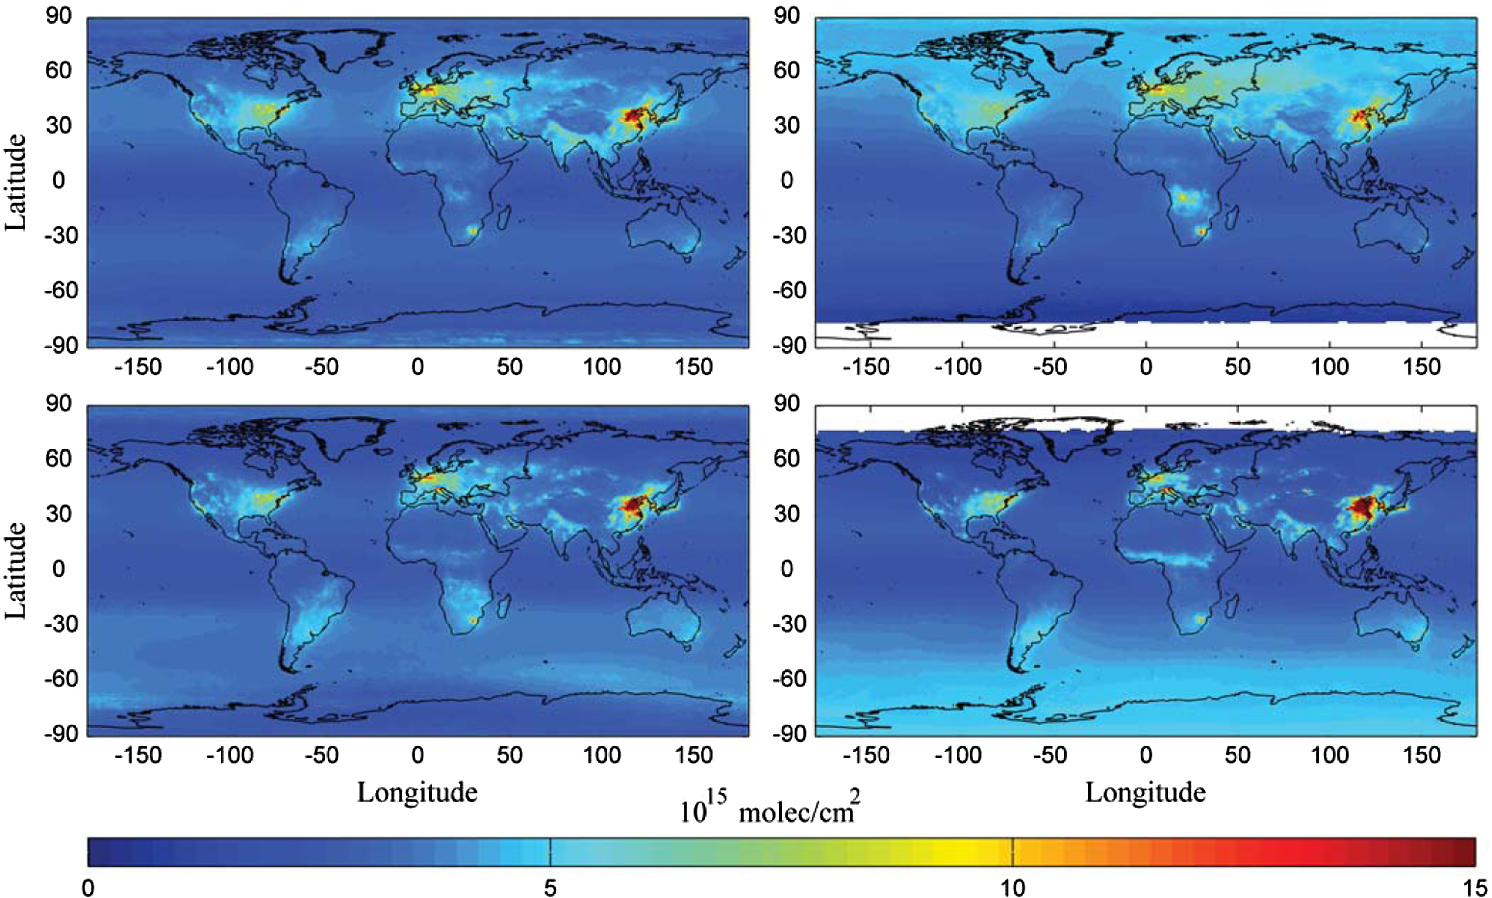 Fig. 6Global spatial distribution of multiyear (2005 to 2010) mean tropospheric column (). The top-left, top-right, bottom-left, and bottom-right panels are the MAM, JJA, SON and DJF, respectively.  Figures 5 and 6 also show that the concentrations are generally higher over industrial urban areas. One can see from the figures that hotspots appear in polluted urban areas surrounding Johannesburg, which is the largest city in South Africa. In the Persian Gulf region, due to the oil industry and maritime shipping, emissions lead to enhanced columns. The larger columns also occur in regions of biomass burning and savannah fires in South America, Africa, and Indonesia, especially in the summer. Large emissions also occur in southern Sahara Desert, which is likely to be due to emissions from soil.22,26 The lower values found over deserts (Sahara, Arabia, and Australia), the Amazon rainforest, the Tibetan Plateau, Siberia, Greenland, and Antarctica are due to less influence by human activities, soil , biomass burning, and lightning emissions. The inferred column for remote oceans are very low, mainly because there is nearly no anthropogenic activity in the ocean region, and the atmospheric which originates from natural emissions was assumed to be mostly located in the stratosphere. Figure 7 maps the global distribution of ratios of tropospheric to total column . It shows that anthropogenic emissions are the primary source of over land. As can be seen from the figure, the high ratios occur in polluted urban areas, ranging from 0.5 to 0.8, due to higher anthropogenic emitted from the burning of fossil fuels for transportation and industrial activities. Higher ratios also occur in the Persian Gulf region due to the oil industry and maritime shipping, and in savannah fires in South America, Africa, and Indonesia due to biomass burning, and in the regions of the southern Sahara Desert due to soil emission. Over land, generally, the lower ratios occur in the Sahara Desert, Tibetan Plateau, Siberia, Greenland, and Antarctica, where is derived mainly from natural sources. In some of the EAS regions, the ratios are higher than 0.8, which implies that the anthropogenic emission is the dominant source of atmospheric , whereas despite the abatement of anthropogenic emissions over North America, the ratios are still maintained at a higher level (). For the remote oceans, the ratios are very low, mainly because there is almost no anthropogenic activity and is hardly ever transported to the remote oceans from land due to its shorter lifetime. Fig. 7Seasonal spatial distribution of the ratio of tropospheric to total column , the top-left, top-right, bottom-left, and bottom-right panels are the MAM, JJA, SON and DJF, respectively.  In summer, the ratios are higher in central Africa due to emissions from biomass burning.27 In winter, the ratios are larger in the southern Sahara Desert due to the emission from soil. Domestic heating sources could contribute to the larger ratios over the northern and southern hemisphere as the seasons shift. This scene can be illustrated by the higher ratios over Johannesburg in South Africa in the southern hemisphere and northern Europe in the northern hemisphere. Another reason could be a decreasing loss of reacting with OH, and a lower photolysis rate to deplete due to less sunlight in winter over the northern globe.22 Figure 8 maps the global spatial distribution of the correlation coefficient () of tropospheric column and total column . The correlation coefficients are calculated by the spatially matching pixels of daily tropospheric column and total column from October 2004 to December 2010. The larger correlation coefficients () generally appear over land. In particular, over EAS and southern Asia and central and southern Africa, the value is often up to 0.95. This result indicates that the variation of total column is closely related to tropospheric column , which is strongly affected by human activity. 3.3.Characteristics of Three Typical RegionsIn this section, three typical regions with large concentrations are analyzed. EAM is defined as the region of 75 to 100 deg W, 30 to 45 deg N, western and southern Europe (WSE) is defined as the region of 5 deg to 35 deg E, 40 to 60 deg N, and EAS is defined as the region of 110 to 122 deg E, 22 to 42 deg N and 122 to 135 deg E, 30 to 50 deg N (Fig. 9). These three regions have the largest sources in the world (Figs. 3 and 4). The time series in Fig. 10 illustrate the variation of concentrations over the three regions and present different characteristics. In the right panel, the correlations of tropospheric and total column are highlighted, from which the influence of anthropogenic activities on troposphere and the atmospheric can be inferred according to the correlation coefficient () values. Fig. 9Ratio variation of tropospheric to total column over the regions of EAM, WSE, and EAS in left panel. The right panel maps the ratio distribution over globe (see Fig. 5), and the left, middle, and right box stand for the EAM, WSE and EAS, respectively. 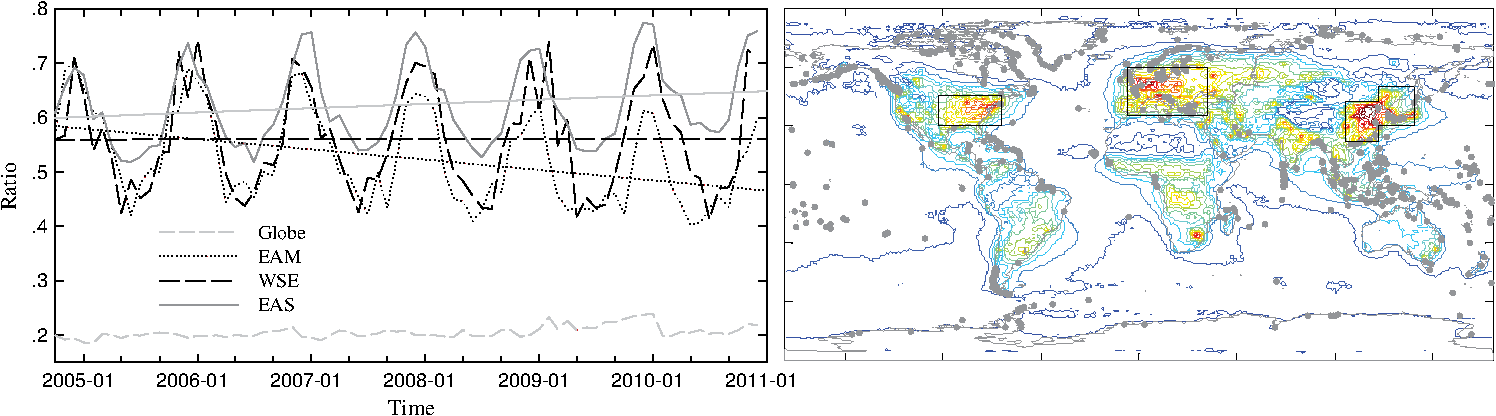 Fig. 10Temporal evolution characteristics of monthly mean total and tropospheric column over three typical regions. The black and red lines denote the total and tropospheric column in the right panel, respectively. The EAM, WSE, and EAS stand for eastern America, western and southern Europe, and eastern Asia, respectively. 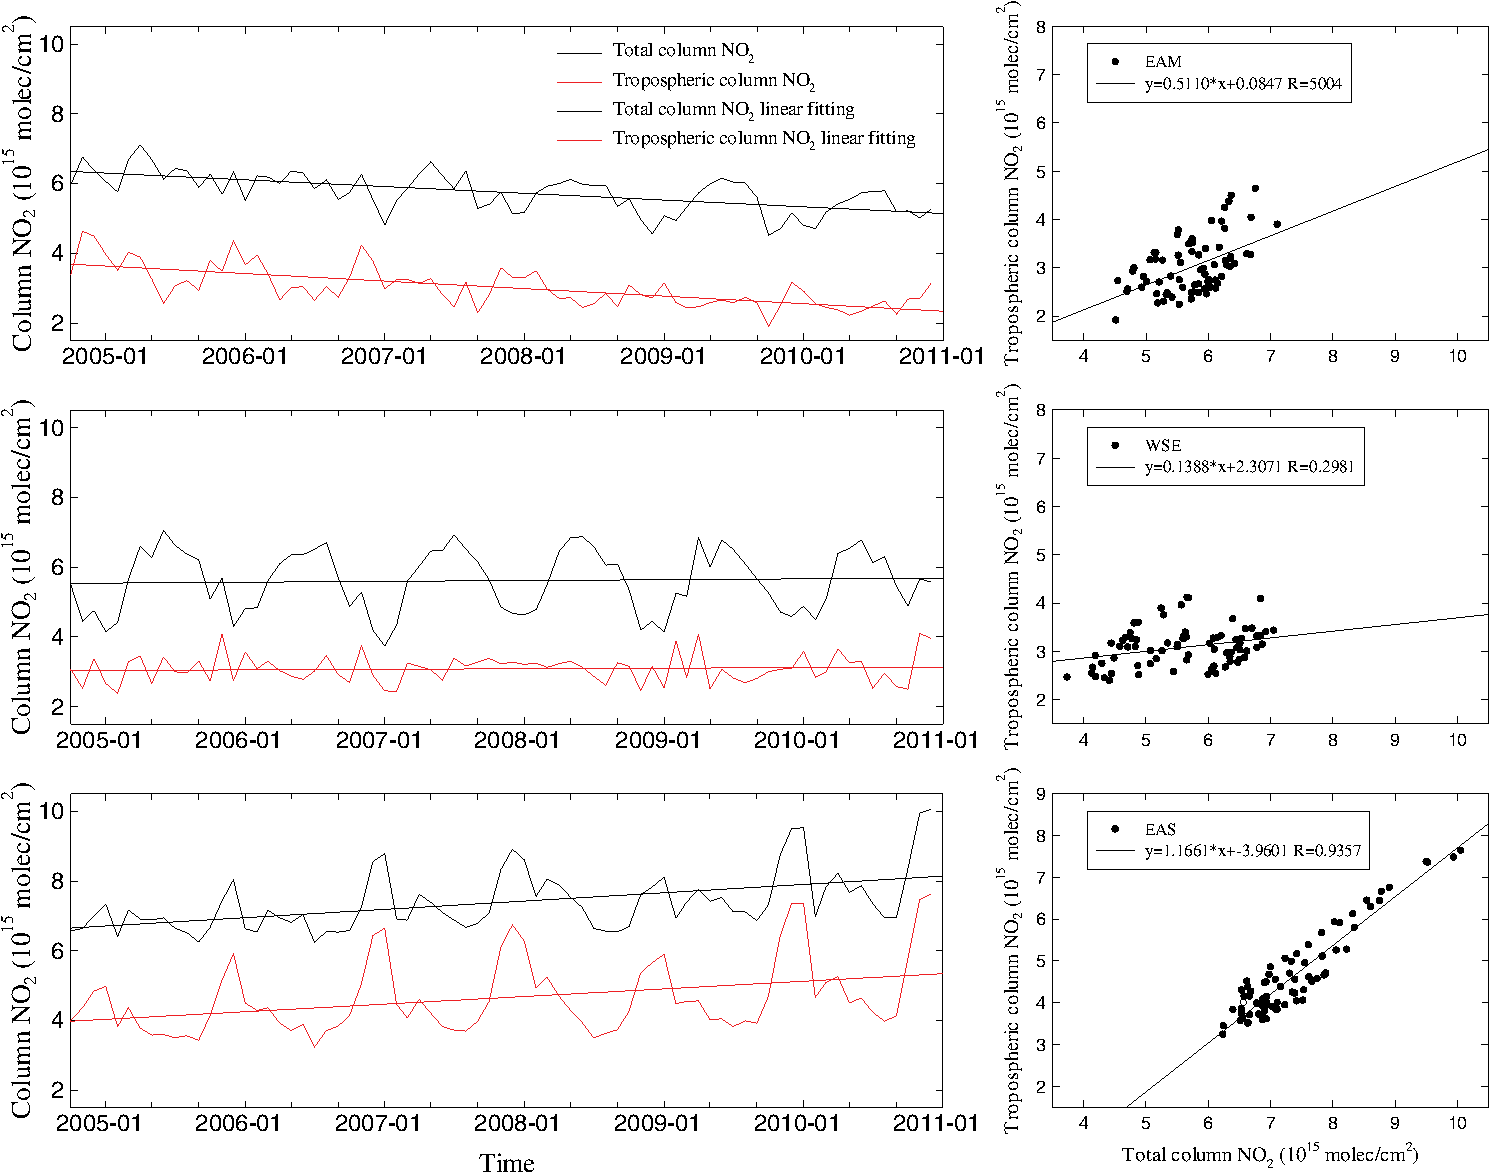 Over the EAM region, tropospheric and total column decreased with temporal evolution; the tropospheric column decreased by 35.47% during 2005 to 2010 at a 7.04% annual rate. In late 2004 (October, November, and December), the mean values of tropospheric column were , whereas in late 2010 (October, November, and December), they were . The reason for the decreased trend can be mainly attributed to decreasing anthropogenic emissions, where the of tropospheric and total column is 0.50. This is similar with the study of Lamsal et al.,10 in which they showed that the anthropogenic emissions decreased by 5.7% in North America during 2006 to 2009. The EAS region, especially eastern China, is the fastest growing industrial region in the world. The economic development has been accompanied by a strong increase of tropospheric pollutants emissions. The tropospheric column increased by 32.62% during 2005 to 2010 at a 5.44% annual growth rate, and the mean value of tropospheric column is up to . This growth rate is almost three times that of the global rate (1.76%) and is due to a dramatic increase in the anthropogenic emissions; the of tropospheric and total column is up to 0.94. As a result of a rapidly growing economy powered by the generation of energy from fossil fuels, large increases have been predicted for emissions from China. This result is in line with those of previous research.28–30 A continuous increase in tropospheric is predicted to have occurred in the industrial regions of China between 1996 and 2002, at a rate of .31 Lamsal et al.10 have shown an increase of 18.8% emissions in east Asia, following a 6.7% annual growth rate in China during 2006 to 2009. Compared with these results, the annual growth rate (5.44%) decreased in China from 2005 to 2010. Over the WSE region, the tropospheric column increased 3% during 2005 to 2010 at a 0.51% annual growth rate during 6 years. In late 2004 and 2010, the mean values of tropospheric column were and , respectively. This result is different from those of other research. Lövblad et al.32 showed a 30% emission reduction for Europe between 1990 and 2000 and 18% from 1996 to 2002. Konovalov et al.33 applied inversion techniques with GOME and SCIAMACY measurements between 1996 and 2004 and confirmed that the emission showed a decreasing trend in Europe. According to the research of Vestreng et al.,25 the total European emission reduction was 11% over the 5-year period of 2000 to 2005. This different result may be due to local statistics and the influence of increased emissions from eastern and northern Europe, which increased by . Figure 9 plots the ratio variations of tropospheric to total column over EAM, western and southern Europe (WSE), EAS, and globe, respectively. Figure 9 highlights the different characteristics of anthropogenic emissions over the three regions with the largest concentrations in the world. Their variations present more obvious periodic seasonal shifts than those in globe. The peaks and lows generally appear in the wintertime and summertime, respectively. The mean ratios in the three regions (, , and ) are higher than that of globe (). The ratio of tropospheric to total column increased by 8.39% during 2005 to 2010 at a 1.35% annual growth rate over EAS region; this growth rate is less than the global rate. The ratio of tropospheric to total column decreased 25.69% during 2005 to 2010 at a 4.83% annual decreasing rate over the EAM region. The ratio in the WSE region did not show a significant trend. This result reflects the different variations trend of anthropogenic emissions over the EAM, EAS, and WSE regions. 4.ConclusionsIn this article, we described the characteristics of total column and tropospheric during the period October 2004 to December 2010 using remote sensing data obtained from OMI. We investigated a 6-year trend of global and regional columns. The results showed that the global tropospheric column increased by 11.10% during 2005 to 2010 at a 1.76% annual growth rate. The seasonal variability of concentration showed a maximum value in winter and a minimum value in summer over regions with strong anthropogenic emissions. The ratio of tropospheric to total column is similar to the tropospheric and total variability. The ratio reached the largest value of 0.24 in December 2009. The three largest tropospheric and total columns of concentration occurred over the industrialized regions of northern America (multiyear mean equal and ), Europe (multiyear mean equal and ), and EAS (multiyear mean equal and ). The higher columns were also observed in regions of biomass burning and savannah fires in South America, Africa, and Indonesia, and in the Persian Gulf region, which was due to the influence of the oil industry and maritime shipping. Over the EAS region, the trend increased by 32.62% at a 4.82% annual growth rate in tropospheric column , while over the EAM region the trend decreased by 35.47% at a annual decreasing rate. The trend is not significant over Europe as a whole, where a decrease was observed over western and southern Europe (decreased ), and an increase occurred in eastern and northern Europe (decreased by ). These reflect the different variations trend of anthropogenic emissions over the EAM, EAS, and WSE regions. Over the polluted urban areas, the ratios of tropospheric to total column are , and the correlation coefficients of time series of tropospheric and total column are . This can be mainly attributed to the anthropogenic emissions over land, and it is noteworthy that the ratios are (correlation coefficients ) over northern China. For the remote oceans, the ratios are very low, mainly because there is almost no anthropogenic activity over oceans. AcknowledgmentsThe authors would like to thank NASA/OMI ( http://disc.sci.gsfc.nasa.gov/Aura/data-holdings/OMI/omno2e_v003.shtml) and KNMI/DOMINO for providing products. Funding support partially from the Scientific Research Foundation of Jimei University, China, the NSF China Major Program (61190114 and 41171324), the State Key Fundamental Science Funds of China (2011CB302705, 2010CB950702 and 2010CB428503), the Funds for Ph.D. Education (20110091110028), the State High Technology Funds of China (2009AA122001 and 2009AA122005), the State Key Basic Research Funds of China (2007FY110300-04 and 08), Zhejiang Province Key Science and Technology Innovation Team (2010R50030), and the Priority Academic Program Development of Jiangsu Higher Education Institutions. ReferencesR. V. Martinet al.,
“Global inventory of nitrogen oxide emissions constrained by space-based observations of columns,”
J. Geophys. Res., 108
(D17), 4537
–4548
(2003). http://dx.doi.org/10.1029/2003JD003453 JGREA2 0148-0227 Google Scholar
P. J. Crutzen,
“The influence of nitrogen oxides on the atmospheric ozone content,”
Q. J. R. Meteorol. Soc., 96
(408), 320
–325
(1970). http://dx.doi.org/10.1002/(ISSN)1477-870X QJRMAM 0035-9009 Google Scholar
B. J. Finlayson-PittsJ. N. Pitts, Chemistry of the Upper and Lower Atmosphere: Theory, Experiments, and Applications, Academic, San Diego, California
(2000). Google Scholar
C. Ordóñezet al.,
“Comparison of 7 years of satellite-borne and ground-based tropospheric measurements around Milan, Italy,”
J. Geophys. Res., 111
(D5), D05310
(2006). http://dx.doi.org/10.1029/2005JD006305 JGREA2 0148-0227 Google Scholar
F. J. DentenerP. J. Crutzen,
“Reaction of on tropospheric aerosols: impact on the global distributions of , , and OH,”
J. Geophys. Res., 98
(D4), 7149
–7163
(1993). http://dx.doi.org/10.1029/92JD02979 JGREA2 0148-0227 Google Scholar
“Climate change 2001: the scientific basis,”
Contribution of Working Group I to the Third Assessment Report of the IPCC, Cambridge University Press, New York
(2001). Google Scholar
S. Solomonet al.,
“On the role of nitrogen dioxide in the absorption of solar radiation,”
J. Geophys. Res., 104
(D10), 12047
–12058
(1999). http://dx.doi.org/10.1029/1999JD900035 JGREA2 0148-0227 Google Scholar
L. Emmonset al.,
“Climatologies of and : a comparison of data and models,”
Atmos. Environ., 31
(12), 1851
–1904
(1997). http://dx.doi.org/10.1016/S1352-2310(96)00334-2 AENVEQ 0004-6981 Google Scholar
D. S. Leeet al.,
“Estimations of global emissions and their uncertainties,”
Atmos. Environ., 31
(12), 1735
–1749
(1997). http://dx.doi.org/10.1016/S1352-2310(96)00327-5 AENVEQ 0004-6981 Google Scholar
L. N. Lamsalet al.,
“Application of satellite observations for timely updates to global anthropogenic emission inventories,”
Geophys. Res. Lett., 38
(5), L05810
(2011). http://dx.doi.org/10.1029/2010GL046476 GPRLAJ 0094-8276 Google Scholar
C. Leueet al.,
“Quantitative analysis of emissions from global ozone monitoring experiment satellite image sequences,”
J. Geophys. Res., 106
(D6), 5493
–5505
(2001). http://dx.doi.org/10.1029/2000JD900572 JGREA2 0148-0227 Google Scholar
R. V. Martinet al.,
“An improved retrieval of tropospheric nitrogen dioxide from GOME,”
J. Geophys. Res., 107
(D20), 4437
–4457
(2002). http://dx.doi.org/10.1029/2001JD001027 JGREA2 0148-0227 Google Scholar
A. RichterJ. P. Burrows,
“Retrieval of tropospheric from GOME measurements,”
Adv. Space Res., 29
(11), 1673
–1683
(2002). http://dx.doi.org/10.1016/S0273-1177(02)00100-X ASRSDW 0273-1177 Google Scholar
G. J. M. Velderset al.,
“Global tropospheric column distributions: comparing 3-D model calculations with GOME measurements,”
J. Geophys. Res., 106
(D12), 12643
–12660
(2001). http://dx.doi.org/10.1029/2000JD900762 JGREA2 0148-0227 Google Scholar
H. Bovensmannet al.,
“SCIAMACHY-mission objectives and measurement modes,”
J. Atmos. Sci., 56
(2), 127
–150
(1999). http://dx.doi.org/10.1175/1520-0469(1999)056<0127:SMOAMM>2.0.CO;2 JAHSAK 0022-4928 Google Scholar
A. R. J. van deret al.,
“Trends, seasonal variability and dominant source derived from a ten year record of measured from space,”
J. Geophys. Res., 113
(D4), D04302
(2008). http://dx.doi.org/10.1029/2007JD009021 JGREA2 0148-0227 Google Scholar
K. F. Boersmaet al.,
“Intercomparison of SCIAMACHY and OMI tropospheric columns: observing the diurnal evolution of chemistry and emissions from space,”
J. Geophys. Res., 113
(D16), D16S26
(2008). http://dx.doi.org/10.1029/2007JD008816 JGREA2 0148-0227 Google Scholar
K. F. Boersmaet al.,
“Validation of OMI tropospheric observations during INTEX-B and application to constrain emissions over the eastern United States and Mexico,”
Atmos. Environ., 42
(19), 4480
–4497
(2008). http://dx.doi.org/10.1016/j.atmosenv.2008.02.004 AENVEQ 0004-6981 Google Scholar
D. V. Ionovet al.,
“Ground-based validation of EOS-Aura OMI vertical column data in the midlatitude mountain ranges of Tien Shan (Kyrgyzstan) and Alps (France),”
J. Geophys. Res., 113
(D15), D15S08
(2008). http://dx.doi.org/10.1029/2007JD008659 JGREA2 0148-0227 Google Scholar
H. Irieet al.,
“Characterization of OMI tropospheric measurements in east Asia based on a robust validation comparison,”
SOLA, 5
(4), 117
–120
(2009). http://dx.doi.org/10.2151/sola.2009-030 1349-6476 Google Scholar
M. O. Weniget al.,
“Validation of OMI tropospheric column densities using direct-Sun mode Brewer measurements at NASA Goddard Space Flight Center,”
J. Geophys. Res., 113
(D16), D16S45
(2008). http://dx.doi.org/10.1029/2007JD008988 JGREA2 0148-0227 Google Scholar
L. Jaegléet al.,
“Global partitioning of sources using satellite observations: relative roles of fossil fuel combustion, biomass burning and soil emissions,”
Faraday Discuss., 130 407
–423
(2005). http://dx.doi.org/10.1039/b502128f FDISE6 0301-7249 Google Scholar
H. Akimoto,
“Global air quality and pollution,”
Science, 302
(5651), 1716
–1719
(2003). http://dx.doi.org/10.1126/science.1092666 SCIEAS 0036-8075 Google Scholar
M. NajaH. AkimotoJ. Staehelin,
“Ozone in background and photochemically aged air over central Europe: analysis of long-term ozonesonde data from Hohenpeissenberg and Payerne,”
J. Geophys. Res., 108
(D2), 4063
–4073
(2003). http://dx.doi.org/10.1029/2002JD002477 JGREA2 0148-0227 Google Scholar
V. Vestrenget al.,
“Evolution of emissions in Europe with focus on road transport control measures,”
Atmos. Chem. Phys., 9 1503
–1520
(2009). http://dx.doi.org/10.5194/acp-9-1503-2009 ACPTCE 1680-7316 Google Scholar
J. J. YiengerH. Levy,
“Empirical model of global soil-biogenic emissions,”
J. Geophys. Res., 100
(D6), 11447
–11464
(1995). http://dx.doi.org/10.1029/95JD00370 JGREA2 0148-0227 Google Scholar
N. H. Savageet al.,
“Using GOME satellite data to examine regional differences in TOMCAT model performance,”
Atmos. Chem. Phys., 4
(7), 1895
–1912
(2004). http://dx.doi.org/10.5194/acp-4-1895-2004 ACPTCE 1680-7316 Google Scholar
A. Richteret al.,
“Increase in tropospheric nitrogen dioxide over China observed from space,”
Nature, 437 129
–132
(2005). http://dx.doi.org/10.1038/nature04092 NATUAS 0028-0836 Google Scholar
Q. Zhanget al.,
“Asian emissions in 2006 for the NASA INTEX-B mission,”
Atmos. Chem. Phys., 9 5131
–5153
(2009). http://dx.doi.org/10.5194/acp-9-5131-2009 ACPTCE 1680-7316 Google Scholar
Q. Zhanget al.,
“ emission trends for China, 1995–2004: the view from the ground and the view from space,”
J. Geophys. Res., 112
(D22), D22306
(2007). http://dx.doi.org/10.1029/2007JD008684 JGREA2 0148-0227 Google Scholar
H. Irieet al.,
“Evaluation of long-term tropospheric data obtained by GOME over east Asia in 1996–2002,”
Geophys. Res. Lett., 32
(11), L11810
(2005). http://dx.doi.org/10.1029/2005GL022770 GPRLAJ 0094-8276 Google Scholar
G. Lövbladet al.,
“EMEP assessment Part I. European perspective,”
The Cooperative Programme for Monitoring and Evaluation of the Long-range Transmission of Air Pollutants in Europe, Norwegian Meteorological Institute, Oslo
(2004). Google Scholar
I. B. Konovalovet al.,
“Satellite measurement based estimates of decadal changes in European nitrogen oxides emissions,”
Atmos. Chem. Phys., 8
(10), 2623
–2641
(2008). Google Scholar
|


