|
|
1.IntroductionVegetation mapping is an important tool for natural resources management and land use planning, since vegetation acts as a base for all living organisms and plays an essential role in global dynamics.1,2 In addition, vegetation mapping provides valuable information for investigating natural and semi-natural environments through the quantification of vegetation cover from local to global scales at a given time point or over a continuous period. Mapping current states of vegetation cover is a crucial step toward the implementation of environmental conservation and restoration programs.3 Several studies have proven that traditional methods (e.g., field surveys, literature reviews, map interpretation, and ancillary data analysis) are not effective to map vegetation cover, since they are time-consuming, date-lagged, and often too expensive.4–6 Conversely, remote sensing (RS) represents a practical and economical instrument to study vegetation cover4,7 and has been applied to map vegetation cover from local to global scales over the last three decades.6 RS has been widely applied in vegetation and land cover mapping of arid environments, especially when combined with thorough ground-truthing.8–10 However, arid environments are challenging due to the heterogeneous vegetation cover, which complicates the identification and mapping of vegetation types,11 especially when accompanied with variable geomorphological features.6,12 In these contexts, moderate- and coarse-resolution satellite images have shown several limits and disadvantages. First of all, the limited detail makes it impossible to map complex vegetation patterns, leading to high levels of error in the case of mosaicked vegetation.13,14 In addition, coarse resolution (and reduced number of spectral bands as well) is not suited to mapping applications when dealing with vegetation communities characterized by heterogeneous covers that cause irregular spectral response not only in different environmental contexts but also over small areas.6,11,15 In these cases, traditional classification approaches like maximum likelihood (ML) and single-class signatures proved to be equally ineffective given the impossibility to describe heterogeneous classes and the high level of map fragmentation and misclassifications obtained in the case of mosaicked environments.5,16,17 Therefore, ecologically meaningful vegetation maps need to be based on thorough vegetation surveys/analysis, hyperspatial/hyperspectral satellite data, and precise and flexible classification approaches in order to provide a reliable reference for monitoring, management, and planning.6,15,17,18 Kràl and Pavlis9 first attempted to produce a land cover map of Socotra Island (Yemen), a global biodiversity hotspot located in the Indian Ocean, through an ML classification of LANDSAT coarse-resolution images based on field verifications. Even though this is a valuable dataset that filled a key knowledge gap, more effort is needed toward the production of a high-detail vegetation map faithfully representing the valuable vegetation communities of the island.19,20 In the present study, in order to produce an ecologically accurate vegetation map of Socotra, a high-resolution, multispectral satellite image was classified based on a sequential segmentation process particularly suited to complex vegetation mosaics.5,11,12 This classification was compared to the traditional ML approach by assessing the percentage of accuracy reached on the basis of a reference dataset obtained from a statistical analysis of more than 300 vegetation field surveys. Socotra Island is included among global biodiversity hotspots owing to the high level of plant endemism, placing it among the most important islands in the world.19 For this reason, the island has earned many international awards: Man and the Biosphere Reserve (UNESCO), World Heritage site (UNESCO and World Heritage Organization), and Special Protected Area (Government of the Yemen Republic). In particular, the archipelago hosts 837 plant and fern species, with 308 (37%) endemics. At higher taxonomic levels, the endemics include 15 genera and 1 subfamily.19,20,21 In the last decade, several international projects dedicated to nature conservation and sustainable development of the island have been started under the patronage of the International Union for Conservation of Nature, UNESCO, or other international nongovernmental organizations and donors to protect the natural resources of the island from the increasing threats of pollution, overgrazing, and spread of invasive species.19,20 In this perspective, an ecologically accurate vegetation map will represent a key resource for conservation, monitoring, land use planning and management, as well as a primary instrument for future research on the natural resources of Socotra. 2.Study AreaSocotra Island, covering , names an archipelago also including three smaller islands and a series of rocky outcrops (Fig. 1). Socotra archipelago is part of Yemen and is located in the northwestern Indian Ocean (Long: 12°06’–12°42’ N, Lat: 52°03’–54°32’ E). Socotra was connected to the Gondwana supercontinent until the Cretaceous era, after which an ocean loch separated it from Arabia, about 18 million years before present.20 This long isolation triggered the development of the high level of endemism, placing the archipelago among global biodiversity hotspots.21 Fig. 1Location of the study area. Socotra archipelago is part of the Republic of Yemen and comprises Socotra, the largest island, Abd-el-Kuhri, Samha, Darsa, and a series of rocky outcrops. It is located in the northwestern Indian Ocean.  Three main environmental systems can be identified: the coastal plains, the calcareous plateaux, and the central granite Haggeher mountains.21 The coastal plains are widest in the southwest; elsewhere, they consist of narrow flat lands ending in rocky scarps toward the highlands. Water streams are characterized by a torrential hydrological regime, and soils are mainly alluvial. The calcareous plateaux occupies most of the eastern and western-central parts of the island, with altitudes ranging from 300 to 800 m. Soils are generally thin, and the vegetation cover appears notably scattered. The central granite Haggeher massif protrudes from the limestone sublayer in the eastern-central area of the island and maintains some of the most peculiar landscapes in Socotra: mountain slopes show continuous vegetation cover in a complex mosaic of clearings, grasslands, shrublands, and woodlands. The climate of Socotra is characterized by the Indian Ocean monsoon. The average temperature is 27°C and the mean annual rainfall amounts to 216 mm, with a marked periodical trend influencing vegetation dynamics, mainly affected by the rotation of monsoon seasons. The mountainous chain is the main factor for climatic variability and causes increase in rainfall and frequent fog.22 The first studies on the vegetation of the archipelago were made by Balfour.23 Recently, a more exhaustive and detailed analysis of the vegetation of Socotra was realized by De Sanctis et al.,24 who identified a clear altitudinal gradient for four distinctive vegetation zones, ranging from the arid coastal plains up to the subhumid upper zone of the Haggeher mountains. The traditional economy that was based on pastoralism and fisheries allowed the small human population of the island to use natural resources without excessive exploitation. This equilibrium was favored by the isolation of the archipelago, which lasted until the 1990s, when many development projects, such as the building of an airport, a sea port, and a network of roads, took place.19,20 Habitat degradation and spreading of invasive species are considered the most dangerous current threats to the biodiversity of Socotra.20 The fragmentation caused by the road network generates pressure on hitherto inaccessible ecosystems and is increasing the illegal collection and trade of its endemic species. Among the plant species, 88 exotics have been identified, among which 61% have been recognized as having the potential to become invasive and 10% are considered naturalized and widespread.25 Another threat is the abandonment of traditional land use practices.20 These dynamics represent an increasing threat to important habitats, which is believed to cause regeneration problems in threatened species such as Dracaena cinnabari and Boswellia spp.26,27 In this perspective, this study is also aimed at filling a knowledge and data gap, providing a high-resolution vegetation map that will represent a useful and reliable instrument for conservation and sustainable development projects. 3.Materials and Methods3.1.Satellite DataRS data were chosen to provide a high resolution and an adequate range of spectral bands: a RapidEye image set was acquired on December 27, 2010, and provided with the application of default radiometric, sensor, and geometric corrections. RapidEye provides multispectral five-band images with a pixel resolution of 5 m, the possibility to acquire images daily for any area on Earth, and a temporal resolution of 5.5 days at nadir.28–30 The high spatiotemporal resolution allowed the selection of minimum cloud cover images within a relatively small time span, and the availability of five spectral bands (with a Red Edge band) allowed for a more accurate representation of plant communities.28 As a matter of fact, the Red Edge band has been found to be correlated with chlorophyll content, and thus with photosynthetic activity, while being insensitive to soil background and atmospheric noise.28,31 In addition, it has been applied to the analysis of status of crops and grasslands.28,32 These features explain how the availability of this wavelength can add more detail to the analysis of the spectral features of the vegetation classes, thus contributing to the production of a more accurate map. 3.2.Classified Vegetation SurveysThe vegetation categories were derived from De Sanctis et al.,24 who conducted a phytosociological field survey between 2007 and 2009 with 318 vegetation relevés. Multivariate statistical analysis of vegetation relevés allowed the identification of eight types of woodland, seven of shrubland, six of herbaceous, and seven of halophytic vegetation. In this way, a training dataset for the classification procedure was obtained from georeferenced classified field surveys. Around each relevé, a 10 m buffer was created to generate training areas. This reduced dimension of the training areas was chosen to adapt to the mosaicked environment characterizing some areas of the island and to represent the mean surface covered by each relevé. The training map was then generated by converting the buffer areas obtained to raster. The original vegetation classes were modified during the image classification phase to take into account the overlapping spectral signatures, while some vegetation communities showing a large degree of spectral overlap were aggregated into single classes. 3.3.Image ClassificationThe classification of satellite images is a multistep procedure.6 The first phase consists of extracting the statistics of the spectral responses of the defined classes (spectral signatures). Subsequently, these data are used to assign every pixel of the map to a specific class. This operation is executed by means of statistical (and in some cases spatial) computation based on spectral signatures. Two alternative approaches were tested, each one based on a different methodology of signature extraction and image classification. The effectiveness of the two methods was compared by evaluating the respective total accuracy of the final maps they produced. 3.3.1.Spectral signaturesSpectral signatures represent a statistical description of the spectral response of the classes defined in the training map.6 Two different approaches were tested to obtain spectral signatures. The first methodology consisted of the extraction of a single signature for each class identified by the training map. This operation can be executed in GRASS33 through the model i.gensig and is based on an analysis of the distribution (mean, variance, covariance matrices) of the reflectance values observed for the reference classes in each band of the satellite image. Despite its simplicity and quick execution, this methodology is strongly affected by the internal variability in coverage and composition of the vegetation classes that cannot be accurately represented by single-class signatures.16,17 The Gaussian mixture distribution (GMD) model is a probabilistic approach that considers a variable number of subclasses, each described by a multivariate Gaussian distribution defined by a small number of parameters (mean and variance of each variable, covariances between each pair of variables, and a weighting based on the proportion of data described by the subclass). Each subclass is defined by a multivariate Gaussian distribution, and at the same time the combined mixture of distributions adapts to nonlinear patterns in the data; thus, the Gaussian mixture for each class does not resemble a Gaussian distribution.5,34 We estimated the number of subclasses directly from the data, with the advantage of an objective determination of the tightness of fit that prevents over- and underfitting. These operations were executed in GRASS through the module i.gensigset. The effectiveness of GMD classes, which acts as a basis for a sequential maximum a posteriori (SMAP) classification, proves superior, especially in heterogeneous contexts where the same vegetation typology can be characterized by different coverage or composition, resulting in a nonlinear distribution of spectral response values.5,16 Nevertheless, a thorough selection of source data must be operated, because inaccurate training points can generate undesired subclasses and increase misclassifications.5,34 We paid particular attention to the field positioning of vegetation surveys to obtain homogeneous buffer areas. This, together with the reliable classification methodologies applied to obtain the reference classes, ensured the suitability of the data to the particular demands of the GMD approach. 3.3.2.ClassificationDepending on the type of signatures extracted, two image classification methodologies were applied. The ML method is based on a separate classification operated for each pixel of the satellite image, independently from the others. The assigned class shows the highest probability of coincidence (computed with a maximum-likelihood algorithm) with the observed spectral response, described by the single-class signatures defined by the i.gensig module. The GRASS module performing this operation is i.maxlik. This simple methodology showed several limitations when applied to complex vegetation patterns in previous studies.5,16,17,35 The separate assignment of single cells causes fragmentation of the classified map, especially in the case of high-landscape heterogeneity.17,35 Moreover, this procedure is based on single-class spectral signatures not capable of classifying heterogeneous vegetation classes.35 The SMAP classification is a spatially explicit process based on a multiscale approach assigning pixels to a class in consideration of nearby cells.5,35 It is executed through the i.sma package and is based on multiclass GMD signatures extracted through the i.gensigset module. This procedure assumes that in the surroundings of vegetation type, the probability of observing the same formation is higher.5,36–38 The assignment is performed through the application of a series of masks increasing in dimension (pixel height and width), and thus at a progressively finer scale, each casually dependent on the previous one (Fig. 2) according to Markov’s random field model.36–38 This GMD–SMAP methodology has been shown to be more effective than the ML classification, since it is capable of producing homogeneous maps, and is thus recommended for the interpretation of heterogeneous and mosaicked environments.5,16,17,38 Fig. 2Spatial structure of Markov’s random field model, defining the relationships between cells at different resolutions for the application of the SMAP algorithm (adapted from Gavin and Hu, 2005—courtesy of D. G. Gavin). (a) Four-fold ramification used for high-resolution calibration. Dashed lines represent the raster grid at finer detail. Solid lines show the union scheme for the classification of coarser-scale pixels. (b) Pyramidal structure used for the segmentation process, starting from coarser resolutions. It can be seen how each of the four central points is connected to three nearby cells of the precedent level.  3.3.3.Mapped classesThe vegetation map obtained (Fig. 3) comprises 28 classes, including plant communities identified by De Sanctis et al.,24 as well as several land cover types, briefly described below. Fig. 3Vegetation map of Socotra Island produced with SMAP classification. See Sec. 3.3.3 for a brief description of the mapped classes. 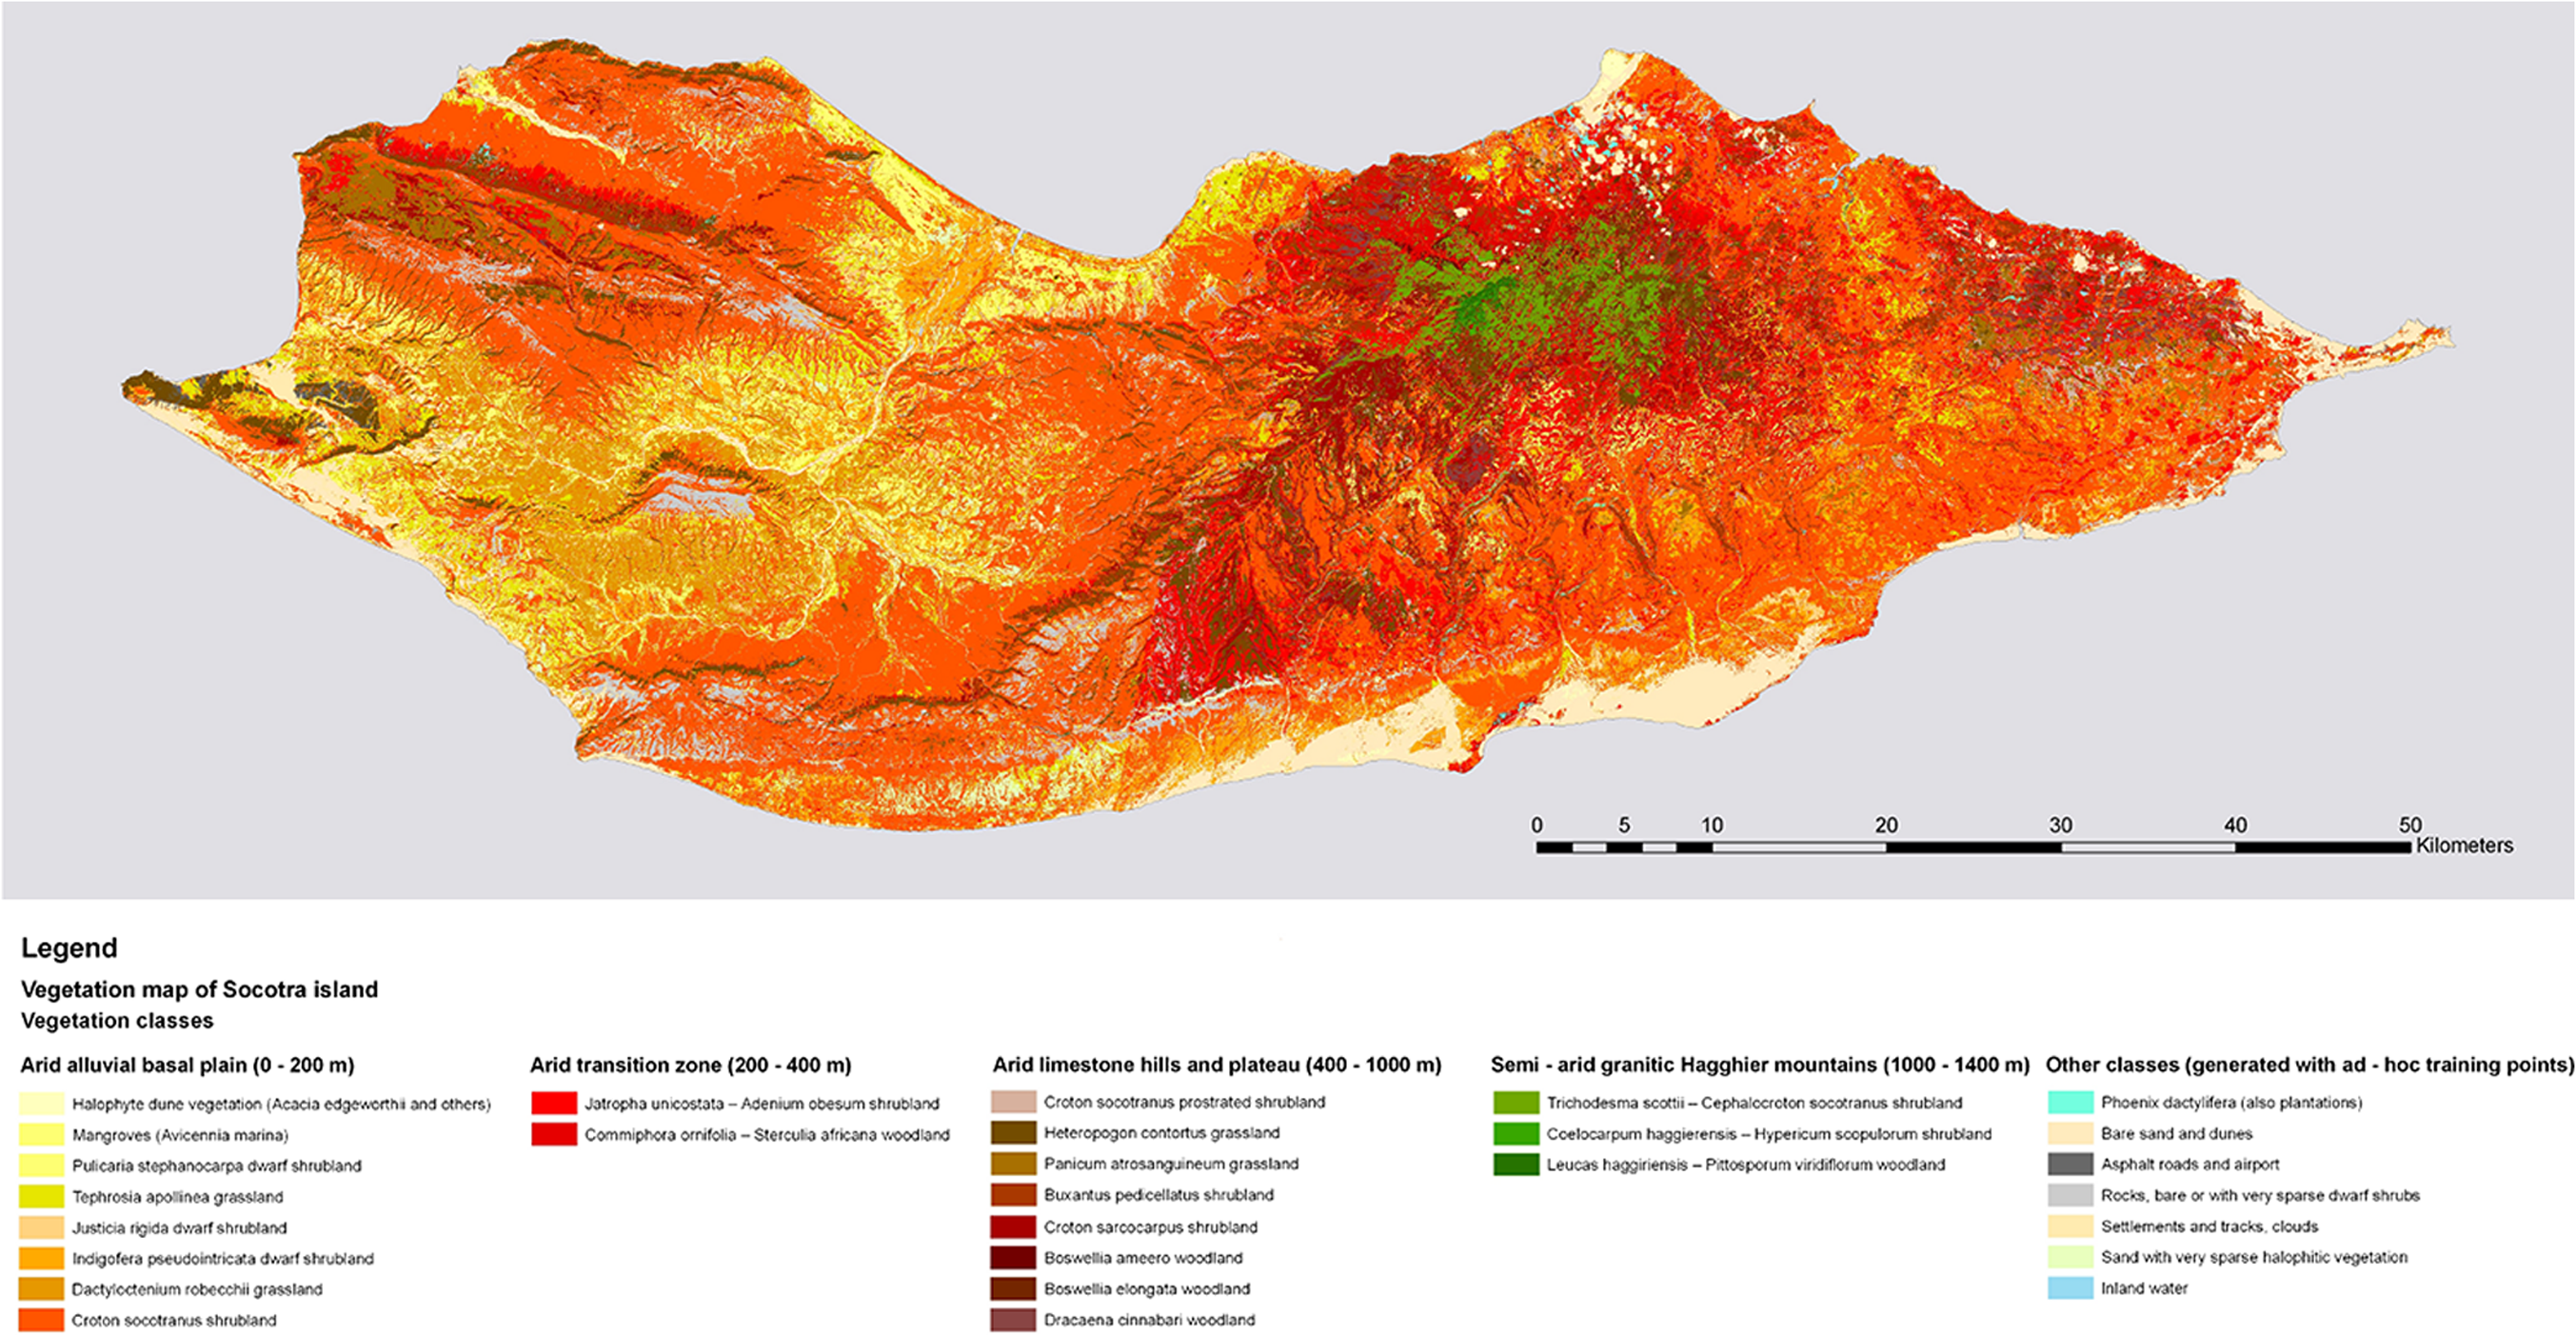 Woodlands
Shrublands
Grasslands
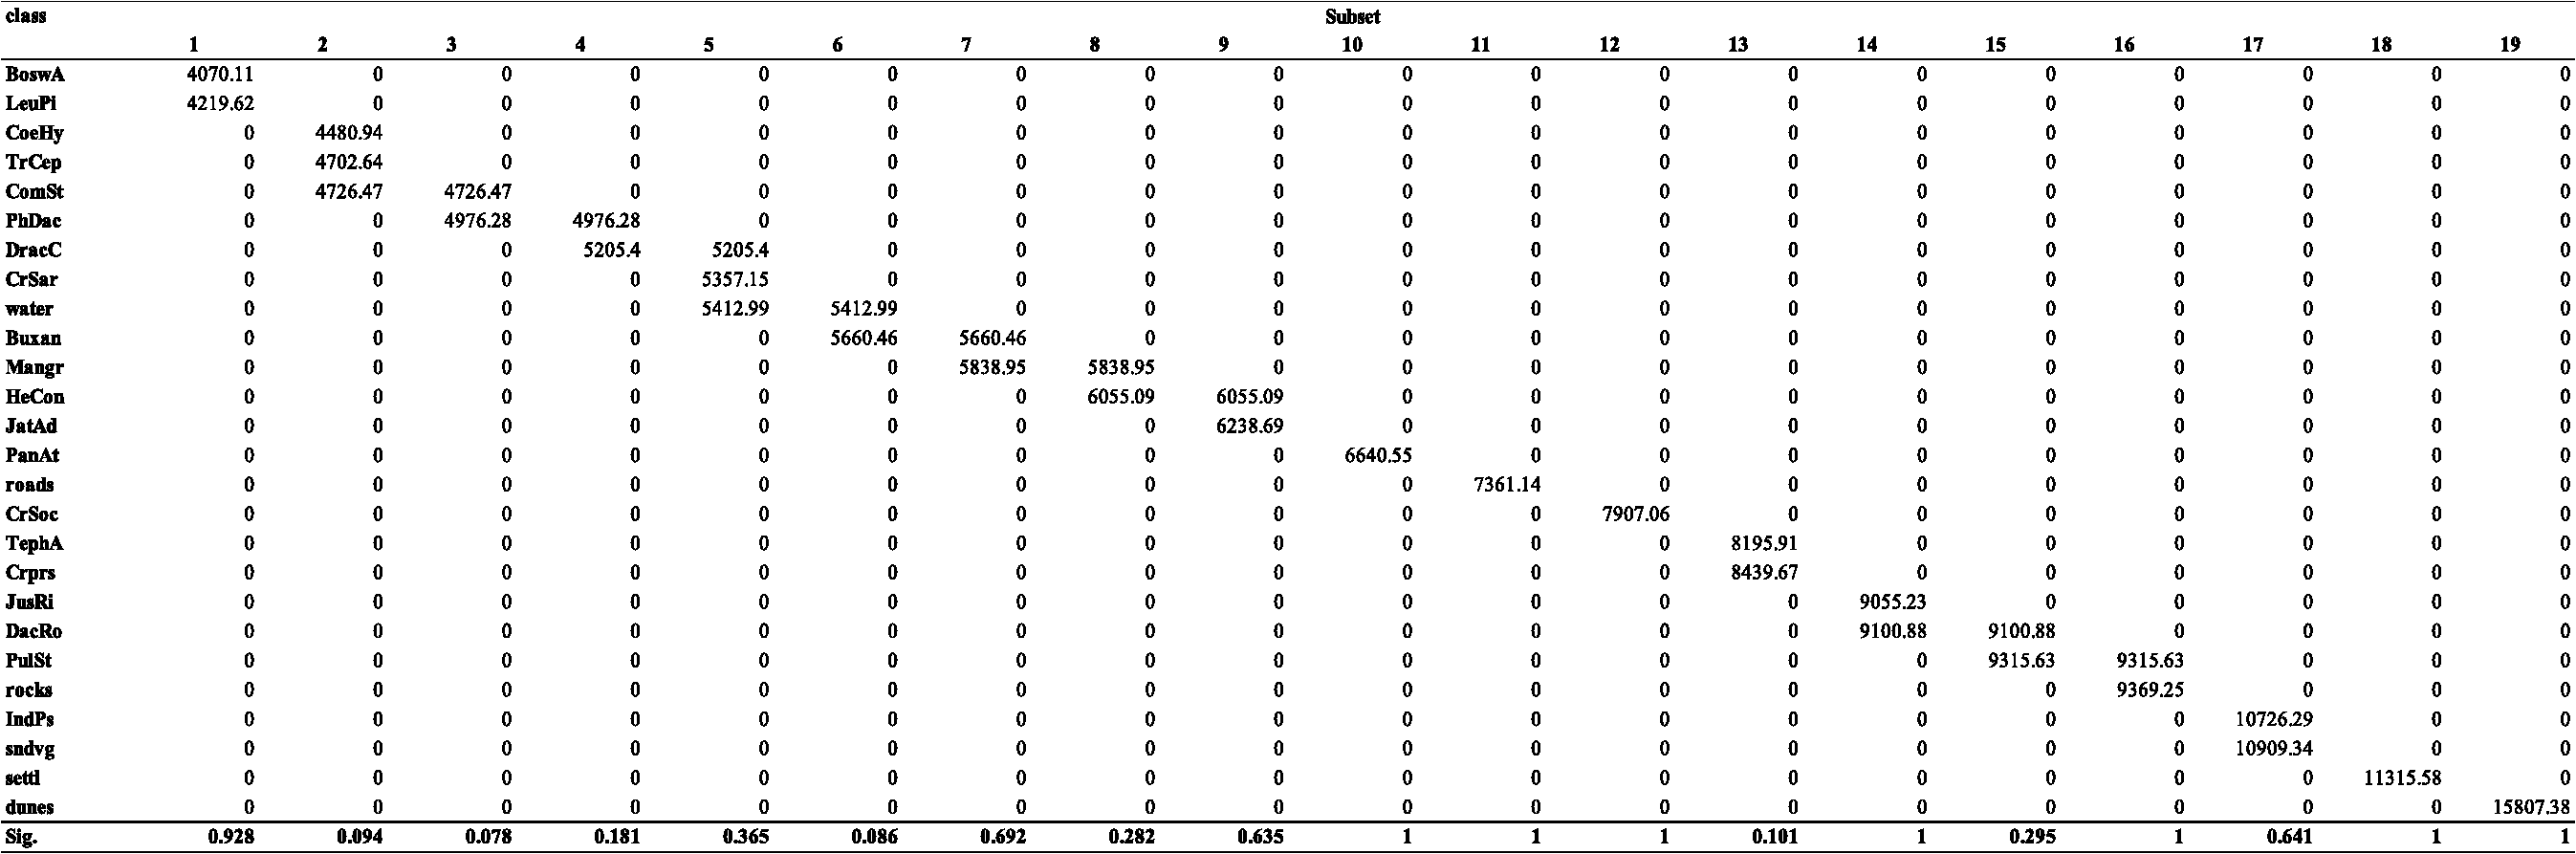
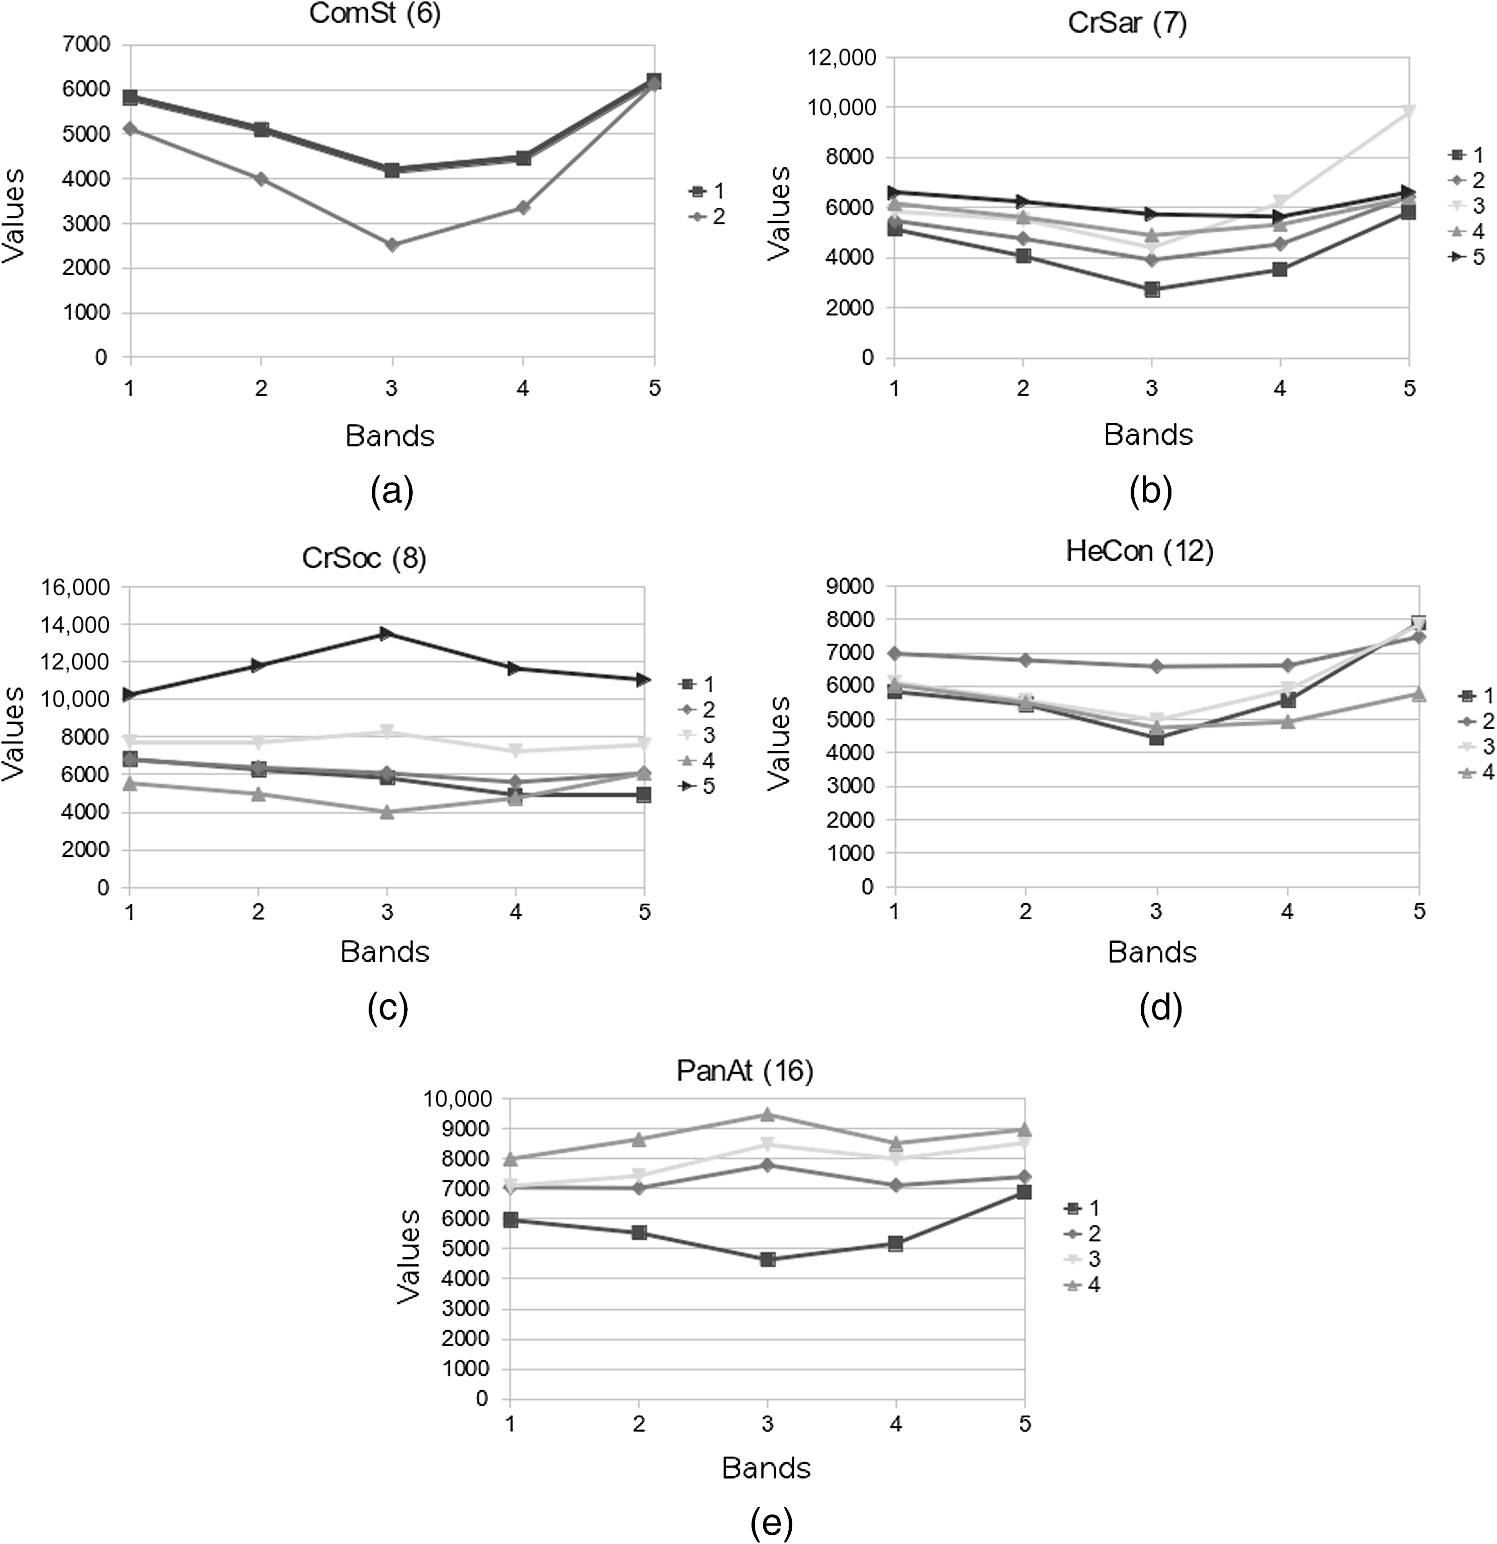
3.3.4.PostclassificationAfter the classification, the accuracy of the map was improved by applying filters based on the ecological characteristics of the vegetation typologies, to reduce the number of misclassified pixels when the corresponding classes could be distinguished on an ecological basis.6,9 These situations were identified by observing the confusion matrix (see Sec. 3.3.5). When two classes show a similar physiognomy and/or vegetation cover, their spectral signatures will be almost coincident, and the class with the larger standard deviation and decision boundaries will tend to classify more pixels, resulting in misclassification of cells belonging to other spectrally similar typologies. If a threshold value of any environmental parameter exactly separating the two classes exists, a raster map representing the selected parameter can be used to correct this error through the application of a postclassification filter.6,9 The operation consists of assigning the pixels of the first class, beyond the defined threshold, to the second. To execute this, the r.mapcal module39,40 was used in the GRASS environment. The selected parameter was altitude, which determines the distribution of plant communities on the island. According to this procedure, two main postclassification filters were applied in order to correct the high level of omission observed for the class TrCep. In the first case, the postclassification process allowed the reassignment of pixels belonging to this formation and wrongly classified as LeuPi. These vegetation typologies are characterized by partially coincident spectral signatures having similar physiognomies, coverage and biomass production, and being located in the upper mountain belt. However, since LeuPi can be found only above 1300 m, cells assigned to this class and situated below 1300 m were reassigned to TrCep. In the second case, the application of another filter allowed us to correct the misclassification of pixels belonging to TrCep, wrongly assigned to CoeHy. The similarity in the spectral response of the two typologies was again due to their analogous characteristics, both showing dense coverage and generating thick and sometimes inaccessible formations in the high mountains. In spite of this, it is possible to identify a lower limit for CoeHy at an altitude of 1100 m. Therefore, the second postclassification filter reassigned to TrCep those CoeHy pixels below 1100 m. 3.3.5.Accuracy assessmentThe accuracy of the classification was evaluated through comparison with a set of test areas selected from independent field observations conducted between February and December 2010. Each test area was obtained by converting the corresponding georeferenced relevé to raster with a 10 m buffer. The accuracy assessment consisted of overlaying the test set and the classified map to compare the classification of each map cell with its corresponding reference pixel, and computing the number of correct and incorrect assignments.6,41 This operation was carried out in GRASS through the module r.kappa,33,39 a variant of the statistics extraction facility (r.stats), using the comparison functionality to generate confusion matrices. In this way, it was possible to evaluate the percentage accuracy of the overall map and of each class, as well as to identify the type of errors incurred and discuss the relative causes and/or hypothesize postclassification solutions (see Sec. 4.2). To evaluate the significance of single-class spectral signatures for identifying the homogeneous subsets distinguishable in the distribution of this dataset, a two-way (vegetation classes, spectral bands) analysis of variance (ANOVA) and a post hoc test [Tukey’s honestly significant difference (HSD)] were executed. The halophytic communities (halveg), whose spectral response is influenced by the high level of sand in soil, and the woodlands BoswE, characterized by low cover, not comparable with other woody formations, were excluded from this analysis. In order to discuss the spectral features of the mapped plant communities, the mean (), minimum, and maximum pixel values of each vegetation class in the five bands of the RapidEye image were extracted in GRASS through the module r.statistics, dedicated to spatial statistics.33,39 In addition, the normalized difference vegetation index (NDVI) was calculated with r.mapcalc,33,39 and the same statistics were computed as described before. 4.Results and DiscussionThe application of two different classification methods resulted in two versions of the vegetation map, both characterized by a dominance of Croton socotranus shrublands. The ML classification, owing to the independent assignment of single cells, is characterized by a high number of isolated pixels, while the GMD–SMAP methodology produced a continuous and homogeneous representation of the plant communities, with fine detail and remarkable precision in mapping the intricate vegetation mosaic of the Haggeher mountains (Fig. 3). 4.1.Distinction Between Spectral SignaturesFrom an initial dataset comprising 26 vegetation classes, only 19 significantly different groups (Table 1) were recognized by ANOVA and Tukey’s HSD post hoc test. Some spectral signatures (e.g., ComSt and CrSar) tend to overlay with others, owing to the similarity of the corresponding vegetation communities or to their heterogeneous cover. In the graphs reporting the mean, minimum, and maximum values (numerical pixel values of the considered band) of the spectral response of these classes [Fig. 4(a) and 4(b)], the wide range of variability in one or more bands is evident. In particular, a high range of values in the red band, related to the absorption of photosynthetically active radiation (PAR), can be connected to the heterogeneous cover shown by the corresponding plant community in different contexts. This can be observed in the red band both for ComSt (), forming dense woods in the sheltered ravines near water courses, while notably clearer and scattered in exposed areas near to the coast, and CrSar (), with shrubland sometimes closed and associated to an abundant presence of other shrub species, sometimes open and with herbaceous communities like HeCon, or also very scattered on bare rocky substrata. Another cause of overlap lies in the similar trends observed in the spectral response of some classes, such as CrSar and DracC [Fig. 4(c)]. The overlay of the two signatures is due to the local spatial mixture of these communities.24 The errors herein described are due to the incapacity of the classic methodology to distinguish between subclasses,5,16 resulting in an increase of range in spectral signatures and, therefore, in high probabilities of overlap and misclassification. Moreover, the independent assignment of single pixels operated by the ML classification is not able to distinguish mosaicked formations, generating further errors, causing this classification method to be less accurate.5,16,34 Table 1Single-class spectral signatures grouped in homogeneous subsets on the basis of the post hoc test (Tukey’s HSD) performed after two-way ANOVA. The significance related to every subset is reported in the last row.
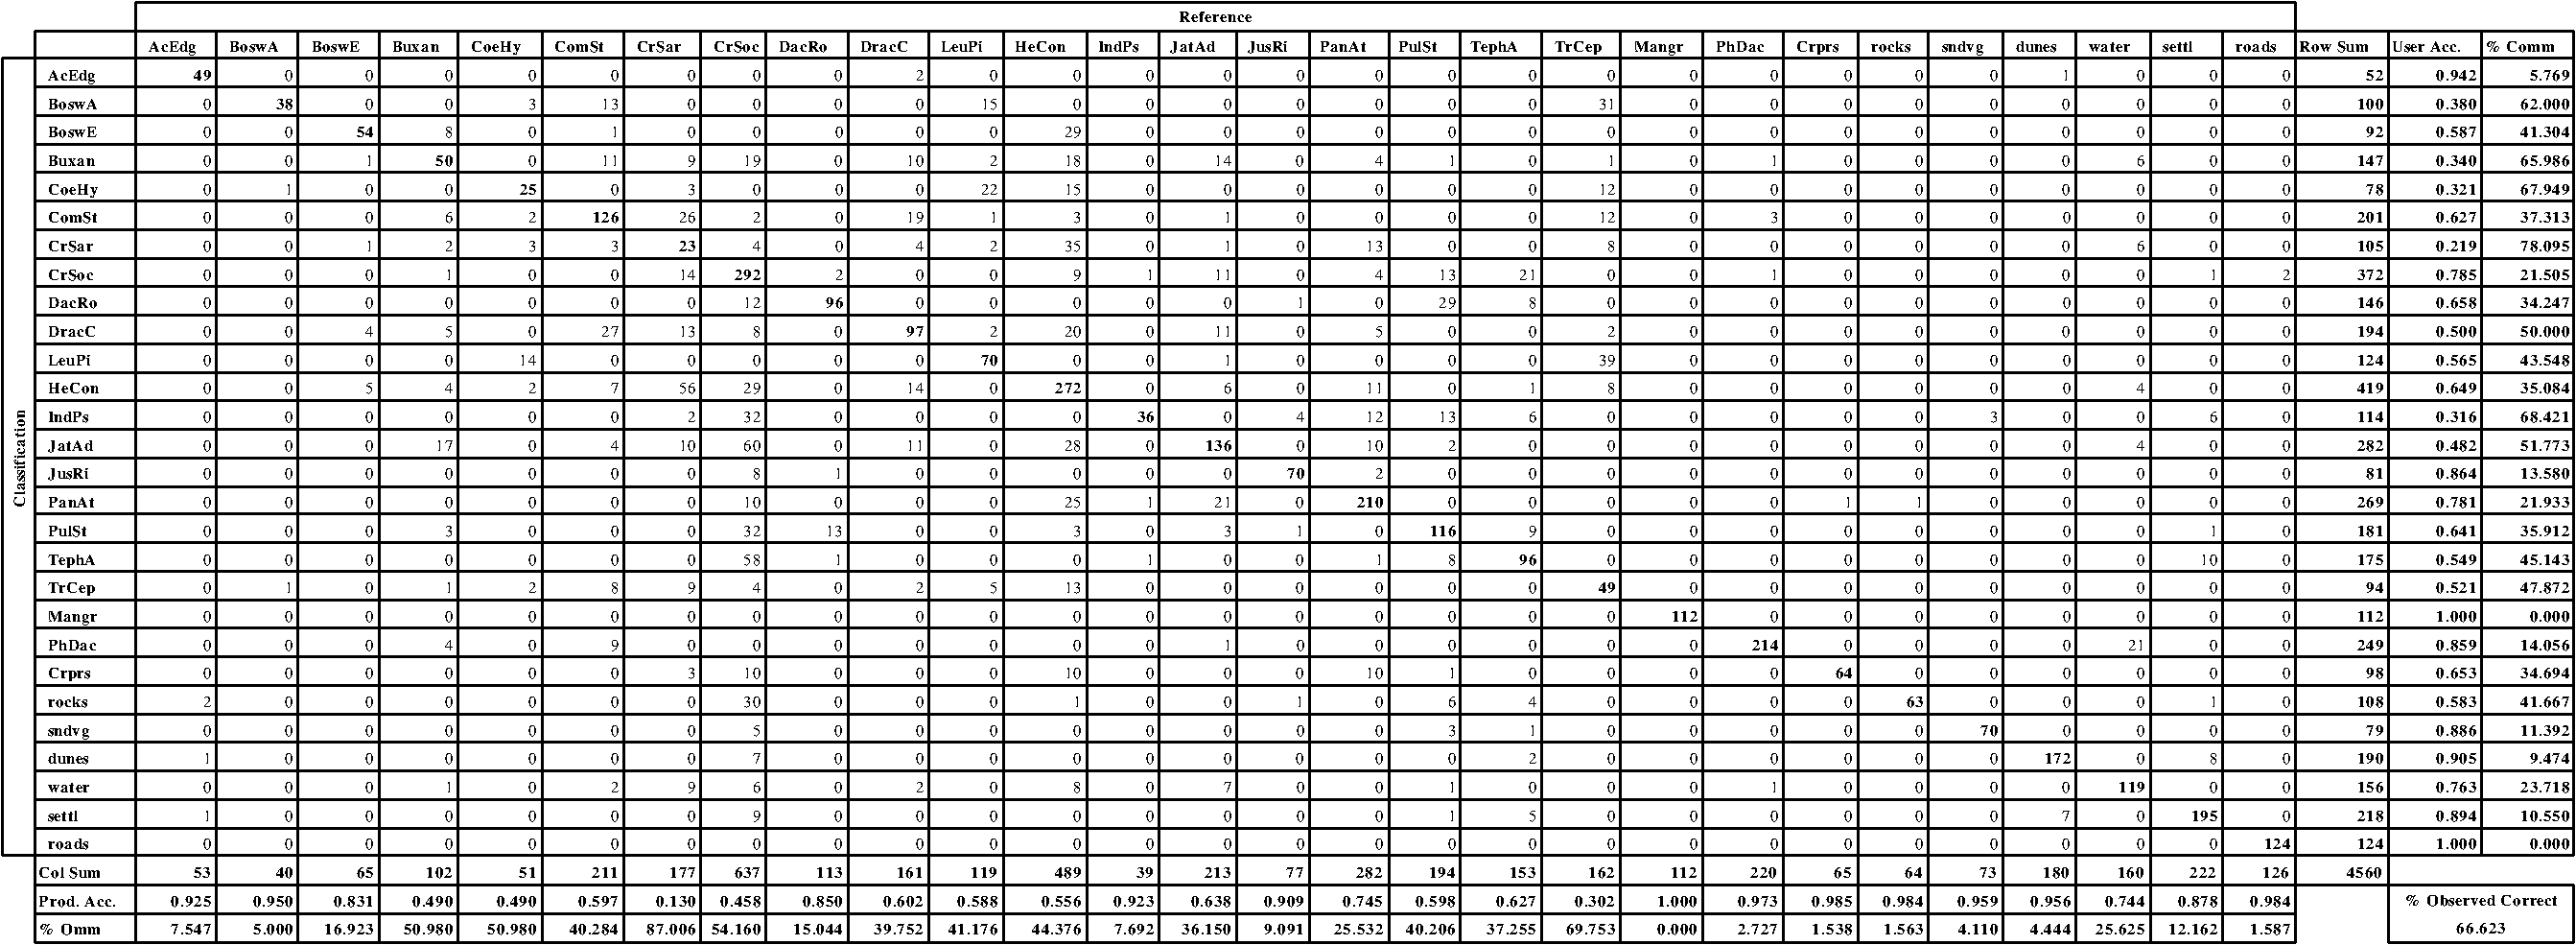
Fig. 4Single-class spectral signatures of some classes of the vegetation map. The first two graphs show the mean, minimum, and maximum values of the spectral response in the various bands of the satellite images for classes ComSt (a) and CrSar (b). The strong similarity in the reflectance of classes CrSar and DracC is shown in graph (c). 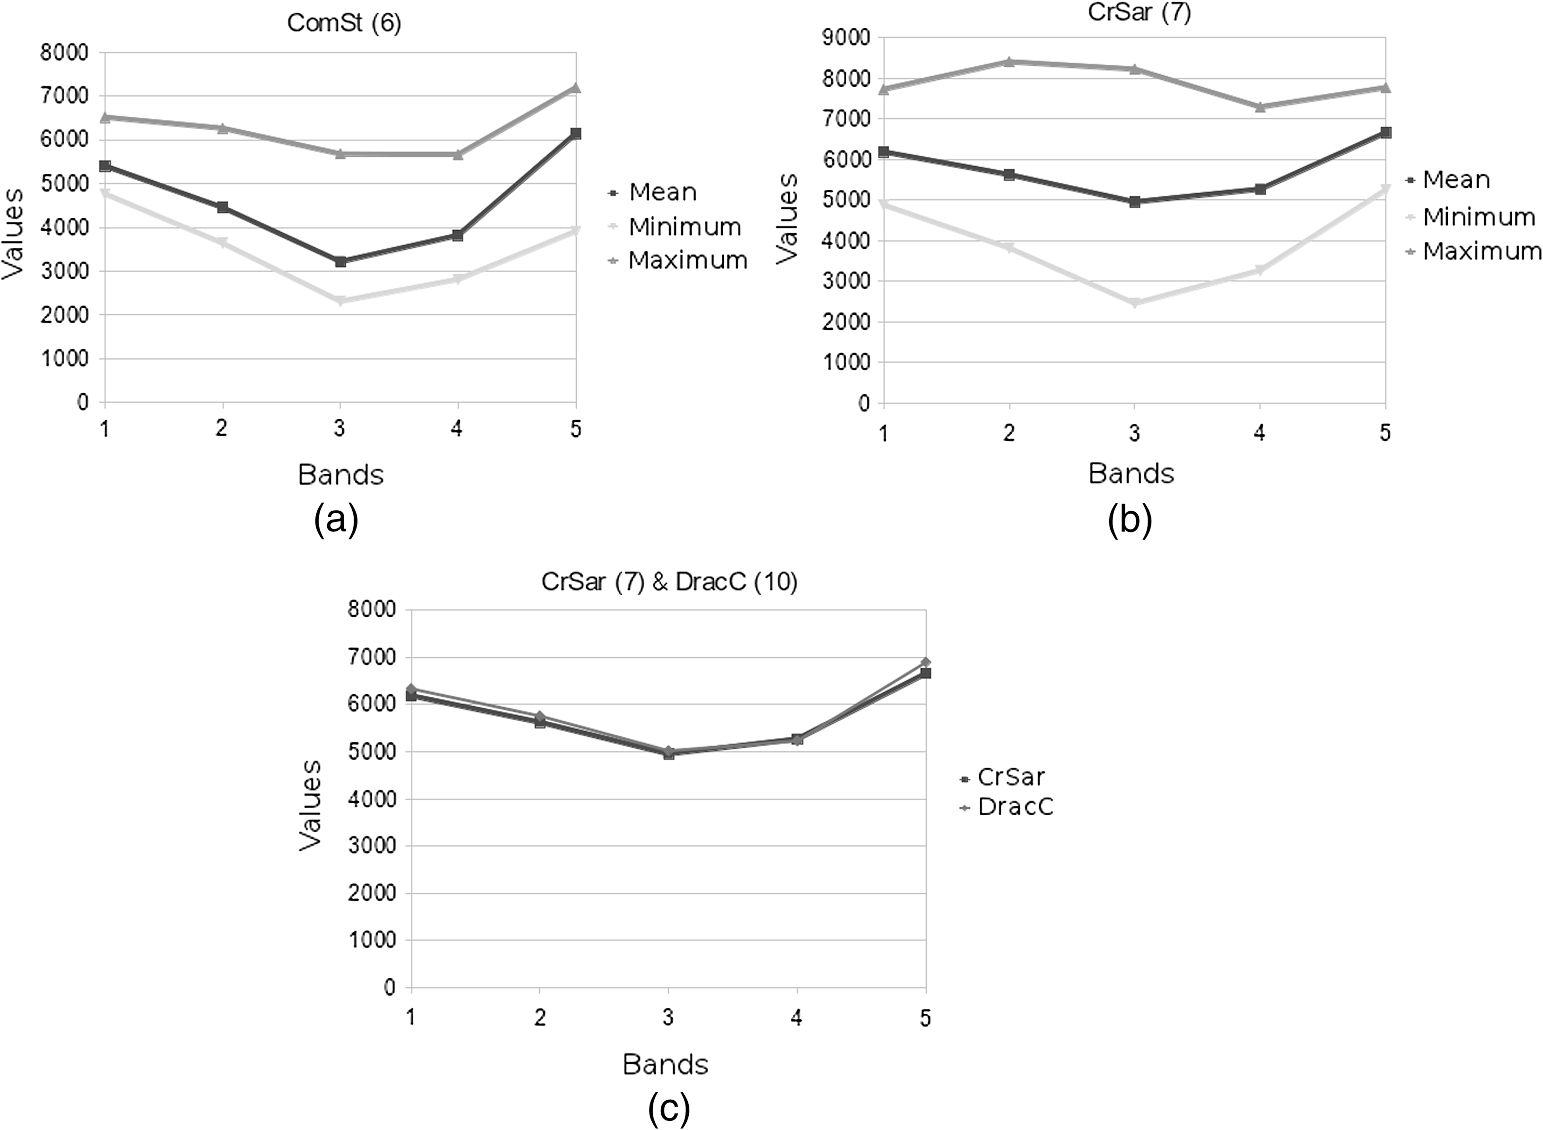 The application of the GMD model for the extraction of spectral signatures allowed us to identify and describe a variable number of subclasses for heterogeneous formations (Fig. 5). Two subsignatures were recorded for ComSt [Fig. 5(a)], five for CrSar and CrSoc [Fig. 5(b) and 5(c)], and four for HeCon and PanAt grasslands [Fig. 5(d) and 5(e)]. These subsets represent additional information that gets lost with the extraction of single-class signatures, but proves to be effective in increasing the classification accuracy, as earlier observed.5,16 It is interesting to see how some of the subclasses show a very high value in the red band, representing poor or disturbed variants, observable in the field but not described by single signatures [Fig. 5(c) and 5(e)]. Multiclass signatures, more complete and accurate, allow the distinction between different coverages and compositions of heterogeneous formations, resulting in a significantly superior accuracy of the classified map. 4.2.Map AccuracyThe confusion matrices computed for the accuracy assessment of the classified maps are shown in Tables 2 and 3. The final accuracy represents the most evident and meaningful difference between the two classification methods applied. Table 2Confusion matrix generated for the accuracy assessment of the map produced with the ML classification method.
Table 3Confusion matrix generated for the accuracy assessment of the map produced with the SMAP classification method.
Consistent with earlier findings,5,16,17,38 SMAP proved to be notably more effective in representing the extreme variability and patchiness characterizing the vegetation of Socotra. This methodology reached an overall 21.3% greater accuracy (Table 3) than the ML method, which incurred high levels of misclassification between similar or contiguous plant communities,9,17 alongside elevated percentages of commission and/or omission of the most heterogeneous typologies (Table 2). An example is represented by the high level of error observed in the classification of CrSar shrublands (, ). As explained before, the different coverages shown by this formation cause excessive amplitude of its spectral signature, resulting in a loss of significance and information. Consequently, the class is easily confused with others, as happens with HeCon, dynamically linked to CrSar, and with DracC. The herbaceous communities, on the other hand, are often present under a variety of ecologically different contexts.24 HeCon, for example, is widespread on granitic and calcareous substrata, from the lower highlands to the mountain top, where it alternates with woodlands and shrublands in a complex mosaic. These situations cause the overlay of spectral signatures, and at the same time the coincidence of environmental parameters does not allow applications of postclassification filters. A similar situation can be observed for the woodlands and shrublands of the Haggeher mountains. Misclassifications are notably high in these typologies (e.g., TrCep, ), even if in some cases postclassification correction is possible. These errors and information losses cause the classification accuracy to be . The SMAP method, based on multiclass signatures and on a sequential segmentation for the classification process, proves to be more effective in representing such a heterogeneous vegetation mosaic, avoiding at the same time an excessive fragmentation of the map and, therefore, reducing information losses and misclassifications.5,16 This results in a marked increase in the final accuracy (Table 3) of the map produced (producer’s accuracy), particularly for the classes mistook by the ML method (). The final accuracy reached exceeds 87%, a satisfying result in light of the high number of classes considered and the heterogeneity of their coverage and environmental patterns. The application of postclassification filters allowed for an increase in the accuracy level (by 5%) to the values reported above. 4.3.Spectral Features of the Mapped ClassesThe analysis of the spectral features of the mapped classes reveals differences in landscape structure, canopy cover, biomass production, and disturbance regime of the corresponding vegetation communities. Table 4 shows the minimum, maximum, and mean () pixel values for each spectral band, and the NDVI values of each vegetation community represented in the produced map. Table 4Pixel values in the five spectral bands of RapidEye image and NDVI values of the vegetation classes included in the produced map. Minimum, maximum, and mean (±standard deviation) values are reported.
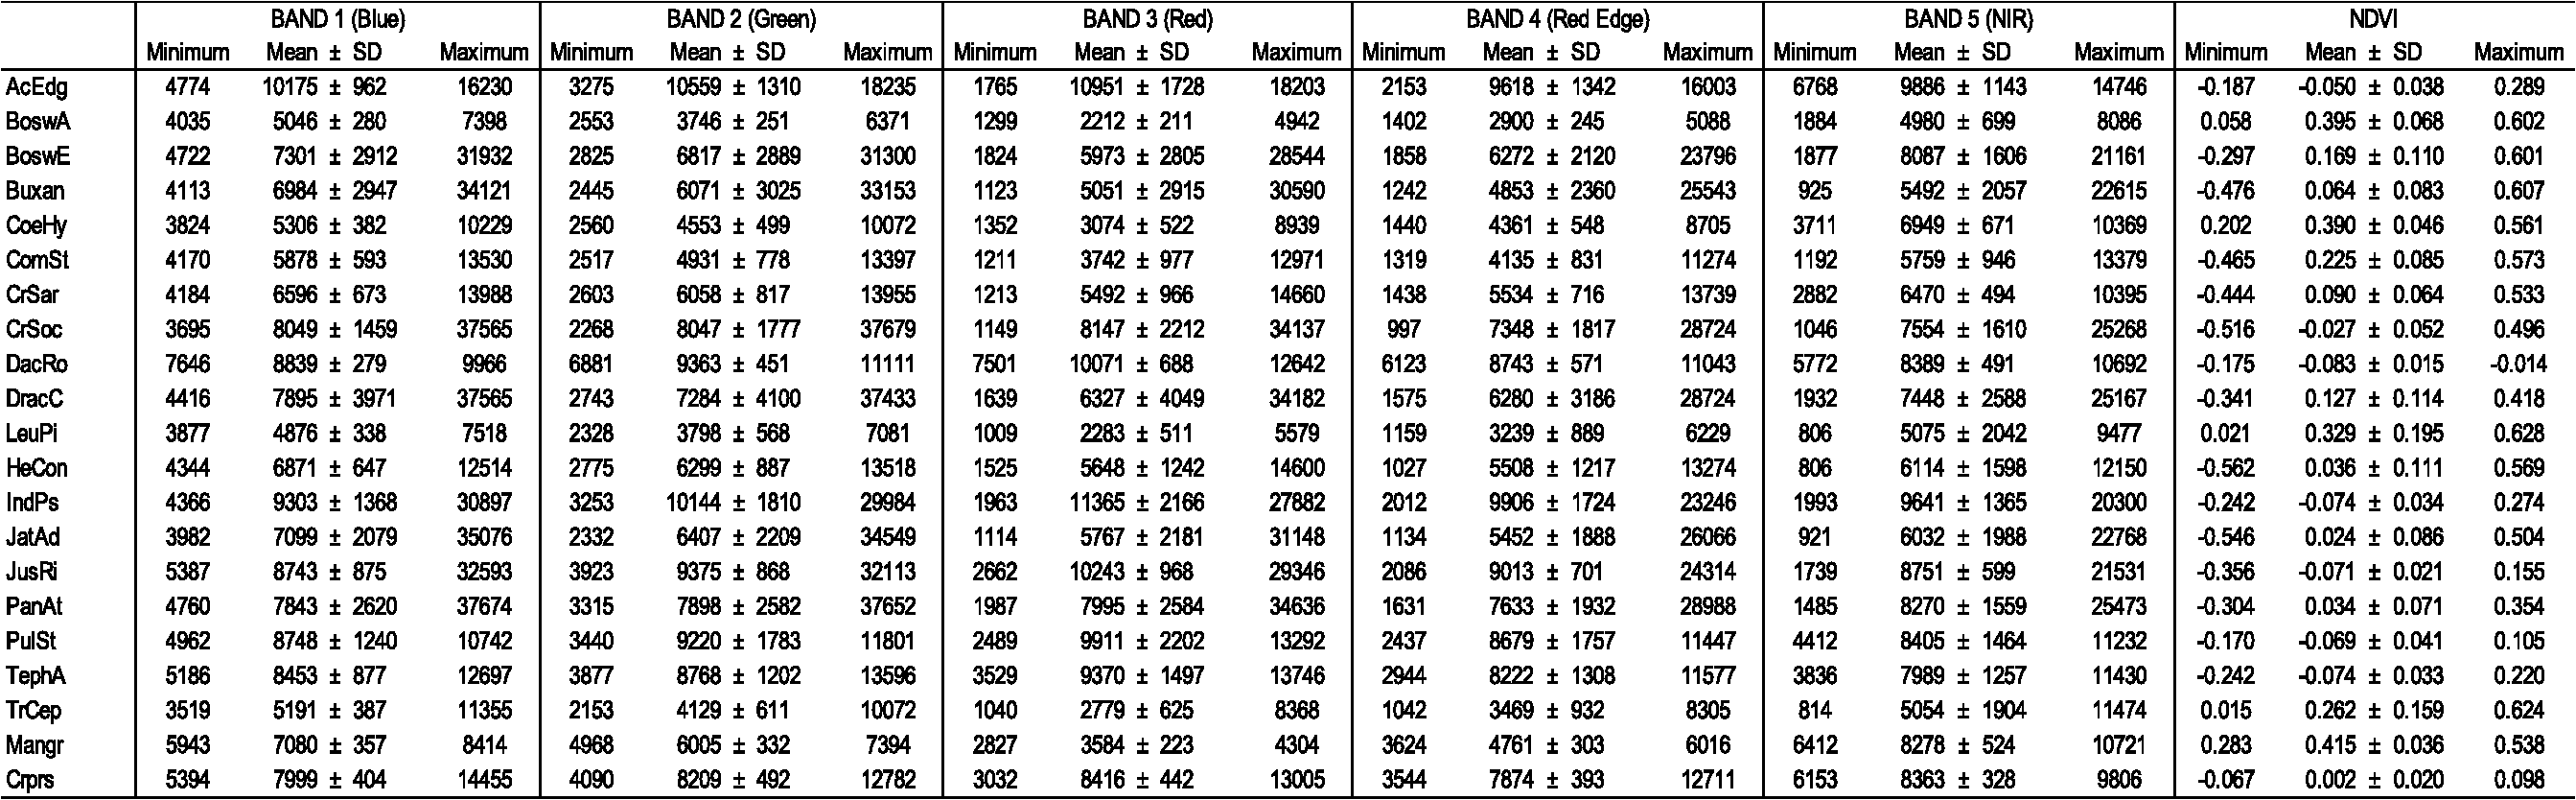
The red band values are correlated to the absorption of PAR and influenced by the abundance of bare soil substrate.6,28 Consistent with the described characteristics of the analyzed plant communities,21,24 the vegetation classes with the most scattered cover and the poorest biomass production show high values in the red wavelengths; this is the case of AcEdg, DacRo, IndPs, PulSt, TephA, and Crprs. In particular, the low standard deviation associated with these high values highlights the constant semi-desertic character of DacRo grasslands and JusRi dwarf shrublands, among the communities with lowest cover and highest percentage of bare soil on the island.24 Conversely, classes LeuPi, CoeHy, and TrCep have the lowest mean pixel values, dispersion, and standard deviation in the red band. In fact, these woodlands and shrublands forming the mountain vegetation mosaic of the Haggeher massif are characterized by a close and continuous cover, and represent the most dense communities of the island.21,24 Similar characteristics can be observed for Boswellia ameero woodlands, which show the same trend in the red band values.24,27 A particular case among woodlands is represented by DracC, characterized by the highest standard deviation of pixel values in this band. This is due to the high heterogeneity that can be observed in the cover of Dracaena cinnabari woodlands;20,24,26 these communities are close and continuous (often linked with Leucas haggiriensis and Pittosporum viridiflorum shrublands) on the central granite massif, but show a scattered cover on the limestone plateaux, which are often related to Croton sarcocarpus shrublands (CrSar). Similar trends can be observed for CrSoc, JatAd, and BoswE, both characterized by a high variability in structure and canopy cover.24,27 In particular, Croton socotranus shrublands, the most widespread vegetation class in Socotra, has the most wide range of structures and covers, influenced by morphology, microclimate, and disturbance regime.21,24 Among herbaceous communities, the high dispersion and standard deviation of pixel values in the red band for PanAt can be related to the differences in canopy cover due to the uneven spatial distribution of disturbance brought by livestock (location of settlements, transhumance, etc.).19,20,22,24 The other important pasture in Socotra, HeCon grasslands, has lower red values and dispersion; this is probably due to the fact that this community comprehends the high mountain grasslands, which are subject to a lower disturbance regime.19,20,22,24 The described trends can be observed more accurately by analyzing the pixel values of the Red Edge band. This band has been observed to be correlated with chlorophyll concentration while being insensitive to soil background and atmospheric effects.28,31 As a matter of fact, the dispersion and standard deviation of Red Edge pixel values are lower than in the red band, since the influence of the variability in canopy cover can be considered as not significant. It is worth noting that the highest mean pixel values in this range are related to the most disturbed herbaceous communities. In fact, Red Edge has also been used to evaluate N status of crops and grasslands.28,32 Among the mapped classes, this band highlights the heavy disturbance regime affecting DacRo, IndPs, and TephA grasslands, as well as JusRi and PulSt dwarf shrublands.20,21,24 In particular, as a consequence of the overwhelming grazing pressure, TephA and PulSt communities are dominated by aromatic, unpalatable plants, while JusRi, IndPs, and DacRo formations are characterized by species with spiny, coriaceous leaves and/or intricate stems.24 The near-infrared (NIR) band is also associated to photosynthetic activity, particularly for the difference between the values in this wavelength and those of the red band.2,6,28 To facilitate the identification of the most productive plant communities of Socotra Island, NDVI has been calculated for each of the mapped classes based on red and NIR spectral bands (Table 4). The reported values strongly highlight the profound difference in biomass production between the vegetation typologies of Socotra. Consistent with literature data, field observations, and above considerations, the richest classes are represented by the woodlands and shrublands of Haggeher mountains.21,24 Among these, CoeHy shows the highest NDVI values, followed by LeuPi and TrCep. As previously remarked, these communities form landscapes characterized by the most dense vegetation on the island, favored by the lower aridity (due to orographic rainfall and fog condensation) and deeper soils present on the granite massif.21,22 BoswA woodlands, also located on Haggeher mountains, have similar characteristics, and despite being less thick, their biomass production per individual is higher.24,27 These NDVI values are exceeded only by Mangr, the most luxuriant vegetation community on the island.21,24 The lower NDVI (with high dispersion and standard deviation) observed for other woodlands (ComSt, DracC, BoswE) and shrublands (CrSoc, CrSar, JatAd) is due to the heterogeneous structures and covers characterizing the related formations in different environmental contexts, as explained before in Refs. 21 and 24. Low NDVI values (just above zero) also characterize the two most important pastures of the island, HeCon and PanAt grasslands, emphasizing the scarcity of forage resource and the high risk of overgrazing for the pastoral systems of Socotra Island.19,20,21 The lowest (often below zero) NDVI values stress the poor biomass production and canopy cover of the most disturbed and semi-desertic communities of the island: AcEdg, DacRo, IndPs, PulSt, TephA, and Crprs.20,21,24 It is also worth highlighting that at the time of acquisition of the satellite images, these herbaceous communities had already been subject to livestock grazing; thus the canopy cover was not at its maximum level. 5.ConclusionsA detailed vegetation map of Socotra Island (Fig. 3) was produced through the classification of high-resolution satellite images on the basis of classified vegetation surveys. This methodology allowed for the production of a map representing the spatial distribution of plant communities on the island, identified on an ecological and phytosociological basis, and mapped with a segmentation method. The georeferenced vegetation relevés acted as a reference for spectral signature extraction and RS image classification through two methodologies, whose effectiveness was compared through the accuracy assessment of the classified maps. The spectral responses of the various classes, with particular regard to the subsignatures extracted through the GMD method, seem coherent with the ecological and physiognomical characteristics of the corresponding plant communities. Nevertheless, the single-class signatures also provided useful information for the identification of natural similarity between different classes and inaccuracies in the training points in the preliminary phases of this study. Information on the ecological characteristics of the plant communities allowed the application of different filters to distinguish between similar spectral signatures and reduce the commission and omission errors. Postclassification processing allowed for a further increase in the confidence of the map. The SMAP classification method, with an accuracy of 87%, proved to be capable of reflecting the heterogeneity of the vegetation cover, mitigating class confusion, and transposing onto the map the mosaicked landscape configuration, avoiding excessive fragmentation. The ML classification method generated a patchy map, less precise in the identification and distinction of contiguous and mixed formations, and 20% less accurate than SMAP. These results suggest that, even if more difficult to apply (owing to data precision and time demands), the GMD–SMAP method better adapts to complex vegetation landscapes than the statistical ML approach. The combined approach adopted in this study allowed to benefit from all the methodologies applied, each useful in their own ways, even if differing in effectiveness, to obtain useful data for the description of the considered vegetation classes. The analysis and discussion of the spectral features of the mapped classes is consistent with field observations and literature information about the characteristics of the corresponding vegetation communities. This represents a further confirmation of the ecological accuracy obtained in mapping the heterogeneous arid environments of Socotra through the described approach. For all the above considerations, the produced map (Fig. 3) can be considered as the final version of the vegetation map of Socotra Island and will provide a valuable knowledge base and reference for planning future conservation and sustainable development initiatives aimed to protect the unique biodiversity of Socotra. AcknowledgmentsThis research was supported by the General Directorate for Development Co-operation (Italian Development Co-operation) and the Government of Yemen (Cudarat project—AID 9064). Our thanks go to the project manager Andrea Mao and to all the technical and institutional staff who made the project, and therefore this study, possible. A particular mention goes to the Botany Unit members Ahmed Issa, Fahmi Abdulla, and Abdulwhab Saad. ReferencesA. W. KüchlerI. S. Zonneveld, Vegetation Mapping, Dr W. Junk, Dordrecht, NL
(1988). Google Scholar
X. M. Xiaoet al.,
“Modeling gross primary production of temperate deciduous broadleaf forest using satellite images and climate data,”
Remote Sens. Environ., 91
(2), 256
–270
(2004). http://dx.doi.org/10.1016/j.rse.2004.03.010 RSEEA7 0034-4257 Google Scholar
C. Heet al.,
“Zoning grassland protection area using remote sensing and cellular automata modelling, a case study in Xilingol steppe grassland in northern China,”
J. Arid Environ., 63
(4), 814
–826
(2005). http://dx.doi.org/10.1016/j.jaridenv.2005.03.028 JAENDR 0140-1963 Google Scholar
S. K. LangleyH. M. CheshireK. S. Humes,
“A comparison of single date and multitemporal satellite image classifications in a semi-arid grassland,”
J. Arid Environ., 49
(2), 401
–411
(2001). http://dx.doi.org/10.1006/jare.2000.0771 JAENDR 0140-1963 Google Scholar
D. G. GavinF. S. Hu,
“Bioclimatic modelling using Gaussian mixture distributions and multiscale segmentation,”
Glob. Ecol. Biogeogr., 14
(5), 491
–501
(2005). http://dx.doi.org/10.1111/geb.2005.14.issue-5 GEBIFS 1466-8238 Google Scholar
Y. XieZ. ShaM. Yu,
“Remote sensing imagery in vegetation mapping: a review,”
J. Plant Ecol., 1
(1), 9
–23
(2008). http://dx.doi.org/10.1093/jpe/rtm005 1752-9921 Google Scholar
M. L. NordbergJ. Evertson,
“Vegetation index differencing and linear regression for change detection in a Swedish mountain range using Landsat TM and ETM+ imagery,”
Land Degrad. Dev., 16
(2), 139
–149
(2003). 1085-3278 Google Scholar
O. Z. AkashehC. M. U. NealeH. Jayanty,
“Detailed mapping of riparian vegetation in the middle Rio Grande River using high resolution multi-spectral airborne remote sensing,”
J. Arid Environ., 72
(9), 1734
–1744
(2008). http://dx.doi.org/10.1016/j.jaridenv.2008.03.014 JAENDR 0140-1963 Google Scholar
K. KràlJ. Pavlis,
“The first detailed land-cover map of Socotra Island by Landsat/ETM + data,”
Int. J. Remote Sens., 27
(15), 3239
–3250
(2006). http://dx.doi.org/10.1080/01431160600646557 IJSEDK 0143-1161 Google Scholar
H. SchmidtA. Karnieli,
“Remote sensing of the seasonal variability of vegetation in a semi-arid environment,”
J. Arid Environ., 45
(1), 43
–59
(2000). http://dx.doi.org/10.1006/jare.1999.0607 JAENDR 0140-1963 Google Scholar
C. Leprieuret al.,
“Monitoring vegetation cover across semi-arid regions: comparison of remote observations from various scales,”
Int. J. Remote Sens., 21
(2), 281
–300
(2000). http://dx.doi.org/10.1080/014311600210830 IJSEDK 0143-1161 Google Scholar
Z. JiangJ. LiW. Dou,
“The impact of spatial resolution on NDVI over heterogeneous surface,”
in Proc. of 2005 IEEE Int. Geoscience and Remote Sensing Symp.,
1310
–1313
(2005). Google Scholar
P. S. Laris,
“Spatiotemporal problems with detecting and mapping mosaic fire regimes with coarse-resolution satellite data in savanna environments,”
Remote Sens. Environ., 99
(4), 412
–424
(2005). http://dx.doi.org/10.1016/j.rse.2005.09.012 RSEEA7 0034-4257 Google Scholar
H. NagendraD. Rocchini,
“High resolution satellite imagery for tropical biodiversity studies: the devil is in the detail,”
Biodivers. Conserv., 17
(14), 3431
–3442
(2008). http://dx.doi.org/10.1007/s10531-008-9479-0 BONSEU 0960-3115 Google Scholar
M. HillG. AsnerA. Held,
“The bio geophysical approach to remote sensing of vegetation in coupled human environment systems—societal benefits and global context,”
J. Spat. Sci., 51
(2), 49
–66
(2006). http://dx.doi.org/10.1080/14498596.2006.9635081 1449-8596 Google Scholar
A. H. EhsaniF. Quiel,
“Efficiency of Landsat ETM+ thermal band for land cover classification of the biosphere reserve ‘Eastern Carpathians’ (central Europe) using SMAP and ML algorithms,”
Int. J. Environ. Res., 4
(4), 741
–750
(2010). IJERHR 1735-6865 Google Scholar
D. B. MichelsonM. B. LiljebergP. Pilesjö,
“Comparison of algorithms for classifying Swedish landcover using Landsat TM and ERS-1 SAR data,”
Remote Sens. Environ., 71
(1), 1
–15
(2000). http://dx.doi.org/10.1016/S0034-4257(99)00024-3 RSEEA7 0034-4257 Google Scholar
A. Guilletet al.,
“Systemic spatial decision support systems: an integrated, computer aided tool for biodiversity conservation,”
Plant Biosyst., 146
(4), 814
–826
(2012). http://dx.doi.org/10.1080/11263504.2012.740087 1126-3504 Google Scholar
P. ScholteA. Al-OkaishiA. Saed,
“When conservation precedes development: a case study of the opening up of the Socotra archipelago,”
Oryx, 45
(3), 401
–410
(2011). http://dx.doi.org/10.1017/S0030605310001535 0030-6053 Google Scholar
K. Van DammeL. Banfield,
“Past, and present human impacts on the biodiversity of Socotra Island (Yemen): implications for future conservation,”
Zool. Middle East,
(Supplementum 3), 31
–88
(2011). http://dx.doi.org/10.1080/09397140.2011.10648899 ZMEAEB 0939-7140 Google Scholar
A. G. MillerM. Morris, Ethnoflora of the Soqotra Archipelago, Royal Botanical Garden, Edinburgh, UK
(2004). Google Scholar
P. ScholteP. De Geest,
“The climate of Socotra Island (Yemen): a first-time assessment of the timing of the monsoon wind reversal and its influence on precipitation and vegetation patterns,”
J. Arid Environ., 74
(11), 1507
–1515
(2010). http://dx.doi.org/10.1016/j.jaridenv.2010.05.017 JAENDR 0140-1963 Google Scholar
I. B. Balfour, The Botany of Sokotra, Transactions of the Royal Society of Edinburgh, Edinburgh, UK
(1888). Google Scholar
M. De Sanctiset al.,
“Classification and distribution patterns of plant communities on Socotra Island, Yemen,”
Appl. Veg. Sci., 16
(1), 148
–165
(2013). http://dx.doi.org/10.1111/avsc.2012.16.issue-1 1402-2001 Google Scholar
A. S. Senanet al.,
“Determinants of plant species invasions in an arid island: evidence from Socotra Island (Yemen),”
Plant Ecol., 213
(9), 1381
–1392
(2012). http://dx.doi.org/10.1007/s11258-012-0098-1 1385-0237 Google Scholar
F. Attorreet al.,
“Will dragonblood survive the next period of climate change? Current and future potential distribution of Dracaena cinnabari (Socotra, Yemen),”
Biol. Conservat., 138
(3), 430
–439
(2007). http://dx.doi.org/10.1016/j.biocon.2007.05.009 BICOBK 0006-3207 Google Scholar
F. Attorreet al.,
“Developing conservation strategies for endemic tree species when faced with time and data constraints: Boswellia spp. on Socotra (Yemen),”
Biodivers. Conserv., 20
(7), 1483
–1499
(2011). http://dx.doi.org/10.1007/s10531-011-0039-7 BONSEU 0960-3115 Google Scholar
J. U. H. Eitelet al.,
“Using in-situ measurements to evaluate the new RapidEye satellite series for prediction of wheat nitrogen status,”
Int. J. Remote Sens., 28
(18), 4183
–4190
(2007). http://dx.doi.org/10.1080/01431160701422213 IJSEDK 0143-1161 Google Scholar
M. KrischkeW. NiemeyerS. Scherer,
“RapidEye: satellite based geo-information system,”
Acta Astronautica, 46
(2), 307
–312
(2000). http://dx.doi.org/10.1016/S0094-5765(99)00219-2 AASTCF 0094-5765 Google Scholar
RapidEye AG, “Rapideye standard image products specifications,”
(2011) rapideye.net/upload/RE_Product_Specifications_ENG.pdf April ). 2011). Google Scholar
G. A. Blackburn,
“Quantifying chlorophylls and carotenoids at leaf and canopy scales: an evaluation of some hyperspectral approaches,”
Remote Sens. Environ., 66
(3), 273
–285
(1998). http://dx.doi.org/10.1016/S0034-4257(98)00059-5 RSEEA7 0034-4257 Google Scholar
E. Zillmannet al.,
“Assessment of cereal nitrogen requirements derived by optical on-the-go sensors on heterogeneous soils,”
Agron. J., 98
(3), 682
–690
(2006). http://dx.doi.org/10.2134/agronj2005.0253 AGJOAT 0002-1962 Google Scholar
Grass GIS 6.4 reference manual, OpenSource Geospatial Foundation, Vancouver, CA
(2011). http://grass.osgeo.org/grass64/manuals/ Google Scholar
A. C. Bouman,
“CLUSTER: an unsupervised algorithm for modelling Gaussian mixtures,”
(2011) https://engineering.purdue.edu/~bouman/software/cluster/manual.pdf October ). 2011). Google Scholar
J. D. McCauleyB. A. Engel,
“Comparison of scene segmentations: SMAP, ECHO and maximum likelihood,”
IEEE Trans. Geosci. Remote Sens., 33
(6), 1313
–1316
(1995). http://dx.doi.org/10.1109/36.477185 IGRSD2 0196-2892 Google Scholar
J. Besag,
“On the statistical analysis of dirty pictures,”
J. R. Stat. Soc., 48 259
–302
(1986). 0952-8385 Google Scholar
A. C. BoumanB. Liu,
“Multiple resolution segmentation of textured images,”
IEEE Trans. Pattern Anal. Mach. Intell., 13
(2), 99
–113
(1991). http://dx.doi.org/10.1109/34.67641 ITPIDJ 0162-8828 Google Scholar
A. C. BoumanM. Shapiro,
“A multiscale random field model for Bayesian image segmentation,”
IEEE Trans. Image Process., 3
(2), 162
–177
(1994). http://dx.doi.org/10.1109/83.277898 IIPRE4 1057-7149 Google Scholar
M. Neteleret al.,
“GRASS GIS: a multi-purpose open source GIS,”
Environ. Model. Softw., 31 124
–130
(2012). http://dx.doi.org/10.1016/j.envsoft.2011.11.014 EMSOFT 1364-8152 Google Scholar
M. ShapiroJ. Westervelt,
“R.MAPCALC: an algebra for GIS and image processing,”
(1992). Google Scholar
R. G. Congalton,
“A review of assessing the accuracy of remotely sensed data,”
Remote Sens. Environ., 37
(1), 35
–46
(1991). http://dx.doi.org/10.1016/0034-4257(91)90048-B RSEEA7 0034-4257 Google Scholar
Biography Luca Malatesta is a plant ecologist working in the fields of environmental conservation and systemic land use planning. He collaborated with international cooperation projects in Socotra Island (Yemen) for pastoral systems management, (semi-)arid grasslands biodiversity conservation, and thematic cartography. His scientific interests focus on vegetation description, analysis and mapping, conservation of endangered species and ecosystem services and functions, arid and semi-arid ecosystems management in face of livestock grazing and climate change.  Fabio Attorre is a plant ecologist whose activity is mainly focused on international cooperation projects aimed at conservation, sustainable development, and systemic land use planning. His wide experience in this field has been acquired through several projects in Europe (Italy, Albania), Africa (Kenia, Mozambique, South Africa, Niger), South America (Galapagos), Middle-East (Socotra, Yemen), and Asia (India). He works in the fields of conservation of endangered species, climate change, and impact of alien and invasive species on vulnerable habitats.  Alfredo Altobelli is an ecologist working in the fields of ecosystems analysis, geographic information systems, remote sensing, and thematic cartography. His scientific interest focuses on vegetation description and mapping, environmental monitoring and conservation, forest management and land use planning, and analysis of the effects of climate change and human activities on ecosystem services.  Ahmed Adeeb is a botanist at the Environmental Protection Authority (EPA) of Socotra (Yemen). He collaborates with conservation and sustainable development projects in Socotra Island since 2004 and acquired a wide knowledge of Socotran flora. His interest mainly focuses on the description of the vegetation communities of the archipelago and on the collection of seeds for ex situ conservation and reintroduction of endangered plant species. He is the manager of the EPA Socotra endemic plants nursery in Hadibo.  Michele De Sanctis is a botanist with a wide knowledge of the vegetation of Mediterranean and Eritrean-Arabian areas. He worked in conservation and development projects in Europe (Italy, Albania) and Middle-East (Socotra, Yemen). His researches are aimed at vegetation description and classification, as well as at monitoring and conservation of endangered plant species and habitats.  Nadim M. Taleb is a plant ecologist at the EPA of Socotra (Yemen). He collaborates with conservation and sustainable development projects in Socotra Island since 2004 and finished his PhD at Sapienza–University of Rome with a thesis on the conservation of endemic Boswellia species on Socotra. His interest mainly focuses on the description and analysis of vegetation communities and population dynamics of endangered plant species.  Paul T. Scholte is a plant ecologist with a wide experience in conservation and development programs in both Middle-East (Yemen and Socotra) and Central Africa (Cameroon, Chad, Ruanda). His scientific interest focuses on vegetation dynamics determined by the interaction among rangeland management, climate change, and wildlife and livestock grazing.  Marcello Vitale is an ecologist working in the fields of quantitative ecology and environmental modeling for conservation and sustainable development in the context of international cooperation programs (Mozambique, Socotra, Italy). His scientific works are mainly aimed at the development of predictive models concerning the sustainable use of lands, taking into consideration ecosystem services, subsystems and their inter-relationships, climate and climate change, future social and economic necessities. |