|
|
1.IntroductionCoastline is one of the most important linear features on the Earth’s surface,1 where land meets the ocean. Coastal zones are important because a majority of the world’s population inhabit in these areas. Coastal zones also face many human-induced environmental impacts. Therefore, coastline modification by humans has become a growing concern worldwide. Coastal zone and its environmental management require information about coastline and its changes.2 Using satellite remote-sensing images to dynamically monitor coastline change is an effective means.3 Zhang et al.4 investigated the inning and silting in Hangzhou Bay of China using eight snapshots of Thematic Mapper (TM)/Enhanced Thematic Mapper (ETM+) remote-sensing images from 1986 to 2004. Wang et al.5 detected the shoreline change of Xiamen Island of China from 1989 to 2000 using three Landsat TM/ETM+ images. Sridhar et al.6 studied the long-term shoreline oscillations of the Cauvery Delta at Poompuhar, Tharangambadi, and Nagapattinam using satellite images, and they also physically observed these three locations with the help of reference pillars and compared the results with the images. Sener et al.7 determined coastline change in the Aksehir and Eber lakes in southwest Turkey using different remote-sensing methods on satellite images during different periods. Karsli et al.8 used remote sensing to identify and evaluate hot spots of shoreline changes to determine the pattern of shoreline changes along the Turkish coast of the Black Sea. As the largest river in South China, the Pearl River is the most important artery of inland navigation in China after the Yangtze River and is considered a veritable “golden waterway.” The Pearl River system consists of East River, West River, North River, and other rivers of the Pearl River Delta. Since the delta is formed due to these converging rivers, river channels are distributed densely.9 These crisscrossed rivers flow through Humen Outlet, Jiaomen Outlet, Hongqimen Outlet, Hengmen Outlet, Modaomen Outlet, Jitimen Outlet, Hutiaomen Outlet, and Yamen Outlet from west to east, and finally empty into the South China Sea. Thus, they constitute a unique feature of “rivers crisscross, outlets split-flow.”10 With the rapid population growth and economic development, the Pearl River Delta is the area with the highest urbanization development level. Rapid development around the Pearl River Estuary (PRE) has brought tremendous pressure to the environment, and land reclamation from the sea has caused impeded drainage resulting in increased flooding year by year.11 Therefore, it is important to analyze coastline change and erosion-accretion evolution around the PRE in recent decades and to study their causes and effects on the environment. In recent years, remote-sensing technology, GIS technology, and digital nautical charts have been used to study the evolution of the Pearl River Delta. Zhu12 focused on applying remote-sensing technology to monitor the rapidly varying coastline in the Pearl River Delta. Wen et al.13 analyzed the tendency of erosion and sedimentation changes over foreshores and channels of Lingding Bay using digital nautical charts and concluded that foreshores became shallower and deep channels became deeper. Yao and Wu14 quantitatively analyzed the shoreline migration and scour-and-silting space-time alternation of the PRE based on nautical charts and in situ data. Li and Damen15 analyzed shoreline changes and suspended sediment plume distribution and sedimentation, utilizing topographic maps, nautical charts, and remote-sensing images. However, none of these studies discussed the relationship between coastline change and erosion-accretion evolution, an important issue to the processes of understanding and management. In this study, we analyze coastline change and erosion-accretion evolution of the PRE, especially the relationship between the two, the causes, and their impacts on the environment in the recent 25 years, using the latest time series of remote-sensing images and nautical charts. 2.Study Area and DataFour outlets in the east of the Pearl River, including Humen Outlet, Jiaomen Outlet, Hongqimen Outlet, and Hengmen Outlet, and Lingding Sea are selected as our study areas. The longitude ranges from 113°3′11″E to 114°7′56″E, and the latitude ranges from 22°9′46″N to 22°50′25″N. We collected six temporal remote-sensing images from 1986 to 2011 (Fig. 1 and Table 1). Bathymetric data are from two temporal nautical charts, which were respectively published in 1992 and 2008 by the Chinese Navy Press (Table 2). The coverage of the two charts is little smaller than our study area. Fig. 1Remote-sensing images of the Pearl River Estuary (PRE) during the period from 1986 to 2011. Landsat TM fusion image of snapshot of (a) July 1986, (b) October 1990 and December 1990 (combined), (c) December 1995, (d) September 2000 and November 1999 (combined), and (e) November 2005 and May 2006 (combined). (f) HJ-1A CCD fusion image of January 2011. 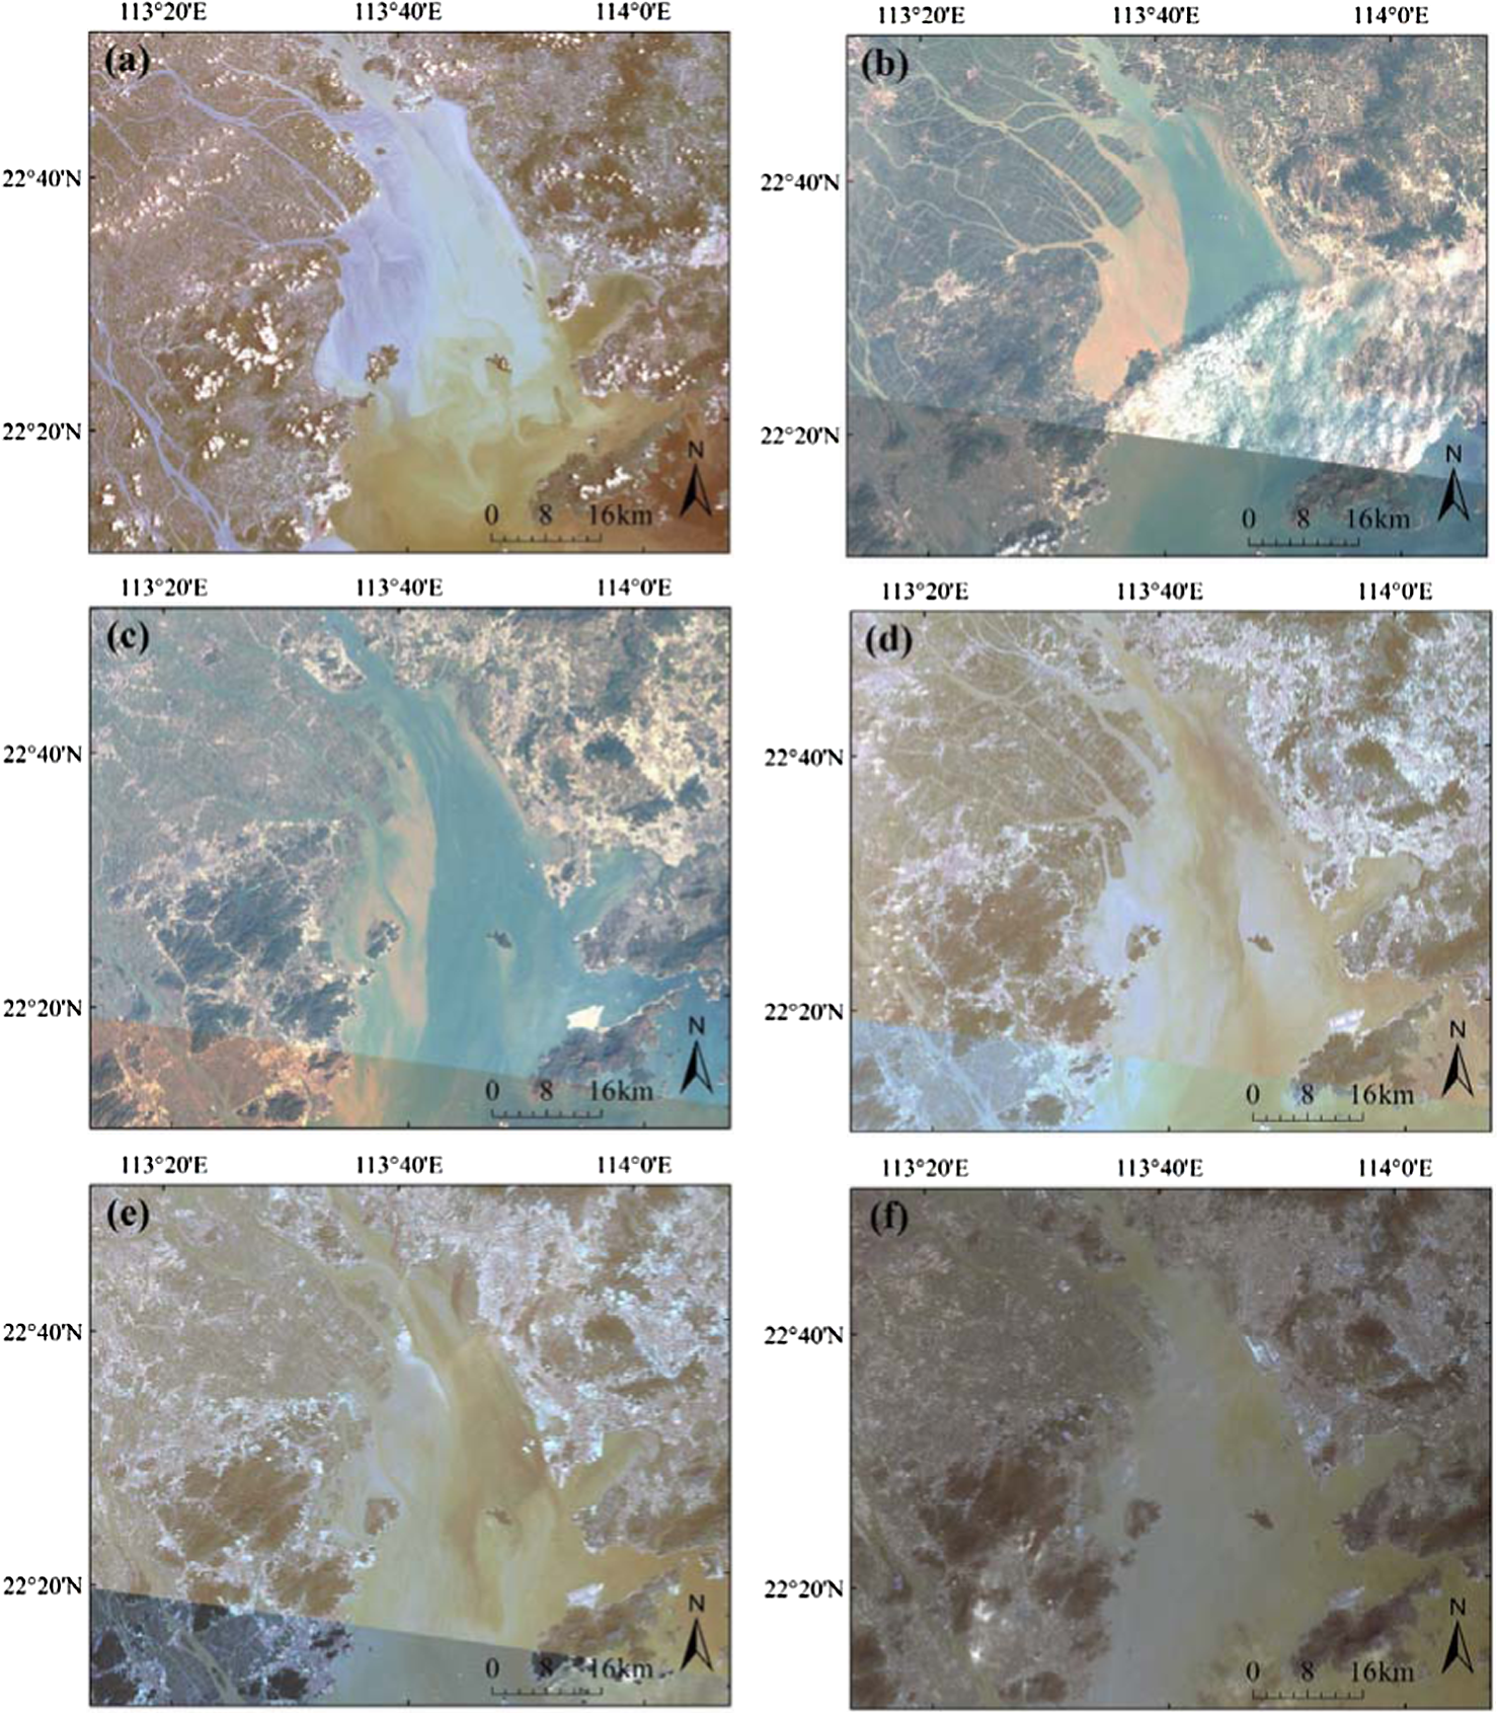 Table 1Remote-sensing images used in this study.
Table 2Nautical charts used in this study.
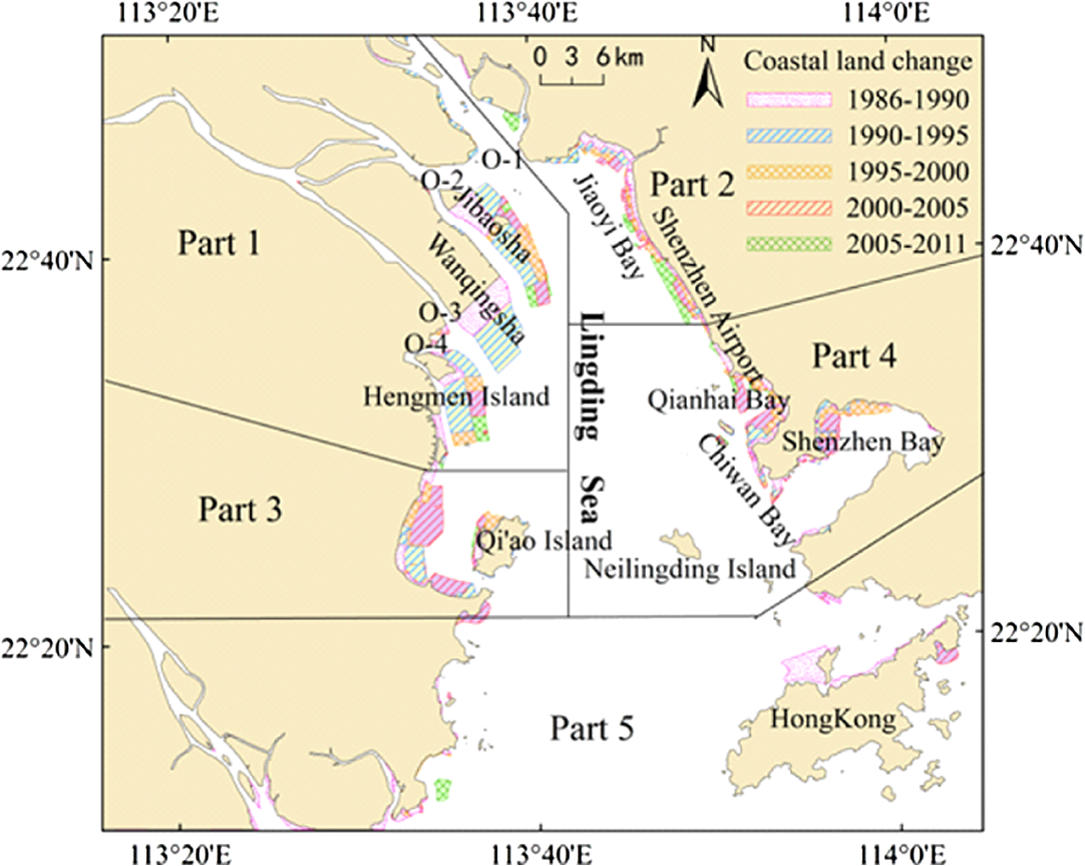
3.Data Processing3.1.Remote-Sensing Image ProcessingImage registration is one of the basic image processing operations in remote sensing. The most common approach to image registration is to choose, in both input and reference images, some well-defined ground control points (GCPs), and then to compute the parameters of a deformation model.16 Generally, GCPs are acquired from in situ data, topographic maps, or higher precision remote-sensing images that have been registered and corrected. In this study, the six temporal remote-sensing images were geometric corrected and registered based on SPOT5 fusion images of snapshots of the PRE around the year 2005, which had been registered and had 2.5-m resolution (higher than the six images in Fig. 1). After true color synthesized fusion, we extracted the coastlines from the six images, and then superimposed and contrasted them. After comprehensive interpretation, the coastal land change chart of the PRE in the period from 1986 to 2011 was obtained (Fig. 2). 3.2.Nautical Chart ProcessingBy scanning the two nautical charts and geometrically correcting them, the data were vectorized. Then, they were registered to acquire bathymetric contour and sounding points. The scattered set of points was interpolated using Kriging interpolation method to reconstruct the digital elevation model (DEM) of our study area. The DEM maps of 1992 and 2008 were matched to the coastal land change data and overlaid by the coastal land of 1990 and 2011, respectively, to conveniently analyze depth change (Fig. 3). Subtracting the DEM depth of 1992 from that of 2008, a depth-change chart from 1992 to 2008 was obtained, which could visually reflect the erosion-accretion evolution of the PRE. The coastal land of 1990 was chosen as the overlaying map, and thus a larger water area and more depth information were illustrated (Fig. 4). 4.Results4.1.Coastline Change of the PREThe coastline change can be analyzed from two aspects: the change of coastline length and geometry and the change of coastline types.17 In order to facilitate the analysis, the study area was divided into five parts (see Fig. 2) over five periods from 1986 to 2011, namely 1986 to 1990, 1990 to 1995, 1995 to 2000, 2000 to 2005, and 2005 to 2011. Our discussion stresses changes of coastline length, coastal land area, and the maximum coastline seaward extension. In this article, the maximum coastline seaward extension is defined as a maximum vertical distance between the coastline extended to the sea and the previous coastline over a period. Figure 2 shows that the PRE coastline extended to the sea and rarely retreated back to the land because of erosion, while the coastline became longer, water area became smaller, and the funnel-shaped PRE narrowed. As we can see from Table 3, in the period from 1986 to 2011, the total length of the PRE coastline increased by 149.2 km, which is equivalent to a growth of 0.57% per year. The coastal land increased by , which is equivalent to a growth of 0.23% per year, with the maximum distance of seaward extension being about 13 km. Between 1986 and 1995, the coastline and coastal land increased much more and faster than any other periods, and we suspect it was promoted by the rapid economical development of many Economic and Technological Development Zones (ETDZs) in Guangdong Province.18 After 1995, the changes slowed down. Since 2000, the winding coastline has turned into a straight one. We suspect it was caused by increasing anthropogenic activity. With new land extended to the sea, the coastline length changed slightly while the area expanded greatly. Table 3Changes of the whole study area during different periods.
Changes in different parts of the study area during different periods are illustrated in Fig. 5. Of the whole PRE region, the most significant change occurred along the Nansha Economic Development Zone to Hengmen Island in the northwest (Part 1) and from the Shekou Peninsula to Shenzhen Bay in the east (Part 4); and changes along Jiaoyi Bay to Shenzhen Airport in the northeast (Part 2) and Sidong Shoal to Qi’ao Island in the southwest (Part 3) took second place. Fig. 5Changes in different parts of the study area during different periods: (a) coastline length, (b) coastal land area, and (c) the maximum distance of seaward extension.  4.1.1.Coastline change along Nansha Economic Development Zone to Hengmen IslandThe Nansha Economic and Technological Development Zone (NETDZ) established in 1993 is in the geometric center of the Pearl River Delta economic zone, where four outlets are located and three rivers meet. The area was underdeveloped and remote before the early 1990s. However, there have been rapid changes since the start of the NETDZ, and from then on, several new polices were enacted to facilitate economic development and foreign investment, and land demand for construction was on the increase.19 As a result, the coastline change there is the most significant. Between 1986 and 2011, the coastline increased by 85.5 km, the coastal area increased by , and the maximum distance of seaward extension was about 13 km. Combining remote-sensing images, we can see that there were great change of coastline morphology around Jibaosha, Wanqingsha, and Hengmen Island because of the development in the NETDZ [Fig. 6(a)]. Jibaosha was at the top of the funnel-shaped Lingding Sea, where the land area increased due to reclamation for the construction of large ports and shipbuilding base, and so all the scattered small islands around Jibaosha had been connected to form the new land.20 Wanqingsha and Hengmen Island exhibited a constant southeastward growth trend. Oriented toward agriculture and ecological tourism, reclaimed land in Wanqingsha was mostly used for agriculture, mariculture, and ecology.21 The Zhongshan Linhai Industrial Park is located on Hengmen Island, so the reclaimed land there was mostly used for industry.22 4.1.2.Coastline change along Shekou Peninsula to Shenzhen BayAfter the establishment of Shenzhen Special Economic Zone in 1980, the Shekou Peninsula rapidly became an important trade area.23 As a result, its coastline has undergone tremendous changes with more obvious changes seen in Qianhai Bay, Chiwan Bay, and Shenzhen Bay [Fig. 6(b)]. Between 1986 and 2011, the coastline increased by 20.2 km, the coastal area increased by , and the maximum distance of seaward extension was about 3 km. Qianhai Bay was a shoal used for mariculture, while Shenzhen Bay was mainly used for large-scale construction of roads and container terminals.24 Coastline length decreased in 2000 to 2011, because a lot of wharfs and ports there made the coastline straighter. This clearly shows that human activities could transform a winding coastline into a straighter and shorter one.25 As a result, the land area increased slowly, and the coastline extended seaward gradually. 4.2.Erosion-Accretion Evolution of the PREThe funnel-shaped PRE has widened from the north to the south and deepened from the west to the east. Under the interaction of tidal currents and runoffs, a unique configuration was formed so that the three shoals (West Shoal, Mid Shoal, and East Shoal) were separated by two channels (Fanshi Channel and Lingding Channel).26 The data in Fig. 4 represent the depth change from 1992 to 2008. The negative values indicate that water depth decreased from 1992 to 2008 (namely accretion), and the positive values indicate that it increased from 1992 to 2008 (namely erosion). In the period of 1986 to 2011, the erosion-accretion evolution of the PRE was mainly reflected in two aspects: the continued siltation in most water areas, such as tidal flat and shoal, and the continued deepening in channels due to flow washout action or dredging, namely the foreshores became shallower and deep channels became deeper. The water depth decreased by 2 to 4 m in Jiaoyi Bay, Shenzhen Airport, Jibaosha, the southwest of Wanqingsha, Hengmen Island, Sidong Shoal, Qianhai Bay, and the northeast of Qi’ao Island. Around the northwest of Jibaosha, the south of Qi’ao Island, both sides of Humen Channel, and the southwest of Shekou Peninsula, the water was 4 to 6 m shallower. Parts of Jinkou Shoal and Sidong Shoal are about 1 m shallower. Fanshi Shoal is 1 to 3 m shallower. The cross profile of Fanshi Shoal (Line A in Fig. 4) shows that the west side in 2008 was deeper than that in 1992, which was probably caused by sand excavation [see Fig. 7(a)]. Furthermore, there were depositions of different degrees on both sides of most waterways and channels. In order to ensure the capacity of navigation channel, annual dredging made the channels deeper, while mud dumping along the channels made both sides shallower. The cross profile of Tonggu Channel (Line B in Fig. 4) shows the most significant example: because of mud dumping, the west is 2 m shallower, while the east is 4 m shallower [see Fig. 7(b)]. Fig. 7Examples of water depth: cross profiles of (a) Fanshi Shoal, (b) Tonggu Channel, (c) Lingding Channel, and (d) Longxue Channel. The solid line for 1992 and the dotted line for 2008 represent the depth value of these years, while the dashed line for 1992 to 2008 means the depth change over the period of 1992 to 2008. 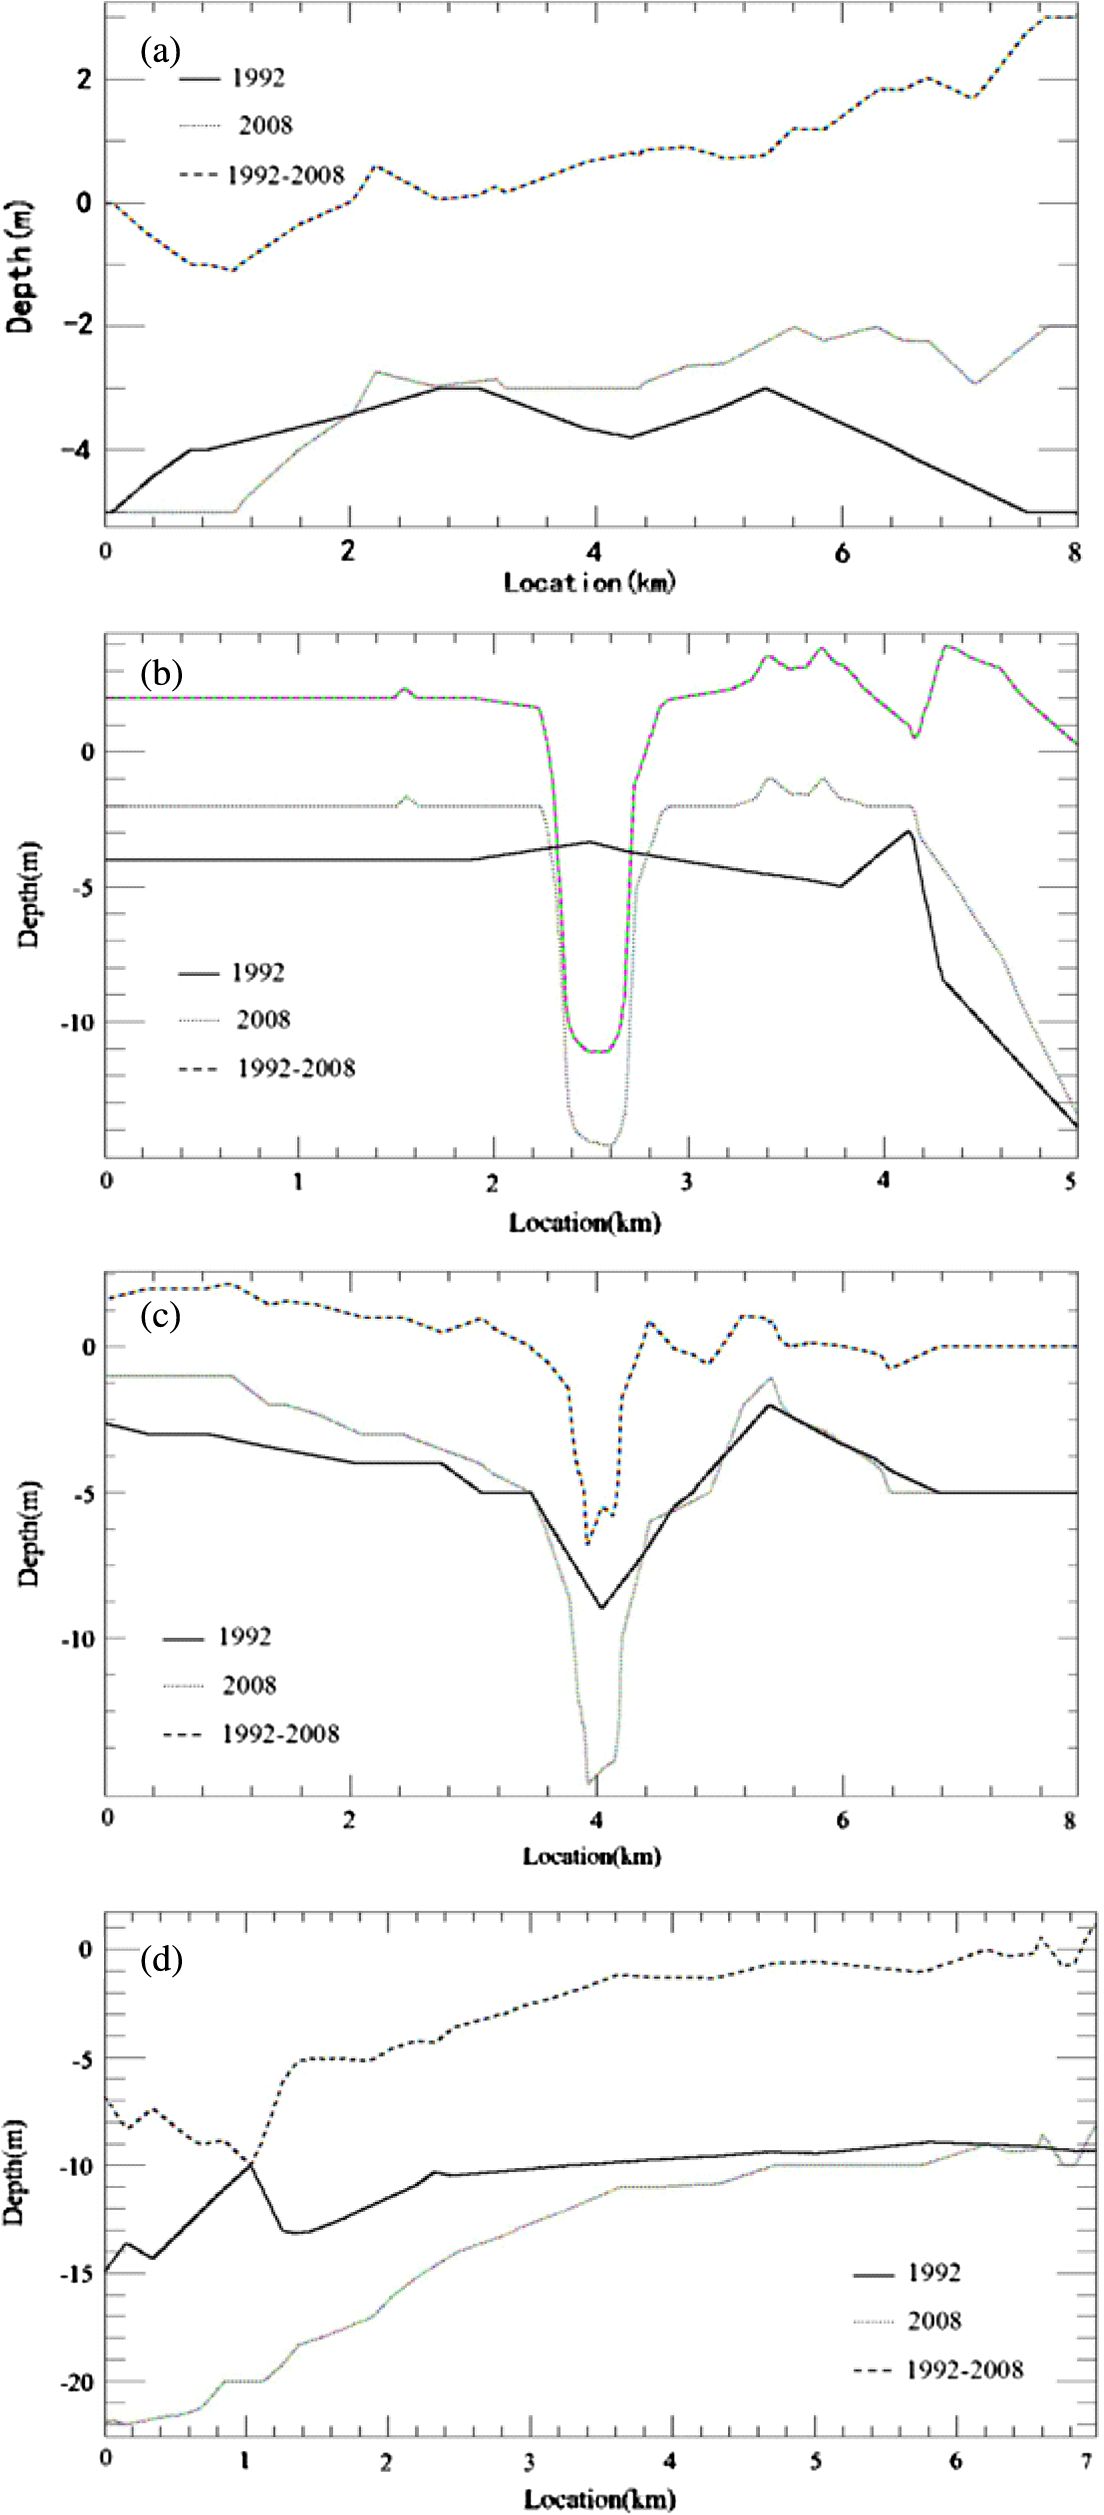 In contrast, the water depth of waterways, channels, and deep water ports increased by 2 m. One cross profile in the northern Lingding Channel (Line C in Fig. 4) is shown in Fig. 7(c). The channel was deepened by 6 m due to dredging, while its west side was 2 m shallower due to mud dumping, and part of its east part was deepened by 2 m. As a result of flow washout action or dredging, the depths of Chuanbi Channel, Longxue Channel, Hongqimen Channel, and Hengmen Channel were increased by 2 to 4 m (see Fig. 4). The cross profile of Longxue Channel (Line D in Fig. 4) shows that in the period of 1992 to 2008 its depth was increased by more than 1 m, but the north side was deepened by 7 m, where the flows from Humen Outlet and Jiaomen Outlet meet [see Fig. 7(d)]. The 2008 nautical chart demonstrates that there was a 14-m deep channel whose northeast part was adjacent to Chiwan Bay and the southwest part met Lingding Channel in the southeast of Neilingding Island. In the 1992 nautical chart, however, we could only see Fanshi Shoal, whose depth was 4 to 6 m. This manmade channel, known as the Tonggu Channel was a significant change to the PRE topography, and was dug between 2004 and 2007.27 Along Qianhai Bay to Chiwan Bay, the water depth was deepened by 4 to 6 m during 1992 to 2008 owing to the construction of wharfs and ports.23 In addition, we found that the water depth was deepened in patches with an average increase of 1 to 2.5 m, especially on the east side of the Lingding Channel. Changes at some spots are as much as 5.5 m. We suspect this was caused by frequent sand excavation activities. 4.3.Relationship Between Coastline Change and Erosion-Accretion Evolution of the PREOverlapped images of the coastline-change chart and erosion-accretion evolution chart are used to show the relationship between coastline change and erosion-accretion evolution of the PRE (Fig. 8). Fig. 8Relationship between coastline change and erosion-accretion evolution of the PRE from 1986 to 2011.  With increasing deposition and reclamation in the PRE, the coastline continued to extend seaward. Comparing coastline change and erosion-accretion evolution, we found that the areas where coastline extended to the sea coincided with areas where water depth decreased by 1 to 6 m. These water areas became land under reclamation activities, such as in the southwest of Jibaosha, the south of Hengmen Island, Jiaoyi Bay, Shenzhen Airport, Qianhai Bay, and Sidong Shoal. As shown in Fig. 8, the biggest depth change took place in the west Chiwan Bay (Line A in Fig. 8) with a reduction of more than 10 m, which was a water body thicker than 5 m in 1992 but has become land now, and is used as Chiwan container terminal. In addition, there appears to be a new deposition around the reclamation land to different degrees; channels continued to be extended in length, narrowed down in width, and deepened especially near the outlets. Many scattered small islands between larger islands had been connected to form new land due to reclamation of tidal flat. So, the outlets are narrower. Take Hengmen Channel (Line B in Fig. 8), for instance, in 1992, it was 75-m wide and 6-m deep, and it became 60-m wide and 9-m deep in 2008. This was because Wanqingsha and Hengmen Island had been extended to the sea, and there was also a 1-m deposition along both sides of the channel. Anthropogenic digging deepened some parts of the water greatly. This was most significant in southeast Jibaosha and around the Shekou Peninsula. During 1999 to 2008, the first and second stages of Nansha Harbor District Port Project were in the east and south Jibaosha, where Guangzhou Shipbuilding Base was under construction.20 Many excellent harbors in the Shekou Peninsula were built, where inland ships and giant oceangoing ships were allowed to berth, and therefore, this area water depth was deepened by 3 to 10 m. Jinxing Harbor, south of Qi’ao Island, was 2 to 4 m shallower, thanks to the construction of Qi’ao Bridge that connects Qi’ao Island and Zhuhai City.28 4.4.Causes and Impacts of Coastline Change and Erosion-Accretion EvolutionThe Pearl River Delta is an important drive of China’s economic growth. It is also known as the wealthiest and the fastest growing region in the mainland. Human activities play an important role in changing the landform of the PRE and extending the seaward coastline, and increasing erosion-accretion had tremendous impacts on the PRE environment. Small area reclamation will contribute to scouring action, for it only partially transforms the morphological structure of the coast, making the rough and winding coastline smoother and straighter. Many islands have been connected together, outlets have become narrower, and deposition has increased. The navigation capacity of silted outlets and channels has reduced, and then dredging is needed to deepen them; but the mud from dredging is piled up nearby, which causes more scouring. With the increasing urbanization, reclamation from the sea can be an effective means to satisfy different land demands such as urban construction, industry, and agriculture. New reclamation areas appear continuously, and coastlines are extended to the sea constantly. More and more inning land has been developed to build factories or used for infrastructure construction. Industrial wastewater and aquaculture wastewater from the reclamation land become the major factors of coastal water pollution,29 which may also influence the ecosystem of mangrove wetlands. Thus, both the life of coastal residents and the ecological environment are damaged. During a field survey of the coastal area of Shenzhen, we saw many cement plants that were constructed near mangrove wetlands. Wastewater from the plants poured into the sea may impact the environment of mangrove forest and the biological diversity. Furthermore, the construction of sea-crossing bridges, port projects, and illegal sand excavation break the erosion-accretion balance of channels and greatly intervene with the natural variation of coastline and erosion-accretion. 5.ConclusionsThis paper analyzed coastline change, erosion-accretion evolution, and their relationship by using remote-sensing images and nautical charts. The causes and impacts of these changes were also discussed. Some conclusions are as follows:
AcknowledgmentsThe authors acknowledge the Marine Scientific Public Welfare Research Special Foundation (No. 201105001) for funding this work, the Center for Earth Observation and Digital Earth (CEODE), Chinese Academy of Sciences for providing Landsat-5/7 remote-sensing images, and the China Centre for Resources Satellite Data and Application (CRESDA) for providing HJ-1A remote-sensing images. The authors would also like to thank Dr. Zuojun Yu for her comments that significantly improved the presentation of the paper. ReferencesG. WinarsoS. Budhiman,
“The potential application of remote sensing data for coastal study,”
in Proc. 22nd Asian Conf. Remote Sensing,
(2001). http://www.crisp.nus.edu.sg/~acrs2001 Google Scholar
A. A. AlesheikhA. GhorbanaliN. Nouri,
“Coastline change detection using remote sensing,”
Int. J. Environ. Sci. Technol., 4
(1), 61
–66
(2007). IJESHU 1735-1472 Google Scholar
J. ChangG. H. LiuQ. S. Liu,
“Dynamic monitoring of coastline in the yellow river delta by remote sensing,”
Geoinf. Sci., 6
(1), 94
–98
(2004). Google Scholar
H. Zhanget al.,
“A remote sensing investigation of inning and silting in Hangzhou bay since 1986,”
Rem. Sens. Land Resour., 2 50
–55
(2005). Google Scholar
L. WangH. Q. XuS. Li,
“Dynamic monitoring of the shoreline changes in Xiamen Island with its surrounding areas of SE China using remote sensing technology,”
Rem. Sens. Technol. Appl., 20
(4), 404
–410
(2005). Google Scholar
R. S. SridharK. ElangovanP. K. Suresh,
“Long term shoreline oscillation and changes of Cauvery delta coastline inferred from satellite imageries,”
J. Indian Soc. Rem. Sens., 37
(1), 79
–88
(2009). http://dx.doi.org/10.1007/s12524-009-0013-y 0255-660X Google Scholar
E. SenerA. DavrazS. Sener,
“Investigation of Aksehir and Eber Lakes (SW Turkey) coastline change with multitemporal satellite images,”
Water Resour. Manag., 24
(4), 727
–745
(2010). http://dx.doi.org/10.1007/s11269-009-9467-5 WRMAEJ 0920-4741 Google Scholar
F. KarsliA. GunerogluM. Dihkan,
“Spatio-temporal shoreline changes along the southern Black Sea coastal zone,”
J. Appl. Rem. Sens., 5
(1), 053545
(2011). http://dx.doi.org/10.1117/1.3624520 1931-3195 Google Scholar
J. ChenD. LiS. Chen,
“Progress of estuarine research in China over last 50 years,”
Sci. China B Chem., 44
(1), 1
–9
(2001). http://dx.doi.org/10.1007/BF02884803 SCBSE5 1001-652X Google Scholar
Z. HuangW. Zhang,
“Impacts of artificial factors on the evolution of geomorphology during recent thirty years in the Zhujiang Delta,”
Quat. Sci., 24
(4), 394
–401
(2004). QSREDU 0277-3791 Google Scholar
X. Chenet al.,
“Spatio-temporal characteristics and effects of shoreline evolution of the Pearl River Estuary in the past thirty years,”
Trop. Geogr., 30
(6), 591
–596
(2010). 1001-5221 Google Scholar
X. Zhu,
“Remote sensing monitoring of coastline changes in Pearl River Estuary,”
Mar. Environ. Sci., 21
(2), 19
–22
(2002). Google Scholar
P. Wenet al.,
“An analysis of the tendency of erosion and sedimentation on foreshore and channels of Lingding estuary in past fifty years,”
Acta Sci. Nat. Univ. Sunyatseni, 42
(2), 240
–243
(2003). 0529-6579 Google Scholar
C. YaoZ. Wu,
“Shoreline migration and scour-and silting alternation in the Lingdingyang Estuary over past 30 years,”
J. Mar. Sci., 30
(3), 44
–55
(2012). Google Scholar
X. LiM. C. J. Damen,
“Coastline change detection with satellite remote sensing for environmental management of the Pearl River Estuary, China,”
J. Mar. Syst., 82 54
–61
(2010). http://dx.doi.org/10.1016/j.jmarsys.2010.02.005 JMASE5 0924-7963 Google Scholar
J. L. Moigne,
“Parallel registration of multi-sensor remotely sensed imagery using wavelet coefficients,”
Proc. SPIE, 2242 432
–443
(1994). http://dx.doi.org/10.1117/12.170045 PSISDG 0277-786X Google Scholar
Q. Sunet al.,
“Analysis of shoreline changes based on remote sensing in Changxing Island, Liaoning Province,”
Mar. Environ. Sci., 30
(3), 389
–393
(2011). Google Scholar
D. Lu,
“Three development stages & main achievements for Guangdong since Reform and Open Policy,”
Spec. Zone Econ., 7 7
–10
(2001). Google Scholar
X. YuC. Ng,
“Spatial and temporal dynamics of urban sprawl along two urban-rural transects: a case study of Guangzhou, China,”
Landscape Urban Plan., 79
(1), 96
–109
(2007). http://dx.doi.org/10.1016/j.landurbplan.2006.03.008 0169-2046 Google Scholar
X. HanS. Yang,
“Scour and silting evolution of topography around Jibaosha in the Zhujiang estuary,”
J. Waterway Harbor, 29
(5), 328
–332
(2008). Google Scholar
Y. ZhengB. DongX. Zhang,
“Report on Leisure Agriculture and Rural Tourism at Wanqinsha Town of Guangzhou,”
Trop. Agr. Eng., 34
(5), 65
–67
(2010). Google Scholar
G. Qian,
“Approach to damp-proof and flood control and vertical design of Zhongshan Linhai industrial park in Guangdong Province,”
Urban Roads Bridges Flood Contr., 5 86
–87
(2005). Google Scholar
L. HuJ. Jiao,
“Modeling the influences of land reclamation on groundwater systems: a case study in Shekou peninsula, Shenzhen, China,”
Eng. Geol., 114
(3), 144
–153
(2010). http://dx.doi.org/10.1016/j.enggeo.2010.04.011 EGGOAO 0013-7952 Google Scholar
P. ShiJ. ChenY. Pan,
“Landuse change mechanism in Shenzhen City,”
Acta Geogr. Sin., 55
(2), 151
–160
(2000). Google Scholar
M. X. SunW. Zhang,
“Study on coastline remote sensing survey and application in Fujian Province,”
J. Oceanogr. Taiwan Strait, 23
(2), 213
–218
(2004). TAHAIG Google Scholar
S. Chenet al.,
“An analysis of the changes and evolvements on the foreshore and deep channels of Lingding Bay in Pearl River Estuary in past twenty years,”
Mar. Sci., 25
(6), 52
–53
(2001). Google Scholar
Y. JiaJ. HeW. Xin,
“Analysis of Tonggu channel scouring and siltation,”
Port Waterway Eng., 3 142
–167
(2011). 1002-4972 Google Scholar
X. Song,
“Cantilever-splicing construction technology for the girder of Zhuhai Qi’ao Bridge,”
Port Waterway Eng., 3 53
–55
(2000). 1002-4972 Google Scholar
J. LiX. YangY. Q. Tong,
“Progress on environmental effects of tidal flat reclamation,”
Progr. Geogr., 26
(2), 43
–51
(2007). Google Scholar
Biography Xiao-zhen Wang received her BS in 2011 from Shanghai Ocean University, China, in marine technology. She is currently a second year graduate student majored in physical oceanography at Second Institute of Oceanography, State Oceanic Administration, State Key Laboratory of Satellite Ocean Environment Dynamic, Hangzhou, China. She conducts research on the underwater topography based on synthetic aperture radar (SAR) technology.  Hua-guo Zhang is an associate professor of Second Institute of Oceanography, State Oceanic Administration (SOA), People’s Republic of China. His research interest is the coastal remote sensing and GIS. He has published about 20 papers in domestic and foreign journals and proceedings. He earned his BS in environment from Nankai University in 1999, his MS in oceanography at Second Institute of Oceanography, State Oceanic Administration in 2002 and his PhD in oceanography from Ocean University of China in 2011. |