|
|
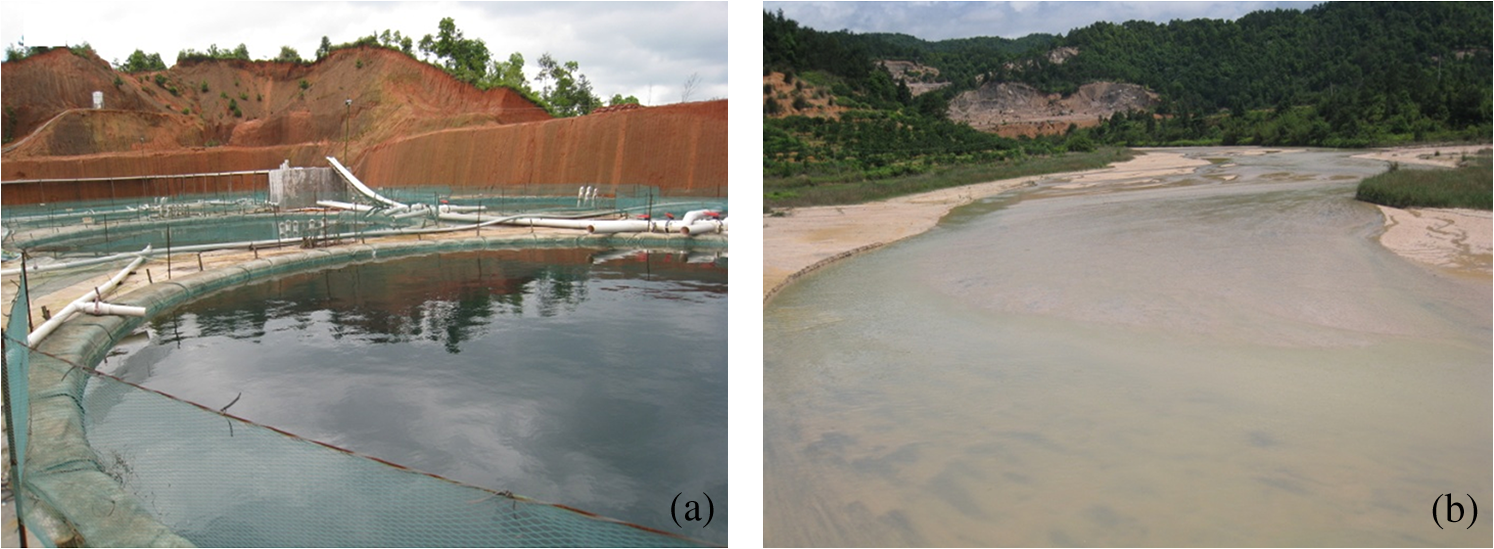
1.IntroductionRare earths are valuable resources that play an important role in modern industrial materials. Weathered crust rare earth ore is a new type of rare earth resource in China, which was first discovered in Jiangxi and later found widely in south China. This type of rare earth ore has many advantages, such as wide distribution, huge reserve, low radioactivity, and easy extraction.1 In weathered crust rare earth ores, the rare earth ions are absorbed in clay minerals formed from weathering of granites and volcanic rocks.2 Thus the rare earths can be easily extracted by an ion-exchange method. In the metallurgical process, the rare earth elements (REE) absorbed in clay minerals are dissolved in ammonia sulfate solution, which are collected in a leaching liquor pool. Then rare earths are deposited by carbonic acid solution.1,3 Nowadays, unauthorized mining of weathered crust rare earth ores becomes more and more serious as the price of rare earths is rising. The leaching liquor pools that contain different concentrations of dissolved rare earths are discharged arbitrarily. Thus, the rivers near rare earth ores are often polluted by discharge or groundwater permeation of leaching liquor, which lead to severe changes of elemental balance in the environment and the biosphere, which in turn, have the potential to endanger public health.4–6 The concentration of dissolved REE is a vital factor to evaluate the abundance of REE in leaching liquor and to estimate the contamination of the river near the rare earth ores. Conventionally, quantitative measurement of the abundance of REE in aqueous solutions is done by laboratory-based analytical techniques, such as the inductively coupled plasma mass spectrometry (ICP-MS),7 which are time consuming and costly. Consequently, a simple and economic method is necessary for measuring the content of REE in aqueous media. Reflectance spectroscopy is a rapidly advancing technique used to acquire spectral reflectance data in the visible-near infrared (VNIR) and short-wave infrared (SWIR) wavelength regions (0.4 to 2.5 nm) for material characterization.8,9 The spectral reflectance method as an analytical tool has advantages such as rapid data acquisition, nondestructive sample measurement, and low operational cost.10–12 Electronic transition and charge transfer processes associated with transition metal ions cause absorptions of incident light in the visible and infrared region, producing diagnostic spectral features.13–16 Previous studies have established that the absorption bands in the visible wavelength region related to REE are due to electronic transitions within the 4f configuration.17–20 It has been found that the wavelength, shape, depth, and width of the absorption features are controlled by the chemical composition of the material. Therefore, the variation of absorption features can be directly related to the chemistry of the absorbing material, for instance, the depth of an absorption band is an indication for the amount of the absorbing material present in a sample.16,21,22 Reflectance spectra acquired in the field and laboratory have been used to retrieve the chemical composition of samples in soil science and geology as well as botany.23–31 However, little research has been undertaken on the diagnostic absorption features of REE, and few data have been published on the relationship between absorption features and chemical composition of REE. Of the few available references in the literature, Clark et al. showed the spectral characteristics of several rare earth oxides involving Eu, Nd, and Sm,32 and Rowan et al. and Bedini identified the absorption bands of REE at 0.58, 0.74, and 0.80 μm which are attributed to electronic transitions of in REE-bearing minerals.33,34 Silver et al. showed the spectral characteristics of yttrium oxides doped with different contents of Nd, Er, and Ho.35 In this paper, we present a new method for quantitative estimation of the concentration of REE dissolved in aqueous media using reflectance spectroscopy. In our study, pure water, rare earth oxide, and ore leaching liquor samples containing various amounts of REE were collected; the reflectance spectra and the concentrations of REE were measured by reflectance spectroscopy and ICP-MS, respectively. Then, the spectrally diagnostic absorption characteristics of these samples were analyzed, and the lower detection limit by the spectral absorption band method for REE in aqueous media was determined. Finally, the correlation between the spectral absorption depth and the concentration of REE was analyzed, and linear regression models were derived that can be used for estimating the concentration of REE in aqueous media samples. 2.Samples and Methods2.1.Sample CollectionIn this study, 10 leaching liquor and stream water specimens numbered D1 to D10 which contain different concentrations of REE were collected from three rare earth ores in Xunwu, Dingnan, and Anyuan, respectively, in southern Jiangxi in May 2012 (Figs. 1 and 2). In this study, samples were collected and stored in high-density polyethylene bottles. The samples were then filtered through 0.45-μm membranes to remove suspended substances. The filtered samples were kept in a cold storage at temperatures between 0°C and 4°C before spectral reflectance and chemical measurements. 2.2.Spectral Reflectance MeasurementsThe spectral reflectance data of the aqueous samples were acquired using ASD FieldSpec-3 portable spectroradiometer in a darkroom. The FieldSpec-3 spectroradiometer measures dispersive reflectance at wavelengths from 0.35 to 2.5 μm which contains the wavelengths of diagnostic electronic transitions of REE (Table 1).36 The setup of spectral reflectance measurement is illustrated in Fig. 3. A large sheet of white paper was placed on the table to form a diffuse reflection surface. Then, 40 ml of each sample was poured into a clean beaker (50 ml capacity) placed on the table. Tripods were used for holding the lamp and the sensor. The positions of the lamp, the foreoptical lens of the ASD spectroradiometer, and the beaker remained constant for all samples measured to ensure each sample was measured under exactly the same geometric condition. For reference, a Spectralon@ plate was measured in the same position as the beaker. An 8 deg field-of-view foreoptics lens was used for spectral data acquisition. The incident angle of light source was 30 deg, for the luminous beams point to the beaker, while the foreoptics lens was placed perpendicular above the beaker. The distance from the lamp to the center of the liquid surface in the beaker was 10 cm, while the range from the lens to the liquid surface was 8 cm. Table 1Details of the ASD FieldSpec-3 spectroradiometer.
Spectral reflectance measurements were undertaken using ASD built-in software (ASD ViewSpecPro). Spectral reflectance of samples was measured in reference to Spectralon. Five spectral scans were repeated for each sample and an average spectrum was recorded. For comparison of the reflectance spectra of samples containing different concentrations of REE, reflectance spectra of pure water and rare earth oxides were measured. Continuum removal was undertaken as a pre-processing procedure. This is based on the assumption that an absorption spectrum has two components: a continuum and individual absorption features. The continuum or background is the overall albedo of the reflectance curve. To remove the background, continuum was fitted to a raw spectrum and at each wavelength the reflectance was divided by this continuum.37,38 Mathematically this was done as follows: , where is the spectrum as a function of wavelength , is the continuum for the spectrum, and is the continuum removal spectrum. For each absorption feature, we choose 10 nm as the wavelength range when performing continuum removal. Taking the absorption feature at 790 nm as an example, we used the 785 to 795 nm wavelength range for local continuum removal. Then the depth of the absorption feature, defined as the reflectance value at the shoulders minus the reflectance value at the absorption-band minimum, was calculated from continuum removal spectra as , where is the reflectance at the band bottom and is the reflectance of the continuum at the same wavelength as .39 2.3.Chemical AnalysesThe concentrations of dissolved REE were measured using the ICP-MS in the National Research Center for Geoanalysis of China. The REE was extracted with mixed extracting agents of di(2-ethylhexyl)phosphoric acid (HDEHP) and mono(2-ethylhexyl)phosphoric acid (H2MEHP).7 The detection limits for the various isotopes of REE are for , for , for , for , for , for , for , for , for , for , for , for , for , for , and for . The analytical precision for the heavy REE and yttrium is 2% to 3%, respectively, and approximately 5% for the light REE. For each sample, the total concentration of the 15 REE was calculated (Table 2). Table 2Concentrations of REE in leachate samples analyzed by inductively coupled plasma mass spectrometry.
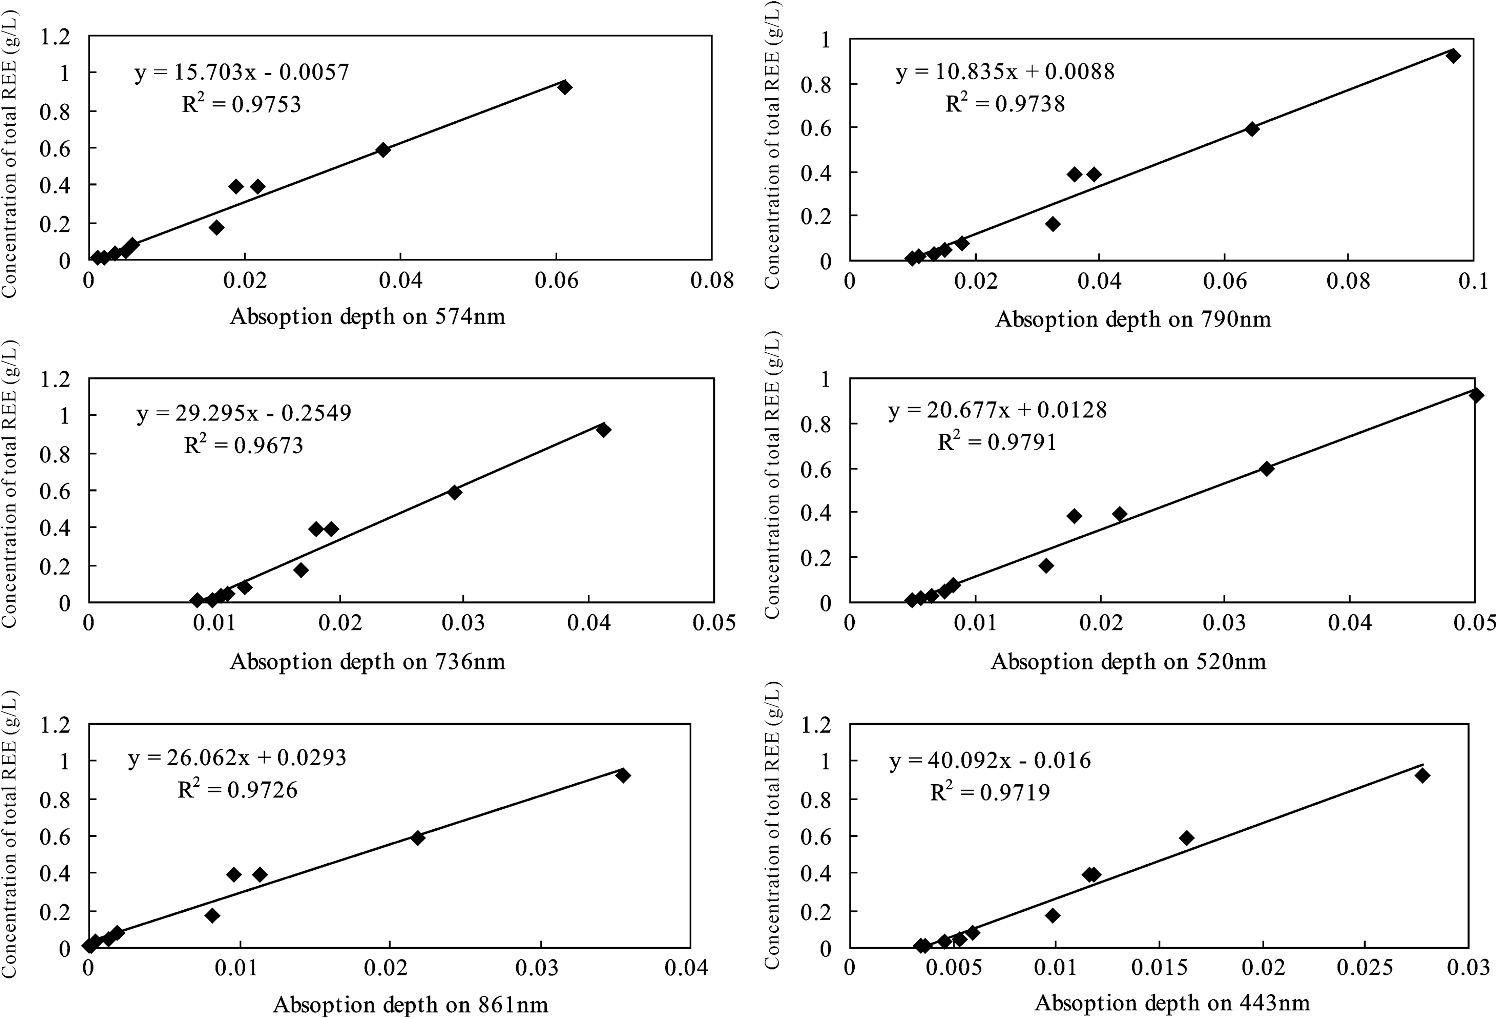
2.4.Statistical AnalysisIn our study, Pearson’s correlation, linear regression, and cluster analysis were utilized. The coefficient of determination () was selected as the standard for determining the application of absorption intensity for the measurement of the concentrations of REE. The coefficient of determination () between the intensity of six absorption bands and the abundance of total REE, between the intensity of 6 absorption bands, and 15 single REE were calculated. The least squares method was used to establish the linear regression equation, which was applied to quantitatively estimating the concentrations of dissolved REE using reflectance spectroscopy.22 Cluster analysis is a statistical technique that sorts observations into similar sets or groups.40 In our study, it was used to group the 15 REE into different groups according to their concentrations in 10 samples. 3.Results3.1.The Spectral Characteristics of Dissolved REEBased on the chemical analyses (Table 2), the sample D1, which contained the maximum amounts of REE, was selected, and its spectrum was compared with the spectra of pure water and rare earth oxide. For pure water, the high reflectance at 20% to 70% in the visible wavelengths is due to high transmission of visible light in water and the white background underneath the beaker. The reflectance is reduced sharply in the near-infrared (NIR) and SWIR regions because of strong absorption by water in these wavelengths. Two board absorption features at 780 and 950 nm are probably caused by the white paper background. In the spectra of rare earth oxide, absorption bands at wavelengths of 1400 and 1900 nm are related to hydrous minerals, and the several sharp absorption features on visible and NIR wavelengths are due to REE. The main spectral reflectance characteristics of ore leachate sample D1 are similar to pure water, i.e., with high reflectance in visible wavelengths but very low reflectance in the NIR and SWIR regions (Fig. 4). Besides, the diagnostic spectral reflectance features of sample D1 show six intense absorption bands in the visible and NIR wavelengths at 574, 790, 736, 520, 861, and 443 nm according to the absorption intensity, similar to the absorption features of the rare earth oxides (Fig. 5). Furthermore, with the decrease in the concentrations of REE, i.e., from D1 to D10, the diagnostic absorption bands become weaker (Figs. 6 and 7). As revealed by the analysis of concentrations and absorption-band depth of the 10 samples, the upper five samples with higher concentrations of REE show well-developed diagnostic absorption characteristics. Therefore, the minimum concentration of total REE detectable by reflectance spectroscopy must exceed . Fig. 4The spectra of pure water, rare earth oxide, and leachate containing maximum concentration of total REE (D1). 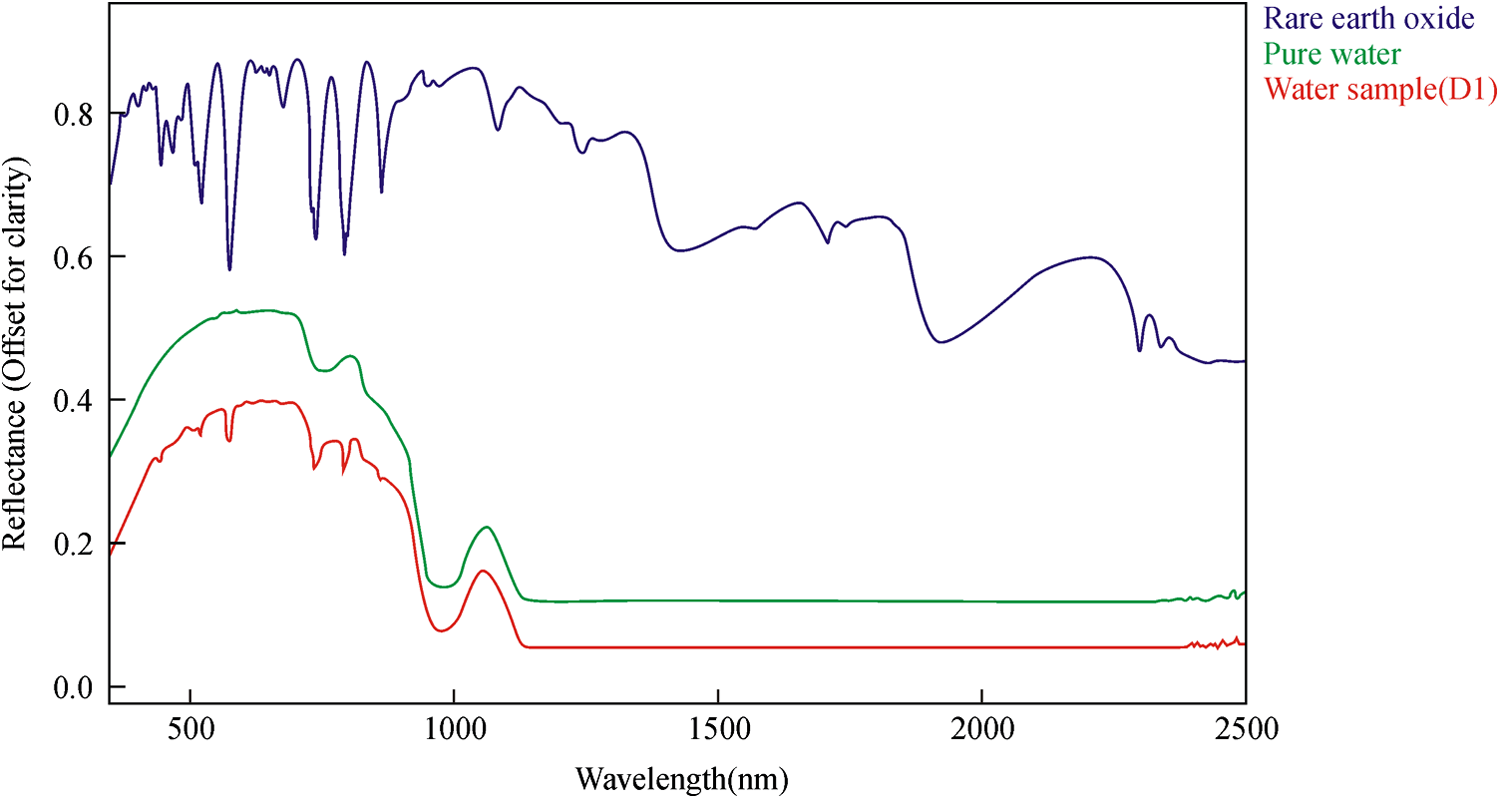 3.2.Correlations Between the Concentration of Total REE and Diagnostic Absorption FeaturesThe relative intensity of the six diagnostic absorption features of REE was calculated on the local continuum removal spectra (Fig. 8). The relative depths of six diagnostic absorption features are listed in Table 3. A linear correlation model of relative absorption-band depth as a function of the concentration of total REE is established using the least squares method for each absorption feature (Fig. 9). The results show for each linear relationship the coefficient of determination () at about 0.96 to 0.97, e.g., the depth of the absorption feature has a high correlation with the concentrations of total REE. The linear regression equations for the absorption features at 574, 790, 736, 520, 861, and 443 nm are , , , , , and , respectively. The standard error of prediction of the least squares method is 0.0511, 0.0526, 0.0588, 0.0470, 0.0538, and for the absorption features at 574, 790, 736, 520, 862, and 443 nm, respectively. Fig. 8The relative reflectance and depth on the six diagnostic absorption wavelengths for each sample.  Table 3The concentrations of total REE and the corresponding depths of six diagnostic absorption features.
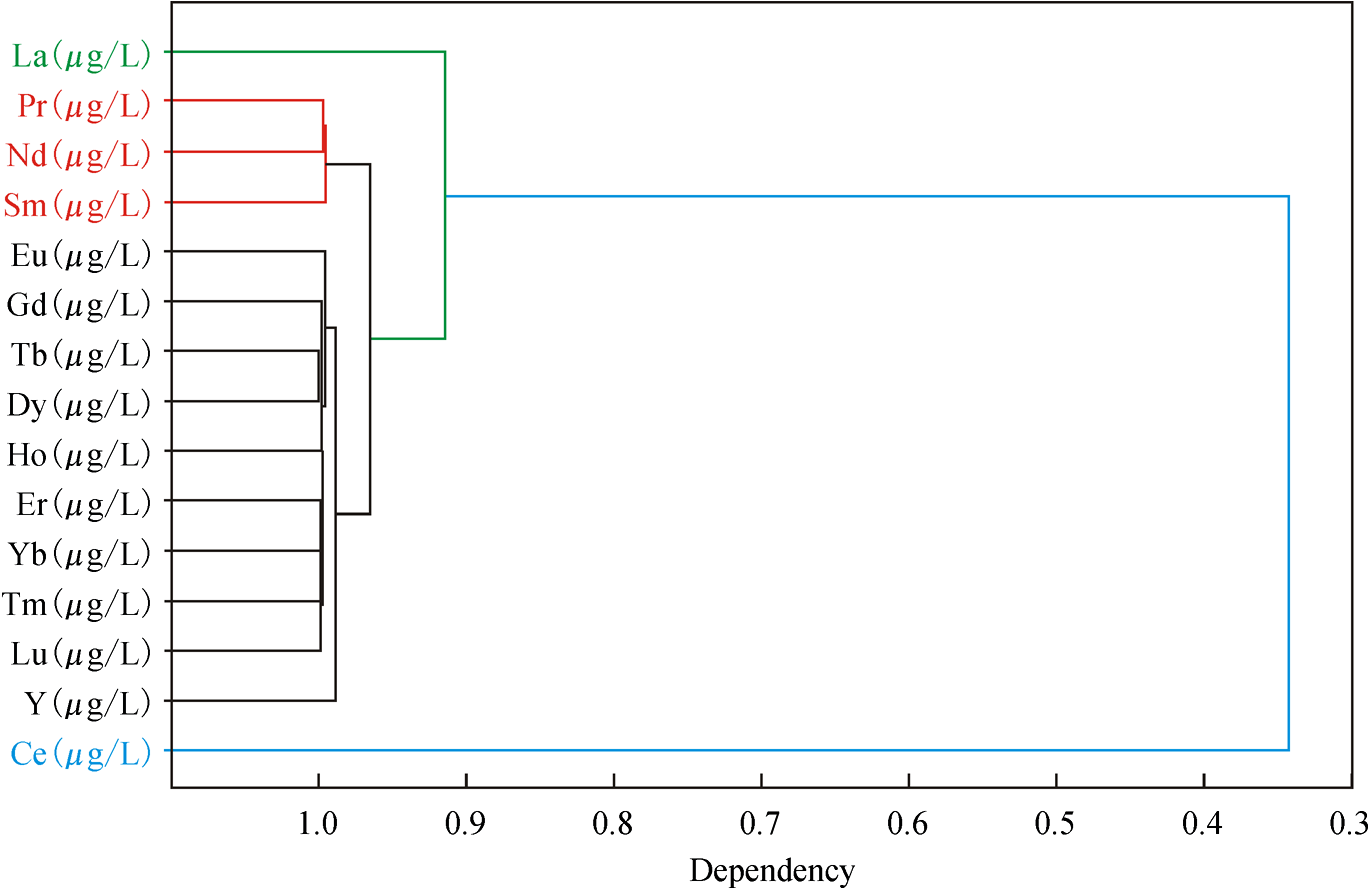
3.3.Analysis of Correlation Between the Concentration of each Individual REE and Six Diagnostic Absorption FeaturesThe REE contain 15 single elements; the correlation between concentration of each single element and the relative depths of six diagnostic absorption features was also analyzed using the linear regression method mentioned above. The results show that the 15 single elements can be divided into four groups according to the correlation coefficients (Table 4). The first group contains Ce, which has the lowest correlation coefficient of all four groups (). The second group is La, which has a correlation coefficient between 0.8 and 0.9. The third group contains Eu, Gd, Tb, Dy, Ho, Er, Tm, Yb, Lu, and Y, with correlation coefficients between 0.9 and 0.98. The fourth group contains Pr, Nd, and Sm, each with a correlation coefficient higher than 0.98. Table 4The coefficient of determination (r2) of the six diagnostic absorption features with the concentrations of the 15 individual REE.
For these 15 REE, cluster analysis was undertaken in reference to their concentrations (Table 2). The results also show that these elements are split into four groups (Fig. 10). Ce has little correlation with any other REE. La shows a low correlation with the rest of the REE. Eu, Gd, Tb, Dy, Ho, Er, Tm, Yb, Lu, Y form one closely correlated group, whereas Pr, Nd, Sm form another well-correlated group. The results agree with the correlation analyses between the concentration of each individual element and the depth of its diagnostic absorption feature. Therefore, we can draw the conclusion that the chemical analysis and the spectral analysis can confirm one another. 4.Discussions and ConclusionsIn this study, dissolved REE in aqueous media sampled from the leachate ponds and the nearby rivers were analyzed using reflectance spectroscopy with reference to pure water and synthesized rare earth oxide. It was observed that even though the concentration of REE in aqueous solution is very low, their spectral absorption features in visible and NIR wavelengths are detectable as shown by the six diagnostic absorption bands at 574, 790, 736, 520, 861, and 443 nm. Furthermore, with the descending of the REE concentration, the intensities of the six absorption features decrease. The minimum concentration of total REE that can be confidently detected by reflectance spectroscopy is approximately . Thereafter, a linear correlation between the depth of each of the six diagnostic absorption features and the concentration of total REE has been found that can be used to estimate the concentration of total REE in ore leachate and river water samples. Based on the results of the quantitative analyses in this study, it can be concluded that the relationship between the depth of the six diagnostic absorption features and the concentration of total REE can be quantified using a linear regression method at a high confidence level as indicated by the correlation coefficients up to 96% to 97%. The results of this study also show that the technique of using a linear relationship of absorption feature parameters for modeling the concentrations of REE is a simple first-order approximation. Furthermore, the study results in improved understanding of the reflectance spectroscopy of REE in liquid solutions, and bridges the gap between the reflectance spectroscopy of REE in aqueous media and their chemical concentration. Based on the linear correlation between the diagnostic absorption features and the concentration of total REE, we can easily estimate the concentration of total REE with reflectance spectroscopy of aqueous samples. The ASD spectroradiometer can get in real time, and therefore the method stated in our paper can deal with massive samples in a short time. Currently, the reflectance spectroscopy can be obtained with portable spectroradiometer in fieldwork, which makes it possible to estimate the concentration of total REE without laboratory analysis. Therefore, our research could be used for routine monitoring of REE pollution as a quicker and cheaper method. However, there are still questions remaining unanswered in this study, for which more research should be conducted:
AcknowledgmentsThis work was supported by Basic Research Program of Institute of Mineral Resources, Chinese Academy of Geological Sciences (Grant No. K1315). The author would like to thank Mr. Fan Xingtao (National Research Center for Geoanalysis of China) and Mr. Wu Han [China University of Geosciences (Beijing)] for assisting in sampling in the REE mines, and professor Wu Junzhao (Nanjing University) and Yan bokun (China Aero Geophysical Survey and Remote sensing Center for Land and Resources) for the valuable comments and suggestions leading to the improvement of the paper. ReferencesR. ChiJ. Tian, Weathered Crust Rare Earth Ore: Chemistry and Metallurgy, Science Publishing House, Beijing
(2006). Google Scholar
R. ChiJ. Tian,
“Review of weathered crust rare earth ore,”
J. Chin. Rare Earth Soc., 25
(6), 641
–650
(2007). http://dx.doi.org/10.3321/j.issn:1000-4343.2007.06.001 JCESEN Google Scholar
Z. GaoQ. Zhou,
“Contamination from rare earth ore strip mining and its impacts on resources and eco-environment,”
Chin. J. Ecol., 30
(12), 2915
–2922
(2011). Google Scholar
K. H. Johannessonet al.,
“Geochemistry of the rare-earth elements in hypersaline and dilute acidic natural terrestrial waters: complexation behavior and middle rare-earth element enrichments,”
Chem. Geol., 133
(1–4), 125
–144
(1996). http://dx.doi.org/10.1016/S0009-2541(96)00072-1 CHGEAD 0009-2541 Google Scholar
M. Åstrom,
“Abundance and fractionation patterns of rare earth elements in streams affected by acid sulphate soils,”
Chem. Geol., 175
(3–4), 249
–258
(2001). http://dx.doi.org/10.1016/S0009-2541(00)00294-1 CHGEAD 0009-2541 Google Scholar
B. YanH. HuangX. Xiao,
“Technology analysis for resource recycles and standardized discharge of ion-absorbed rare earth mineral wastewater,”
Chin. J. Environ. Eng., 4
(1), 53
–56
(2010). Google Scholar
G. HanC. Liu,
“Controlling factors for variation in dissolved rare-earth elements in Karst drainage basin,”
Carsol. Sin., 23
(3), 177
–186
(2004). http://dx.doi.org/10.3969/j.issn.1001-4810.2004.03.002 Google Scholar
E. A. Cloutiset al.,
“Detection and discrimination of sulfate minerals using reflectance spectroscopy,”
Icarus, 184
(1), 121
–157
(2006). http://dx.doi.org/10.1016/j.icarus.2006.04.003 ICRSA5 0019-1035 Google Scholar
C. Spinettiet al.,
“Spectral properties of volcanic materials from hyperspectral field and satellite data compared with LiDAR data at Mt. Etna,”
Int. J. Appl. Earth Obs. Geoinf., 11
(2), 142
–155
(2009). http://dx.doi.org/10.1016/j.jag.2009.01.001 0303-2434 Google Scholar
K. Yanget al.,
“Characterising the hydrothermal alteration of the Broadlands–Ohaaki geothermal system, New Zealand, using short-wave infrared spectroscopy,”
J. Volcanol. Geotherm. Res., 106
(1), 53
–65
(2001). http://dx.doi.org/10.1016/S0377-0273(00)00264-X JVGRDQ 0377-0273 Google Scholar
A. A. Madani,
“Spectral properties of carbonatized ultramafic mantle xenoliths and their host olivine basalts, Jabal Al Maqtal basin, south eastern desert, Egypt, using ASD fieldSpec spectroradiometer,”
Egypt. J. Remote Sens. Space Sci., 14
(1), 41
–48
(2011). http://dx.doi.org/10.1016/j.ejrs.2011.05.001 1110-9823 Google Scholar
C. Bielet al.,
“Mineralogical, IR-spectral and geochemical monitoring of hydrothermal alteration in a deformed and metamorphosed Jurassic VMS deposit at Arroyo Rojo, Tierra delFuego, Argentina,”
J. South Am. Earth Sci., 35 62
–73
(2012). http://dx.doi.org/10.1016/j.jsames.2011.11.005 JAESE9 0895-9811 Google Scholar
J. B. Adams,
“Visible and near-infrared diffuse reflectance: spectra of pyroxenes as applied to remote sensing of solid objects in the solar system,”
J. Geophys. Res., 79
(32), 4829
–4836
(1974). http://dx.doi.org/10.1029/JB079i032p04829 JGREA2 0148-0227 Google Scholar
J. B. Adams,
“Interpretation of visible and near-infrared diffuse reflectance spectra of pyroxenes and other rock forming minerals,”
Infrared and Raman Spectroscopy of Lunar and Terrestrial Minerals, 91
–116 Academic Press Inc., New York
(1975). Google Scholar
R. G. Burns,
“Origin of electronic spectra of minerals in the visible and near-infrared region,”
Remote Geochemical Analysis: Elemental and Mineralogical Composition, 3
–30 Cambridge University Press Inc., New York
(1993). Google Scholar
F. D. van der Meer,
“Analysis of spectral absorption features in hyperspectral imagery,”
Int. J. Appl. Earth Obs. Geoinf., 5
(1), 55
–68
(2004). http://dx.doi.org/10.1016/j.jag.2003.09.001 0303-2434 Google Scholar
J. W. Aneus,
“The visible region absorption spectra of rare earth minerals,”
Am. Mineral., 50 356
–366
(1965). AMMIAY 0003-004X Google Scholar
K. Binnemans,
“Lanthanides and actinides in ionic liquids,”
Chem. Rev., 107
(6), 2592
–2614
(2007). http://dx.doi.org/10.1021/cr050979c CHREAY 0009-2665 Google Scholar
L. I. Ardanovaet al.,
“Isomorphous substitutions of rare earth elements for calcium in synthetic hydroxyapatites,”
Inorg. Chem., 49
(22), 10687
–10693
(2010). http://dx.doi.org/10.1021/ic1015127 INOCAJ 0020-1669 Google Scholar
J. G. BünzliS. V. Eliseeva,
“Basics of lanthanide photophysics,”
Lanthanide Lumin, 1
–45 Springer, Berlin Heidelberg
(2011). Google Scholar
J. F. Mustard,
“Chemical composition of actinolite from reflectance spectra,”
Am. Mineral., 77 345
–358
(1992). AMMIAY 0003-004X Google Scholar
R. F. KokalyR. N. Clark,
“Spectroscopic determination of leaf biochemistry using band-depth analysis of absorption features and stepwise multiple linear regression,”
Remote Sens. Environ., 67
(3), 267
–287
(1999). http://dx.doi.org/10.1016/S0034-4257(98)00084-4 RSEEA7 0034-4257 Google Scholar
E. F. Duke,
“Near-infrared spectra of muscovite, Tschermak substitution, and metamorphic reaction progress: implications for remote sensing,”
Geology, 22
(7), 621
–624
(1994). http://dx.doi.org/10.1130/0091-7613(1994)022<0621:NISOMT>2.3.CO;2 GLGYBA 0091-7613 Google Scholar
B. LacazeR. Joffre,
“Extracting biochemical information from visible and near infrared reflectance spectroscopy of fresh and dried leaves,”
J. Plant Physiol., 144
(3), 277
–281
(1994). http://dx.doi.org/10.1016/S0176-1617(11)81187-9 JPPHEY 0176-1617 Google Scholar
E. A. CloutisM. J. GaffeyT. F. Moslow,
“Characterization of minerals in oil sands by reflectance spectroscopy,”
Fuel, 74
(6), 874
–879
(1995). http://dx.doi.org/10.1016/0016-2361(95)00016-X FUELAC 0016-2361 Google Scholar
K. Randolphet al.,
“Hyperspectral remote sensing of cyanobacteria in turbid productive water using optically active pigments, chlorophyll a and phycocyanin,”
Remote Sens. Environ., 112
(11), 4009
–4019
(2008). http://dx.doi.org/10.1016/j.rse.2008.06.002 RSEEA7 0034-4257 Google Scholar
J. A. SennaC. R. S. FilhoR. S. Angelica,
“Characterization of clays used in the ceramic manufacturing industry by reflectance spectroscopy: an experiment in the Sao Simao ball-clay deposit,”
Appl. Clay Sci., 41
(1), 85
–98
(2008). http://dx.doi.org/10.1016/j.clay.2007.10.004 ACLSER 0169-1317 Google Scholar
A. V. Bilgiliet al.,
“Visible-near infrared reflectance spectroscopy for assessment of soil properties in a semi-arid area of Turkey,”
J. Arid Environ., 74
(2), 229
–238
(2010). http://dx.doi.org/10.1016/j.jaridenv.2009.08.011 JAENDR 0140-1963 Google Scholar
T. LammogliaC. R. S. Filho,
“Spectroscopic characterization of oils yielded from Brazilian offshore basins: potential applications of remote sensing,”
Remote Sens. Environ., 115
(10), 2525
–2535
(2011). http://dx.doi.org/10.1016/j.rse.2011.04.038 RSEEA7 0034-4257 Google Scholar
K. Yanget al.,
“Variations in composition and abundance of white mica in the hydrothermal alteration system at Hellyer, Tasmania, as revealed by infrared reflectance spectroscopy,”
J. Geochem. Explor., 108
(2), 143
–156
(2011). http://dx.doi.org/10.1016/j.gexplo.2011.01.001 JGCEAT 0375-6742 Google Scholar
C. Zhanget al.,
“Spectral response to varying levels of leaf pigments collected from a degraded mangrove forest,”
J. Appl. Remote Sens., 6
(1), 063501
(2012). http://dx.doi.org/10.1117/1.JRS.6.063501 1931-3195 Google Scholar
R. N. Clarket al.,
“USGS Digital Spectral Library splib06a,”
US Geol. Surv., Denver
(2007). Google Scholar
L. C. RowanM. J. KingstonJ. K. Crowley,
“Spectral reflectance of carbonatites and related alkalic igneous rocks: selected samples from four north American localities,”
Econ. Geol., 81
(4), 857
–871
(1986). http://dx.doi.org/10.2113/gsecongeo.81.4.857 ECGLAL 0361-0128 Google Scholar
E. Bedini,
“Mapping lithology of the Sarfartoq carbonatite complex, southern west Greenland, using HyMap imaging spectrometer data,”
Remote Sens. Environ., 113
(6), 1208
–1219
(2009). http://dx.doi.org/10.1016/j.rse.2009.02.007 RSEEA7 0034-4257 Google Scholar
FieldSpec 3 User Manual, ASD Inc., Boulder, CO
(2007). Google Scholar
R. N. Clark,
“Spectral properties of mixtures of montmorillonite and dark carbon grains: implications for remote sensing minerals containing chemically and physically adsorbed water,”
J. Geophys. Res., 88
(B12), 10635
–10644
(1983). http://dx.doi.org/10.1029/JB088iB12p10635 JGREA2 0148-0227 Google Scholar
R. N. Clarket al.,
“Imaging spectroscopy: earth and planetary remote sensing with the USGS Tetracorder and expert systems,”
J. Geophys. Res., 108
(E12), 1991
–2012
(2003). http://dx.doi.org/10.1029/2002JE001847 JGREA2 0148-0227 Google Scholar
A. A. GreenM. D. Graig,
“Analysis of aircraft spectrometer data with logarithmic residuals,”
Proc. Airborne Imaging Spectrometer Data Analysis, 111
–119 NASA-JPL Publication, Pasadena
(1985). Google Scholar
D. J. KetchenC. L. Shook,
“The application of cluster analysis in strategic management research: an analysis and critique,”
Strategic Manage. J., 17
(6), 441
–458
(1996). http://dx.doi.org/10.1002/(ISSN)1097-0266 SMAJD8 0143-2095 Google Scholar
Biography Jingjing Dai earned her BS degree in geology from China University of Geosciences (Beijing), in 2004 and the MS degree in cartography and geographic information system from Institute of Remote Sensing Applications, Chinese Academy of Sciences, Beijing, in 2007. She is currently working toward the PhD degree in Faculty of Earth Sciences, China University of Geosciences (Beijing). Her research interests include reflectance spectroscopy of minerals, alteration information exaction and metallogenic prognosis using multispectral and hyperspectral remote sensing.  Denghong Wang received the BE degree in mineral resource prospecting and exploration from Chengdu University of Technology, Chengdu, China, in 1989 and the MS and the PhD degree in mineralogy from Chinese Academy of Geosciences, Beijing, in 1992 and 1995, respectively. He is currently the head of geochemistry laboratory in Institute of Mineral Resources, Chinese Academy of Geological Sciences. His research interests include regional metallogenetic rules, rare earth ores, plume magmatism, etc.  Runsheng Wang received the BS degree in geophysics from Beijing Geological College in 1967 and the MS degree in remote sensing in geology from China University of Geosciences (Beijing), in 1982. He is currently Processor of China University of Geosciences (Beijing) and China Areo Geophysical Survey and Remote Sensing Center for Land and Resources. His research interests focused on remote sensing in geology.  Zhenghui Chen received his BS degree in geology from China University of Geosciences (Wuhan), in 1995, and the MS and the PhD degree in mineralogy from Chinese Academy of Geosciences, in 2001 and 2006, respectively. His research interests include regional metallogenetic rules and metallogenic prognosis. |