|
|
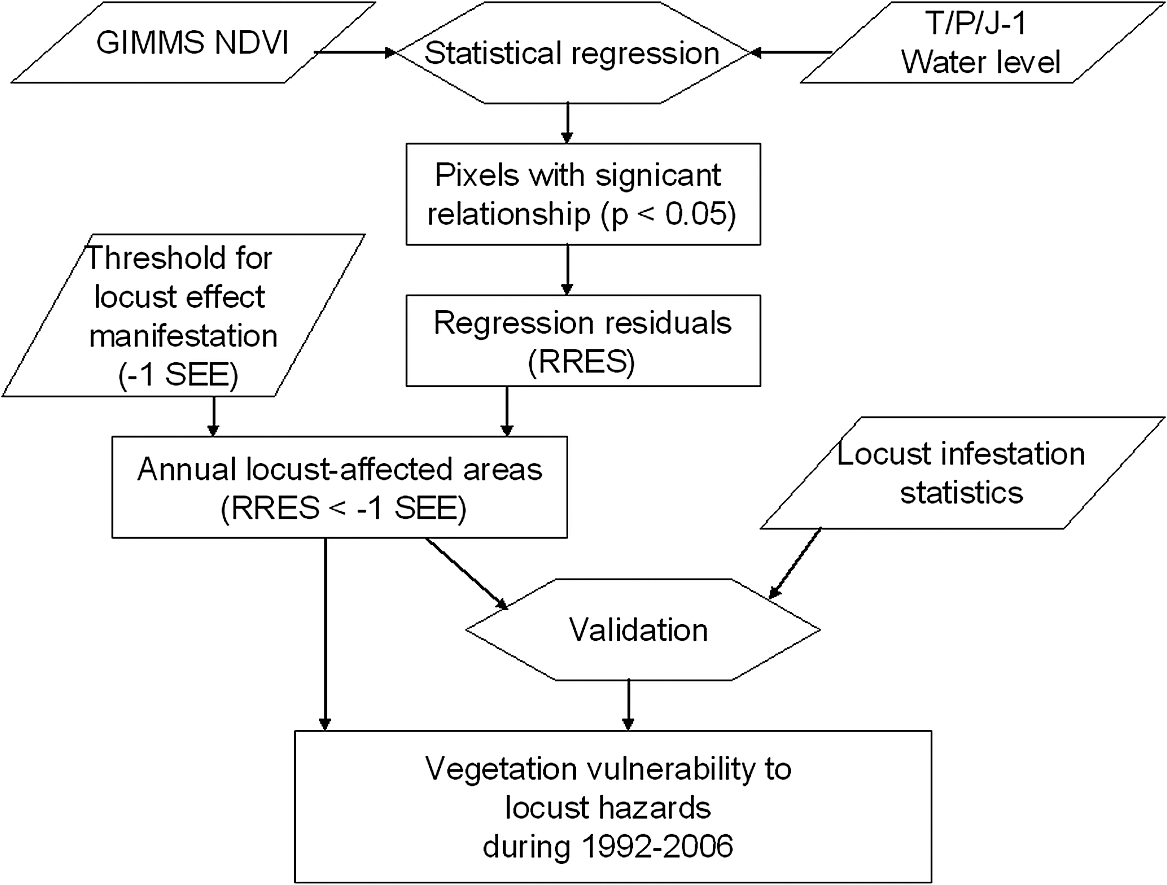
1.IntroductionLocust outbreaks and subsequent destruction of vegetation cover, including agricultural crops across large areas, is one of the most important environmental problems in dry regions of the world. Throughout human history, agricultural and pasture land has always been affected by locust plagues, and these plagues have had large effects on food security. Central Asia is one of the dry regions where locust hazard has always been an acute problem and locust outbreaks often resulted in catastrophic losses of agricultural production.1,2 In some years, locusts also occupied both rural and urban settlements, destructing the normality of traffic and causing considerable damage in settlement vegetated areas.3 The Asian migratory locust (Locusta migratoria migratoria) is the mean actor of the locust hazard in the Central Asian region. Particularly in the republics of Uzbekistan and Kazakhstan, this species has permanent breeding areas, where huge swarms of the Asian migratory locust are produced with a periodicity of 3 to 10 years.4 The drainage basin of Lake Balkhash in South-East Kazakhstan is one of the largest breeding areas of locusts in the region of Central Asia (Fig. 1). The reed grass-covered area of the River Ili delta represents the perfect habitat for locust oviposition and development.2 The development stages of Asian migratory locust in the Lake Balkhash drainage basin strongly coincide with the growing period of reed grass in the river deltas,1,2 which, in turn, strongly correlates with interannual and intraannual dynamics of the Lake Balkhash water level.5 As a consequence, the developmental pattern and population dynamics of the Asian migratory locust are synchronized with the hydrological regimen of its breeding areas. A recent study by Propastin6 demonstrated that the spatial extend of the annual areas of potential locust habitats strongly depends on environmental factors, particularly on the Lake Balkhash hydrological regime and air temperature in the Lake Balkhash drainage basin. The expansion of locust potential habitats leading to locust outbreaks is usually preceded by dry hot years and lower water levels in Lake Balkhash, when the commonly flooded reed grass areas become free from seasonal flooding. In contrast, years with higher water level in Lake Balkhash and lower temperature reduce the potential locust hazard risk. Fig. 1Drainage system (southern part only) of the Balkhash Lake. The study area—the River Ili delta—is marked by a rectangle. 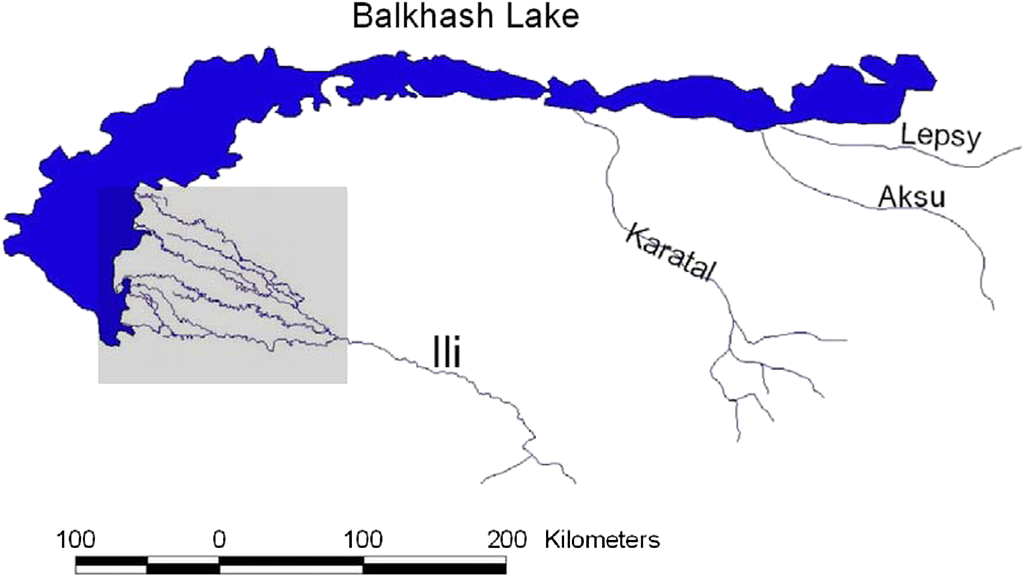 From this background, the water level of Lake Balkhash is one of the most important environmental factors in the context of the locust hazard in the region. Before 1970, both long-term and short-term fluctuations in the Lake Balkhash water level were conditioned primarily climatically and strongly correlated with the run-off from its contributors, primarily from the River Ili (about 80% from the total Balkhash Lake inflow).7 A rapid increase of human activity in the Balkhash Lake drainage basin after 1970 led to a growing anthropogenic impact on the hydrological regime of Lake Balkhash and, as a consequence, to a considerable drop of the water level in the lake.8,9 Fortunately, favorable climate conditions during last two decades10 overlapping with the glaciers melt in the northern Tien-Shan Mountains, the main feeding area of the Balkhash Lake contributors,11 imposed the current rise of the water level.12 However, the currently optimistic environmental situation of Lake Balkhash is confronted with the recent development of irrigated areas in the upper part of the Ili River in the Republic of China13 and the contemporary climate change.12,14 As it was demonstrated by recent studies,15,16 ongoing development of human activity and climate trends in the drainage basin can lead to disaster-like scenarios for the Balkhash Lake. Remote sensing is a powerful tool for observing vegetation cover and its conditions at all scales from local to global. Integration of remote sensing with geographic information systems makes the use of remotely sensed data one of the mean sources for assessing locust hazard. Remote sensing techniques have been applied for mapping potential locust habitats, forecasting infestation by locusts, and postdamage assessment in different regions.17 At the scales from local to subregional, data of fine spatial resolution from multispectral sensors onboard the Landsat satellites have commonly been used for mapping of locust habitats.18–20 Coarse- and medium-spatial resolution data sets with global coverage originating from a number of satellite systems such as advanced very high resolution radiometer (AVHRR), satellite pure observation d’Tierra (SPOT), and moderate resolution imaging spectroradiometer (MODIS) have become available to the scientific community for all thinkable applications in recent years. Several studies showed good suitability of these data for mapping locust habitats and monitoring habitat conditions in various regions.21,22 Among a number of various satellite-based vegetation indices, routinely produced from AVHRR, SPOT, and MODIS sensors, the normalized difference vegetation index (NDVI) is the most used product for such studies.23–26 The NDVI serves as a general indicator of vegetation greening and is derived from the red and near-infrared portions of reflected radiation.27 where is the red portion of the spectrum and NIR the near-infrared portion of the spectrum. The NDVI correlates strongly with various characteristics of vegetation canopy, such as biomass, fractional vegetation cover, leaf area index, and fraction of the photosynthetically active radiation.28,29With respect to the Republic of Kazakhstan, some progress has been achieved in the remote sensing based monitoring of locust hazard.4,6,18,30 However, the achieved progress is not enough to close the existing research gap in this data impoverished country. Developing and establishing effective and powerful systems for monitoring locust hazard and assessment of locust impacts on vegetation cover in Kazakhstan remains to be a research field of great importance. This study aims to make a small but important contribution to current research in the field of locust hazard monitoring in Kazakhstan. The study develops a multisensor-based monitoring system for detecting postdamage and assessing overall vegetation susceptibility to locust hazards in one of Kazakhstan’s locust breeding areas—the delta of the River Ili, the main contributor to the Balkhash Lake. In doing so, this study strives to contribute to the rare current literature from the Balkhash Lake drainage basin6,18 through introducing and testing a new locust hazard monitoring approach. The novelty of the proposed monitoring system is that it combines data from two satellite sources—multitemporal AVHRR NDVI and radar altimetry data—in order to model response of vegetation cover to the hydrological regimen of the River Ili. Temporal change in the strength of the modeled vegetation response serves then as an indicator for vegetation damage due to locust infestation. The developed monitoring system is employed for (1) mapping the spatial distribution and temporal change of potential habitats for locust breeding and (2) evaluating vegetation cover of the River Ili delta with respect to its general vulnerability to locust hazard during a period of 15 years. 2.Data and Methods2.1.Water-Level DataFor the present study, we obtained recorded variations of water level of Lake Balkhash, for the period from 1992 through 2006, based on satellite radar altimetry data. Two altimetry data sets were used for derivation of the water-level data: ground tracks of topography experiment (TOPEX)/Poseidon (T/P) with a 9.915625-day repetition time and Jason 1, the follow-up mission to T/P, which was launched in 2001. Similar to T/P, the Jason 1 orbital repeatability is every 9.915625 days with the same global coverage. The main product of the altimetry missions is the surface-level height in meters. These data were then used to derive variations of water level of Lake Balkhash for the study period. The obtained altimetry-derived estimates were validated against the available data from level gauges. The process of derivation and reliability of the satellite-derived estimates for the Balkhash Lake level is presented in detail by Propastin.12 In brief, the T/P-based estimates correlate very strongly with the available data from level gauges (, ). 2.2.Global Inventory Monitoring and Modeling Studies NDVI DataWe used global inventory monitoring and modeling studies (GIMMS) NDVI dataset compiled at 8-km spatial resolution from the AVHRR data by the GIMMS research group.31 The GIMMS NDVI data are distributed as 30-day maximum value composites to minimize effects of cloud contamination.32 Preprocessing includes minimization of noise resulting from residual atmospheric effects, orbital drift effects, intersensor variations, and stratospheric aerosol effects by a series of corrections, including temporal compositing, spatial compositing, orbital correction, calibration for sensor drifts, and atmospheric correction.31 In order to remove some nonvegetated artifacts remaining in the GIMMS NDVI data set, we carried out an additional calibration of the data set against three invariant desert targets located in Taklimakan desert using a method described by Los33 After that, the data were averaged to generate a mean growing season value of NDVI for each year of the period 1992 to 2006. Since locust damage commonly occurs over a relatively short period of year, mean values over shorter periods (two to three months) were also generated and used in the further analysis. 3.Monitoring System for Detection of Locust Infestation3.1.Conceptual FrameworkThe regression residuals-based model for detecting locust infestation areas developed in this study is similar to the concept for identifying and removing climate signal from interannual NDVI dynamics in previous studies by Propastin et al.34 For the aims of the present study, the concept was modified to enable identifying and removing the interannual signal of water level from the interannual NDVI dynamics of vegetation in the Ili delta. The modified concept and the developed model are addressed in this section. As reported by Propastin,5 vegetation conditions in the Ili delta and the extent of reed grass areas are highly dependent on water level of the Lake Balkhash. The study by Propastin6 demonstrated the influence of the Balkhash Lake water level on the extent of locust hazard risk areas in the Ili delta. From this background, we can quantify the control of the Balkhash Lake water level on vegetation in the reed grass areas of the Ili delta. The control of the Balkhash Lake water level on vegetation in the Ili delta should be predicable in each pixel and every year during the modeling period. It means that the response of reed grass vegetation to the water level is relatively constant over the time. However, some external factors may affect the response of reed grass vegetation to the water level. One such factor is human activity. Taking into account the unimportant impact of human activity on the reed grass vegetated areas in the Ili delta after the collapse of the Soviet Union, we can neglect this factor by our modeling. Another external factor can be fire. Since the Ili delta has no permanent population and is very rarely visited by people, the fire factor can also be neglected. From this reason, we suggested that the single external factor that may affect the reed grass vegetation in the Ili delta is locust plague. Therefore, a suddenly distorted response of reed grass vegetation to the water level of Lake Balkhash can be explained by a massive locust infestation of the area. Based on these assumptions, locust-infected areas can be detected for each year. Along the above lines, a monitoring system for detecting locust-infested areas in the Ili delta should comprise several components that are aimed 3.2.Locust Hazard Monitoring System and Its ImplementationIn our monitoring system, we employed a simple statistical regression between the annual GIMMS NDVI and mean annual T/P/JASON water-level estimates to quantify the response of vegetation to the water level of Lake Balkhash at the per-pixel level during the study period of 1992 to 2006. Pixels showing a strong statistically significant relationship between the variables were assigned as highly respondent areas, which after that were used for additional analyses. For detection of abrupt changes in the vegetation response to the water level, we calculated regression residuals and examined them with respect to their sign (positive/negative) and value. As was shown in previous studies,34–36 negative residuals with abnormal values indicate abrupt changes in the vegetation response to its controlling factor (in the present study, the controlling factor is the water level) through strong impact of any external factor, e.g., in the present study, these residuals should be associated with locust infestation of vegetation. At the pixel level, regression models between the best correlated NDVI and the annual water level were established and residuals were obtained (Fig. 2) and their values were examined. In order to detect abnormal residuals, we established thresholds above/under which a residual is suggested to have an abnormal value. For establishing the thresholds, we used standard error of estimation (SEE) calculated as where is the observed NDVI, is the regression-based estimate for NDVI, and is the amount of samples (in our case, years of the study period).Fig. 2Regression between normalized difference vegetation index (NDVI) of a sample pixel in the Ili delta area and the water level of Lake Balkhash. Thresholds of standard error of estimation (SEE) along the regression line are presented by dashed lines. Negative residuals with values below the threshold of SEE are marked with circles. 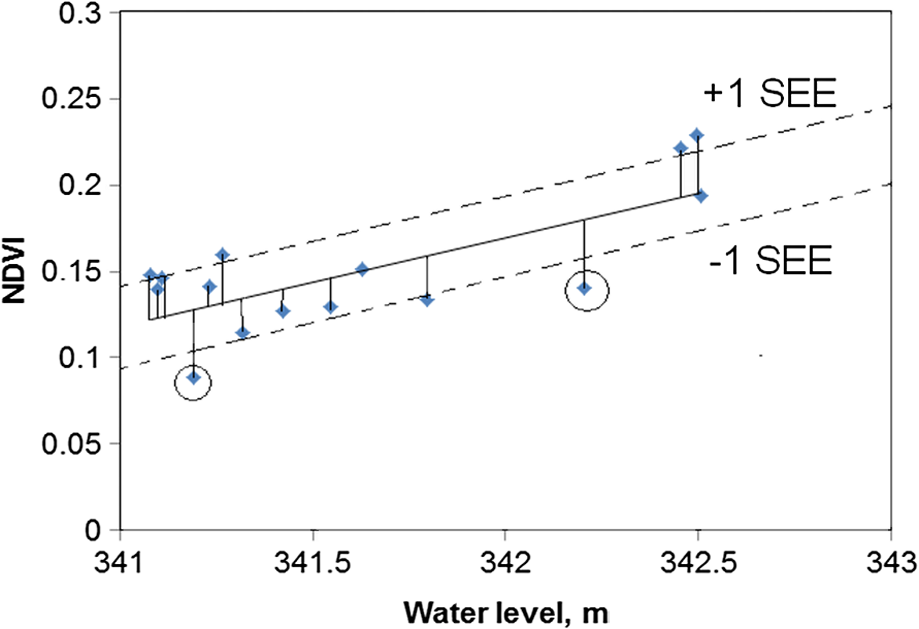 Using the thresholds, for each year from the period 1992 to 2006, we detected all pixels in the high response area (reed grass area) with abnormally negative values. According to the general concept above, these pixels should represent locust-infested areas. The extent of the model-estimated locust-infested area was compared with the reality. For this, we compared the estimated annual area of locust infestation with statistics of locust infestation surveys in the Ili delta during the study period. The flow chart in Fig. 3 illustrates the different processing steps involved in the assessment of vegetation infestation by locusts using the satellite-based NDVI and water-level variations of Lake Balkhash. The input data for the monitoring system are presented in trapezes, while the intermediate and final output data are presented in rectangular squares. 3.3.Vegetation Vulnerability to Locust HazardsThe spatial extents of the annual locust-related changes cannot be coherent between locust hazards from different years. It means that the recurrence of the locust-related annual vegetation changes during the study period (1992 to 2006) are different for each area. Obviously, the more vulnerable an area is to locust hazard, the more frequently the locust-caused vegetation changes occur in this area. From this background, we used the recurrence of the locust-driven vegetation changes during the period 1992 to 2006 as a criterion for an assessment of general vulnerability of the Ili delta vegetation to locust hazard. After we had detected annual areas of locust-affected vegetation, we recoded the produced annual maps. Pixels, considered to be representing the locust-infested vegetation areas, were signed by 1, others by 0. After that, recurrence of locust-caused vegetation changes throughout the study period was calculated by summing up the produced binary-recoded map layers. A map of a general vulnerability of the Ili delta vegetation to locust hazard was then produced by rearranging the obtained sum values into three vulnerability classes—high, moderate, and low vulnerable. 4.Results4.1.Correlation Between Water Level of Lake Balkhash and Ili Delta NDVIThe Lake Balkhash water level increased with a mean annual rate of during the study period [Figs. 4(a) and 4(b)]. However, at least two shorter oscillations of the lake water level can be emphasized. The first short rise period was observed during 1992 to 1995 and ended in 1995 with a local maximum of 341.3 m. After that, the water level of Lake Balkhash was characterized by a short fall phase and reached a local minimum of 340.5 m in 1998. From 1998 to 2005, the Balkhash Lake water level increased with a value of . In 2005, the water level of Lake Balkhash achieved the study period maximum, 342.5 m. In 2005 and 2006, the Lake Balkhash level slightly dropped to a value of 342.4 m. The general upward trend of the water level was statistically significant with a and . Fig. 4(a) Time-series of mean May to June NDVI of the Ili delta and water level of Lake Balkhash during the period 1992 to 2006. (b) Correlation between the spring NDVI means averaged over the Ili delta and Lake Balkhash water level. (c) Correlation between the May to June NDVI and precipitation averaged over the Ili delta.  The Ili delta NDVI showed a strong upward trend during the study period. All examined aggregated periods (annual means, spring means, and May to June means) were characterized by statistically significant upward trends. Figure 4(a) shows the interannual trend of the May to June NDVI as compared with the trend of the Balkhash Lake water level. It increased with a mean annual rate of . The upward trend of the Ili delta May to June NDVI was statistically significant at the level of 0.0001 and has a high value of the determination coefficient, . The patterns of the Ili delta NDVI dynamics are generally identical with those of the water level of Lake Balkhash, detecting a close relationship between both variables [Fig. 4(b)]. In order to test if there is some effect of rainfall on vegetation of the River Ili delta, which could contribute to the NDVI trends, we calculated correlation between the NDVI and precipitation averaged over the Ili delta. None of the used NDVI data sets (the annual mean, the spring, the May to June NDVI) shows any statistically significant correlation with the precipitation. For illustration, Fig. 4(c) demonstrates one of the examined relationships. From this reason, we can suggest that the observed positive relationship between water levels and NDVI is due to the effect of flooding water. 4.2.Detecting High-Susceptible AreasAt the pixel level, value of the correlation coefficient varied considerably across the Ili Delta area detecting pixels that are highly sensitive to variations of the water level (Fig. 5). Most of these pixels (correlation values ) are located in the middle and northern parts of the Ili delta, where vegetation cover is represented by large areas of reed grass. Additionally, many pixels south of the delta also show strong correlation. There are a number of small perennial river channels in this part of the study area that can be flooded in some years. Therefore, some pixels in this area can demonstrate correlation with the water levels. Normally, the reed grass areas are covered with water by seasonal floods during the first half of the vegetation growth period (April/first half of July); most of them become free from flooding water in the late summer. In particular, this period (second half of July/August) is characterized by high susceptibility of the reed grass areas to locust hazard. These areas represent perfect habitats for locust breeding after they become free of flooding water in the late summer. Fig. 5Correlation coefficient between mean spring NDVI and water level of Lake Balkhash during the period 1992 to 2006. Pixels with correlation coefficient are characterized by high susceptibility to locust hazard.  We compared spatial distribution of the high-sensitivity pixels with spatial pattern of high-risk areas in the Ili delta provided by recent studies.6,18 Taking into account the large difference in spatial resolution of the used data sets—30-m Landsat data by Sivanpillai et al.,18 1000-m resolution vegetation (VGT)SPOT-VGT data by Propastin,6 and 8-km resolution in the present study—the spatial pattern of sensitive pixels in Fig. 3 is, in great part, similar to the areas of high locust risk in the two earlier studies. Moreover, the total area of highly susceptible pixels from this study (about or 30% from the total Ili delta area) is largely coincident with the estimations of locust high-risk area reported by Sivanpillai et al.18 and Propastin.6 This reveals good suitability of the used method to detect areas of high susceptibility to locust infestation. The results also prove a good appropriateness of the coarse-resolution satellite data for our study. This means that the signal of vegetation change due to external factors is very detectable in the 8-km resolution pixels of National Oceanic and Atmospheric Administration (NOAA) AVHRR. The reason for good suitability of the very coarse-resolution data is the huge spatial extent of the effects of locust hazard in the study area. Taking into account the size of the Ili delta (about 200 to 150 km, compare Fig. 1) and the common extent of locust damage areas (several hundreds and thousands ), the size of the NOAA AVHRR pixel () is reasonable to capture the signal of vegetation change in highly-susceptible areas. However, at this place we should mention that the very coarse resolution may not always be suitable for application in other regions where the spatial extent of locust damage is not as huge as in the Ili delta. 4.3.Detecting Locust-Infested AreasAfter the water-level effect on the interannual dynamics of NDVI in the high-susceptible areas had been removed for each year from the period 1992 to 2006, we detected pixels that experienced unexpected vegetation degradation. The value of an NDVI residual lower than the threshold ( SEE) served as an indicator for unexpected degradation of vegetation. Since anthropogenic impact in the Ili delta is nonsignificant, the reason for the rapid degradation of vegetation in these years was suggested to be locust infestation. Figure 6 presents pixels with NDVI residuals below the threshold of SEE, which are considered to represent locust-infested areas, while Fig. 7(a) presents total area of locust infestation for each year from the period 1992 to 2006. The retrieved locust-infested area shows strong interannual dynamics with five maximums in the years 1994, 1997, 2000, 2002, and 2005. These area maximums reflect locust outbreaks in the Ili delta in the corresponding years. A comparison of the modeled area with the data obtained by locust surveys for the period 1997 to 2005 demonstrates a good coincidence in the interannual dynamics of the compared data sets. Particularly, locust outbreaks in 2000, 2002, and 2005 have good correspondence in the data set dynamics. The scatter-plot in Fig. 7(b) reveals that the correlation between the modeled locust-infested area and that found to be affected by locust damage is statistically significant (, ), detecting good suitability of the monitoring system for mapping locust-infested areas in the Ili delta. Fig. 6Maps of negative outliers ( SEE) for each year of the period 1992 to 2006. The outliers are presented by white squares. The area coverage is similar to the area in Figs. 5 and 8.  Fig. 7(a) Interannual dynamics of locust-infested areas in the Ili delta modeled by the monitoring system and found to be affected by locust damage. (b) Scatter plot of the two data sets. The data of the locust-affected areas in the River Ili delta were compiled from recently published studies3,18 and public media. 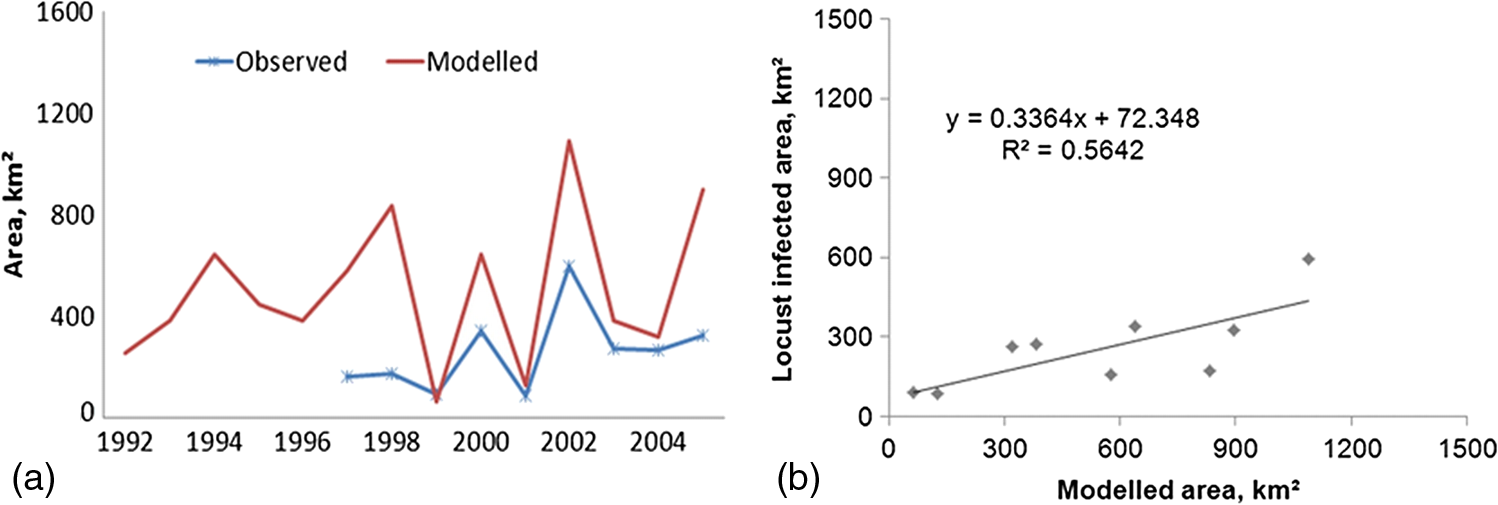 4.4.Mapping Overall Vulnerability of Vegetated Areas to Locust HazardIn order to evaluate the overall vulnerability of Ili delta vegetation to locust hazard, we analyzed the total occurrence of locust-caused annual vegetation changes throughout the study period. For different pixels, the occurrence of these changes ranged from 0 to 9. After that, we divided the total occurrence range into three similar-span classes and established the following categories for overall vegetation vulnerability: low vulnerable (1 to 3), moderate vulnerable (4 to 6), and high vulnerable (). Figure 8 illustrates a resulted map of overall vulnerability of vegetation in the Ili delta to locust hazards during the period 1992 to 2006 as derived from our monitoring system. About 80% of the total Ili delta area (about ) is not vulnerable to locust hazards. About 8.5% of the total area is characterized by moderate vulnerability and 2.9% of the area is characterized by low vulnerability of vegetation to locust hazards; 8.7% showed high vulnerability. These results suggest that a total of 20% of the Ili delta area experienced locust-caused damage of vegetation during the period 1992 to 2006. Considering the high-susceptibility area from the map in Fig. 5, of the detected high-susceptible pixels are characterized by a single or repeated locust-caused damage of vegetation during the period 1992 to 2006. 5.ConclusionsIn this study, the GIMMS NDVI data from the AVHRR sensor were combined with radar altimetry estimates of the water level of Lake Balkhash to evaluate reed grass vegetation susceptibility to locust hazards and the total damage of vegetation caused by locust infestations during the period of 1992 to 2006. A new monitoring and evaluation system for locust hazard vulnerability in the River Ili delta has been presented in this study. This system used the correlation between NDVI anomalies and the water level of Lake Balkhash as a major indicator for response of reed grass vegetation in the River Ili delta to locust impacts. Based on conclusions from recent studies by2,6,18 pixels with strong response to the lake water level were suggested to represent the locust high-susceptibility area. Extensive negative anomalies of annual NDVI in the high-susceptibility area sustained by strong correlations with the lake water level were considered to indicate the statistically significant () changes of vegetation activity caused by locust invasions. A total quantity of these changes throughout the period 1992 to 2006 calculated for each individual pixel in the high-susceptibility area was suggested to be a representative indicator for overall long-time vulnerability of vegetation to locust hazards in the River Ili delta. The study defines spatial patterns of overall vegetation vulnerability to locust hazards in the River Ili delta. The locust-vulnerable areas take of the entire Ili delta territory. This result coincides well with locust-risk area estimates provided in recent studies by Sivanpillai et al.18 and Propastin.6 The results of this study may be helpful for monitoring and forecasting locust impacts on vegetation cover in the River Ili delta and can provide basic knowledge and data for planning of protection activities. ReferencesE. P. Tsyplenkov, Vrednye sarantchevye nasekomye v SSSR, Kolos-Publisher, Leningrad, Kolos
(1970). Google Scholar
V. E. Kambulin,
“Poiskovyi prognoz massovyh razmnozheniy aziatskoy saranchi (Locusta migratoria L.) v Balkhash-Alakol’skom gnezdilitche,”
Ecologia, 1 81
–84
(1992). ECOGDF 0367-0252 Google Scholar
K. ToleubayevK. JansenA. van Huis,
“Locust control in transition: the loss and reinvention of collective action in post-soviet Kazakhstan,”
Ecol. Soc., 12
(2), 38
–55
(2007). ECECEM Google Scholar
A. V. Latchininskyet al.,
“Can yearly season Landsat images improve locust habitat monitoring in the Amudarya River Delta of Uzbekistan?,”
J. Orthoptera Res., 16
(2), 167
–173
(2007). http://dx.doi.org/10.1665/1082-6467(2007)16[167:CESLII]2.0.CO;2 1082-6467 Google Scholar
P. Propastin,
“Simple model for monitoring Balkhash Lake water levels and Ili River discharges: application of remote sensing,”
Lakes Reservoirs Res. Monitor., 13 77
–82
(2008). http://dx.doi.org/10.1111/j.1440-1770.2007.00354.x 1320-5331 Google Scholar
P. Propastin,
“Multi-sensor monitoring system for assessment of locust risk in the Lake Balkhash drainage basin,”
Environ. Manage., 50
(6), 1234
–1246
(2012a). http://dx.doi.org/10.1007/s00267-012-9950-2 JEVMAW 0301-4797 Google Scholar
A. V. Shnitnikov,
“Water balance variability of lakes Aral, Balkhash, Issyk-Kul and Chany,”
in Hydrology of Lakes,
130
–140
(1973). Google Scholar
T. Petr,
“Lake Balkhash, Kazakhstan,”
Int. J. Salt Lake Res., 1
(1), 21
–46
(1992). http://dx.doi.org/10.1007/BF02904950 1008-858X Google Scholar
K. KezerH. Matsuyama,
“Decrease of river runoff in the Lake Balkkhash basin in Central Asia,”
Hydrol. Process., 20
(6), 1407
–1423
(2006). http://dx.doi.org/10.1002/(ISSN)1099-1085 HYPRE3 1099-1085 Google Scholar
H. MatsuyamaK. Kezer,
“Long-term variation of precipitation around Lake Balkhash in Central Asia from the end of the 19th century,”
SOLA, 5 73
–76
(2009). http://dx.doi.org/10.2151/sola.2009-019 Google Scholar
V. B. Aisenet al.,
“Climatic and hydrological changes in the Tien-Shan, Central Asia,”
J. Clim., 10
(6), 1393
–1404
(1997). http://dx.doi.org/10.1175/1520-0442(1997)010<1393:CAHCIT>2.0.CO;2 JLCLEL 0894-8755 Google Scholar
P. Propastin,
“Patterns of the Balkhash Lake level change and its climatic correlates during the period 1992–2010,”
Lakes Reservoirs Res. Manage., 17
(3), 161
–169
(2012b). http://dx.doi.org/10.1111/lre.2012.17.issue-3 1320-5331 Google Scholar
P. Propastin,
“Problems of water resource management in the drainage basin of Lake Balkhash with respect to political development,”
Climate Change and the Sustainable Management of Water Resources, 449
–462 Springer Verlag, Berlin
(2011a). Google Scholar
S. IbatulinV. YasinskyA. Mironenkov,
“The impact of climate change on water resources in Central Asia,”
(2009). Google Scholar
A. A. Tursunov, From the Aral Lake to the Lobnor Lake: Hydrology of the Dischargeless Drainage Basins of Central Asia, Galym-Publishers, Almaty, Kazakhstan
(2002). Google Scholar
P. Propastin,
“Assessment of climate-, and human-induced disaster risk over shared water resources in the Balkhash Lake drainage basin,”
in Climate change andDisaster Risk Management,
41
–53
(2013). Google Scholar
A. V. LatchininskyR. Sivanpillai,
“Locust habitat monitoring and risk assessment using remote sensing and GIS technologies,”
Integrated Management of Arthropod Pests and Insect Borne Diseases, 161
–186 Springer, Dordrecht-Heidelberg-London-New York
(2010). Google Scholar
R. Sivanpillaiet al.,
“Mapping locust habitats in River Ili delta, Kazakhstan, using Landsat imagery,”
Agric. Ecosyst. Environ., 117
(2–3), 128
–134
(2006). http://dx.doi.org/10.1016/j.agee.2006.03.028 AEENDO 0167-8809 Google Scholar
J. W. Maet al.,
“Monitoring East Asian migratory locust plagues using remote sensing data and field investigations,”
Int. J. Rem. Sens., 26
(3), 629
–634
(2005). http://dx.doi.org/10.1080/01431160310001595019 IJSEDK 0143-1161 Google Scholar
F. VossU. Dreiser,
“Mapping of desert locust habitats using remote sensing techniques,”
New Strategies in Locust Control, 37
–45 Birkhäuser, Basel/Boston/Berlin
(1997). Google Scholar
R. SivanpillaiA. V. Latchininsky,
“Mapping locust habitats in Amudarya River delta, Uzbekistan with multi-temporal MODIS imagery,”
Environ. Manage., 39
(6), 876
–886
(2007). http://dx.doi.org/10.1007/s00267-006-0193-y JEVMAW 0301-4797 Google Scholar
R. Jiet al.,
“Use of MODIS data to monitor the oriental migratory locust plague,”
Agric. Ecosyst. Environ., 104
(3), 615
–620
(2004). http://dx.doi.org/10.1016/j.agee.2004.01.041 AEENDO 0167-8809 Google Scholar
J. A. TratalosR. A. Cheke,
“Can NDVI-GAC imagery be used to monitor desert locust breeding areas?,”
J. Arid Environ., 64
(2), 342
–356
(2006). http://dx.doi.org/10.1016/j.jaridenv.2005.05.004 JAENDR 0140-1963 Google Scholar
E. DesplandJ. RosenbergS. J. Simpson,
“Landscape structure and locust swarming: a satellite’s eye view,”
Ecography, 27
(3), 381
–391
(2004). http://dx.doi.org/10.1111/eco.2004.27.issue-3 ECOGEG 0906-7590 Google Scholar
Z. Liuet al.,
“Relationship between oriental migratory locust plague and soil moisture extracted from MODIS data,”
Int. J. Appl. Earth Obs. Geoinf., 10
(1), 84
–91
(2008). http://dx.doi.org/10.1016/j.jag.2007.09.001 0303-2434 Google Scholar
Y. Zhaet al.,
“Temporal filtering of successive MODIS data in monitoring a locust outbreak,”
Int. J. Rem. Sens., 26
(24), 5665
–5674
(2005). http://dx.doi.org/10.1080/01431160500196349 IJSEDK 0143-1161 Google Scholar
C. J. Tucker,
“Red and photographic infrared linear combinations for monitoring vegetation,”
Rem. Sens. Environ., 8
(2), 127
(1979). http://dx.doi.org/10.1016/0034-4257(79)90013-0 RSEEA7 0034-4257 Google Scholar
G. M. Asraret al.,
“Estimating absorbed photosynthetically active radiation and leaf area index from spectral reflectance in wheat,”
Agron. J., 76
(2), 300
–306
(1984). http://dx.doi.org/10.2134/agronj1984.00021962007600020029x AGJOAT 0002-1962 Google Scholar
C. S. Daughtryet al.,
“Spectral estimates of absorbed radiation and phytomass production in corn soybean canopies,”
Rem. Sens. Environ., 39
(2), 141
–152
(1992). http://dx.doi.org/10.1016/0034-4257(92)90132-4 RSEEA7 0034-4257 Google Scholar
A. V. Latchininsky,
“Locust control in Central Asia: MiGS versus micronairs,”
Outlooks Pest Manage., 18
(3), 100
–105
(2007). http://dx.doi.org/10.1564/18Jun02 OPMUB8 1743-1026 Google Scholar
J. E. PinzonM. E. BrownC. J. Tucker,
“Global inventory modelling and mapping studies (GIMMS) AVHRR 8-km normalized difference vegetation index (NDVI) data set. Product guide,”
(2004) http://www.landcover.org/library/guide/GIMMSdocumentation_NDVIg_GLCF.pdf August 2013). Google Scholar
B. N. Holben,
“Characteristics of maximum-value composite images from temporal AVHRR data,”
Int. J. Rem. Sens., 7
(11), 1417
–1434
(1986). http://dx.doi.org/10.1080/01431168608948945 IJSEDK 0143-1161 Google Scholar
S. O. Los,
“Calibration adjustment of the NOAA AVHRR normalized difference vegetation index without resource to component channel 1 and 2 data,”
Int. J. Remote Sens., 1
(10), 1907
–1917
(2008). http://dx.doi.org/10.1080/01431169308954011 1477-7835 Google Scholar
P. PropastinM. KappasN. Muratova,
“A remote sensing based discrimination between climate/human-induced vegetation changes in Central Asia,”
Manage. Environ. Qual. Int. J., 19
(5), 579
–596
(2008). http://dx.doi.org/10.1108/14777830810894256 1477-7835 Google Scholar
K. J. Wesselset al.,
“Can human-induced land degradation be distinguished from the effects of rainfall variability? A case study in South Africa,”
J. Arid Environ., 68
(2), 271
–297
(2007). http://dx.doi.org/10.1016/j.jaridenv.2006.05.015 JAENDR 0140-1963 Google Scholar
C. T. Omutoet al.,
“Mixed-effects modelling of time-series NDVI-rainfall relationship for detecting human-induced loss of vegetation cover in drylands,”
J. Arid Environ., 74
(11), 1552
–1563
(2010). http://dx.doi.org/10.1016/j.jaridenv.2010.04.001 JAENDR 0140-1963 Google Scholar
Biography Pavel Propastin received the MSc degree from Georg-August University of Göttingen, Germany, in 2003 and the PhD degree in physical geography from this university in 2007. He is currently a senior scientist at the Department of Bioclimatology and at the Department of GIS and Remote Sensing, Georg-August University of Göttingen. His research interests include remote sensing and modelling of terrestrial ecosystems, analysis of climate effects and human impacts on ecosystems and information engineering for environmental systems. |