|
|
1.IntroductionInfrared thermography (IRT) is a fundamental remote sensing technique in many science and engineering applications, such as monitoring of electrical and mechanical installations under serviceability conditions,1 solar power plant monitoring,2 defense and security,3,4 medicine,5 etc. In the domain of conservation and maintenance of existing buildings, the literature reports several works showing the effective usage of IRT for various tasks such as localization, visualization, and analysis of anomalies.6–8 In particular, IRT is a valuable diagnostic tool for predictive maintenance, allowing the identification of thermal bridges, water infiltration, and energy leaking from the building’s envelope.9 Several studies are trying to define the best conditions for thermal data acquisition depending on several factors: typology of the defects to be detected, façade orientation, solar exposition, humidity, finishing materials, and image acquisition geometry.10 A well-known major limitation in IRT surveys is connected to the narrow field-of-view (FoV) of infrared (IR) cameras adopted for close-range applications.6 The analysis of a single thermographic image can be sufficient for identification of localized phenomena. However, in the case of large constructions or when thermal anomalies are evident only at a larger scale, the analysis of a single image may not be enough. In order to partially overcome this problem, we present a solution based on the fusion of different thermal images mapped together on a three-dimensional (3-D) model created with terrestrial laser scanning (TLS) technology.11,12 The proposed method integrates advanced surveying techniques like photogrammetry13 and laser scanning to thermal analysis: the geometric content of laser scanning data and the temperature information derived from IRT are combined into a single framework. In particular, the procedure follows a scheme that goes from data acquisition (images and laser scans) up to image orientation, texture mapping, and generation of the final products (Fig. 1). These result in a thermography-textured 3-D digital model of a building. This model can be interactively browsed, opening the way for new possibilities for the investigators. Thermography-textured models can be uploaded in a web browser, as a web-viewable virtual-reality (VRML) file, allowing their on-line exploration. Starting from the textured model, raster products can also be obtained, like thermographic mosaics, orthophotos, and rectified images. Fig. 1Flowchart of the developed method for texturing infrared (IR) thermal and RGB images on three-dimensional (3-D) building models.  The process aimed at applying a texture to a 3-D model is called texture mapping. This problem is well known when RGB images are employed. Different commercial packages allow the users to accomplish this task, although generally they are applied as “black boxes” without a full control of the processing parameters. Moreover, a time-consuming final editing is often needed. Here, the aim is to texture complex 3-D models with thermal images that feature a much lower geometric resolution compared to the one of RGB data. Thermal cameras for building inspection feature a narrow FoV that is suitable to reach structural elements far from the sensor stand-point. Both of these aspects may generate problems in commercial software packages. For this reason, we have developed an ad-hoc procedure for IR texture mapping. In order to have rigorous mapping on detailed 3-D models, the intrinsic calibration of the IR camera and the coregistration of both thermal image and laser scans are needed. The geometric aberrations of the IR camera lens may result in significant distortions in the mapping process of the thermal images onto the geometric model, which become more evident in the overlapping zones. These distortions can be properly modeled and mitigated due to the camera calibration procedure, which is a standard task in photogrammetry and computer vision applications. However, the reduced geometric resolution and the narrow FoV of IR sensors make the calibration procedure a nontrivial aspect. Also, the coregistration of the thermal images and the geometric 3-D model of the building may turn into a complicated task. According to the structure of the surface and to the image acquisition procedure, the problem can be coped with different ways. A simple homographic transformation can be correctly used only when the 3-D model of the building façade is flat. If the surface has a more complex 3-D shape, this model does not hold any more (exception is made for almost flat objects with only small off-plane parts). Two solutions are then possible, both based on 3-D perspective transformations: (1) single image resection or (2) bundle adjustment of a set of images (usually referred to as “block of images”). The former technique is the most popular in the case of thermal images, but unfortunately it is a time-consuming approach because each image has to be processed individually. Furthermore, the achievable accuracy of the orientation with texture-less images can be questionable. The latter has the advantage of exploiting common points between images, reducing the total number of points to be measured. Unfortunately, the resolution and the limited angle of view of the IR sensors may result in an acquisition scheme of thermal images, which is not adequate for a stable bundle-block adjustment. In this paper, we present a procedure which overcomes some of these limitations. The developed methodology makes use of thermal and RGB images acquired independently, e.g., even on different days. However, the combined orientation of both datasets and the larger resolution and format of RGB images help to compute the orientation of thermal images. As will be shown in the following sections of the paper, this method is not a general solution for any application. In Ref. 14, the use of a “bi-camera” system was demonstrated to be successful in the case of texture-less objects. On the other hand, after several experiments on the main campus of Politecnico di Milano University, where a restoration project is currently in progress, the feasibility and usefulness of the proposed approach for real surveying applications have been assessed. 2.Texture Mapping of 3-D Models with Thermal ImagesThis section presents different procedures to overcome some of the limitations listed in Sec. 1, including IR camera intrinsic calibration, image orientation, and texture of 3-D building models. 2.1.Thermal Camera Intrinsic CalibrationIn order to use a camera for photogrammetric purposes, its calibration15 should be carried out to determine the interior orientation parameters and to compensate for the effects of lens geometric distortion. In the applications considered in this study, neglecting the correction of distortions may lead to a significant worsening of the final quality of the textured model. In the case of IRT sensors, the pinhole camera model can be assumed and calibration applied by using standard photogrammetric methods. However, IRT cameras are not designed for metric purposes and their calibration may not be an easy task for a series of reasons (see also Ref. 14):
All these aspects should be taken into account for planning the calibration project in order to fix a proper set of “best practice rules” to be generally adopted. The camera AVIO TVS700, further used in this work for IRT surveys, was calibrated by using the Brown’s model,16 which is based on eight parameters (principal distance, principal point coordinates, three coefficients for radial distortion compensation, and two parameters for decentering distortion). These parameters can be estimated by using a proper calibration target set (Fig. 2), which must be imaged from different positions. An important aspect concerning the target set is that its points have to be clearly visible in the IR images. The solution here adopted is based on a set of 40 iron nails fixed in a wooden structure. When exposed to sunlight, nails warm up faster than wooden background and become clearly visible in IR images.17 Each of these nails was also measured with a first order theodolite Leica TS30. The 3-D coordinates of all nails and the corresponding image coordinates, manually measured on all images are included in a bundle adjustment, whose solution includes also the Brown’s model calibration parameters. The average precision of this procedure can be evaluated through the estimated statistical quality parameters computed along with the bundle adjustment (see Sec. 2.3 for more details on bundle adjustment technique, which is also adopted in the image registration stage). In the case under consideration, the computed set of parameters allowed us to transform points from the images to the real word with an average residual error of . Fig. 2The wooden panel with the iron nails used for IR camera calibration as it is depicted in an RGB image (a) and in IR image (b), respectively. The distortion effects are quite large in the IR image.  Some other aspects of the calibration procedure need a special remark. First, in order to correctly estimate the calibration parameters, the points used for the bundle adjustment computation should be evenly distributed on the image, covering also those regions close to the image borders where distortions are usually larger. In addition, the inclusion in the calibration block of at least two rolled images (i.e., in portrait position, with the others in landscape orientation) can help to reduce correlations between the estimated parameters. Indeed, high correlation between a couple of parameters means that they have not been estimated in a reliable way. Consequently, one of these parameters should be excluded from the final set. In particular, in the presented case, the radial distortion parameters and showed a correlation . For this reason, in the final estimation, the parameter was excluded from the estimation and only seven parameters from the Brown’s model were used. As the autofocusing systems of the camera could not be turned off, the images were acquired more or less from the same distance from the polygon. However, the principal distance estimation in the case of real surveys still remains a problematic aspect. Finally, Fig. 3 highlights the difficulty of acquiring strongly convergent images due to the limited FoV of IR cameras compared with RGB ones. Fig. 3Visualization of camera stations for the calibration of an infrared thermography (IRT) camera (a) and for a standard RGB camera (b).  In this application, the camera calibration parameters were estimated after including in the bundle-adjustment some ground control point (GCP) obtained from theodolite surveying. However, the estimation can be carried out also in a “free-net adjustment” without any GCP.18 2.2.Reconstruction of the Building ModelA 3-D model of building is necessary for mapping thermal IR images. Such a model can be derived either starting from existing drawings or from surveying. In the case of large constructions or historical building where the façades can feature complex architectural elements, photogrammetric and TLS techniques may provide high-resolution models without requiring the direct contact with the object. Both techniques can also be successfully applied in an integrated way to exploit their complementary key properties. In Refs. 19 and 20, this topic is described in more detail. The most complete product that can be obtained from photogrammetry/laser scanning is a vector 3-D model. Unfortunately, this would require a largely time-consuming manual work, especially in the case of complex historical buildings where façades usually have an abundance of decorations. An alternative approach can be based on the use of point clouds which are directly achievable by means of TLS or alternatively can be derived from image matching techniques applied to photogrammetric images.21 A point cloud is a set of 3-D points describing the surface of an object. Points are not usually related by any topological relationship but, if their density is sufficiently high to sample the surface in a nonambiguous way, they give a useful model for mapping IR images. Usually, problems rise up in correspondence of edges, corners, and other features, where the spatial resolution of the point cloud is not enough to give a complete description of geometry. This is the motivation of why photogrammetry can increase the quality of point cloud because linear features like edges can be extracted in an easier way from images. Point clouds can be directly mapped by assigning to each point the radiometric value found in the corresponding positions in the images. On the other hand, this method is adequate only for rapid and general visualization and not to map details. Moreover, it suffers from low resolution of the point cloud. To overcome this drawback, raw point clouds derived from field surveying are further processed and a triangular mesh or triangular irregular network (TIN) describing the surface of the object is achieved. In the polygonal model, the raw points are connected with triangles which do not intersect or overlap.11 The triangularization process can be carried out in an automatic way, but usually it requires a final editing work. In Fig. 4, an example of a part of laser scanning point cloud at different stages of the modeling process is reproduced (raw point cloud, TIN surface obtained from automatic processing, TIN after editing). 2.3.Registration of Images and 3-D ModelIn the last phase, thermal images have to be mapped and mosaicked on the TIN model of the building. Given a calibrated camera as described in Sec. 2.1, this process is made up of two stages. The first one is the reconstruction of the spatial position of each image with respect to the 3-D model. This task is called image registration and will be described in this subsection. In a second step, the content of each image is projected over the 3-D model (texturing), as described in Sec. 2.4. Typically, the same geometric transformation adopted for registration is also adopted for texturing. In theory, registration and texturing of IR images do not differ from the same procedures for the case of RGB images. In practice, it is a much more complicated task to accomplish due to the smaller FoV, the smaller format, and the different radiometric content. In many applications that carried are out in standard thermal surveys of buildings, registration is carried out by using homographic transformations, one per each image to map.22 Estimation of homography requires the identification of at least four corresponding control points (CPs) on both image and surface. Not only does this method have strict limitations regarding the surface’s geometry that must be almost flat, but it can also be difficult to apply in the case where image depicts a homogeneous area where no CPs can be found. This situation quite frequently occurs in the case of IR images due to the small format and the homogeneous temperature over the region depicted in the image (Fig. 5). Fig. 5The basic principle of a single image texture mapping based on space resection: the method works only if the object and the thermal image allow the operator to manually measure a set of corresponding points.  A more comprehensive approach to image registration is based on the collinearity equations,13 which are normally used in photogrammetry to describe the spatial central perspective transformation approximating the process of image formation. Such equations relate a 3-D point in the object space to its corresponding projected point on the image (indexes and refer to point and image, respectively). Collinearity equations are parameterized through the so called exterior orientation (EO) parameters, which include three orientation angles used to build up a spatial rotation matrix , and 3-D coordinates of the perspective center of image : In Eqs. (1) and (2), image coordinates and have been previously corrected for distortion (see Sec. 2.1). Indeed, all cameras have to be calibrated before computing image registration although it would also be possible to do both registration and intrinsic calibration together; this last option, however, would require some strict conditions on the layout of the photogrammetric block, which usually differs from the one adopted during the surveying stage.23 Calibration also provides the principal distance and the coordinates of principal point , which are used in the collinearity equations [Eqs. (1) and (2)]. The registration of each image (space resection) can be directly performed by using these equations, whereas some GCPs should be independently measured (e.g., by using a theodolite or directly from the point cloud derived from TLS). Coordinates of GCPs have to be measured on the images as well. By using at least three GCPs, it is possible to write down a system of three pairs of Eqs. (1) and (2) for a total number of six equations. This system, after linearization, allows one to solve for the six EO parameters related to the image under consideration. In practice, the number of GCPs should be redundant to make it possible to work out the solution by least squares;24 this solution also helps to strengthen the numerical stability of the estimation. Another problem comes out from the linearization of Eqs. (1) and (2), which requires the knowledge of an approximate solution in advance for computing the Taylor expansion; this problem, although crucial in the whole process, is not adescribed here, but reader is referred to Ref. 13. An alternative approach which is usually adopted for space resection of thermal images is the projective model provided by direct linear transformation (DLT).25 In this case, the relationship between two-dimensional (2-D) and 3-D coordinates is modeled by means of 11 algebraic coefficients, which implicitly incorporate both calibration and EO parameters. By this method, each image is processed individually by measuring at least six GCPs; no approximations for the unknown parameter are necessary because DLT equations can be linearized in a straightforward manner. Sometimes, DLT is used to provide approximations for the successive application of the collinearity equations. Even if this space resection is the most popular technique for registration of IR images and it is implemented in several commercial packages, it suffers from at least three main drawbacks: (1) it is time consuming because each image has to be processed independently from others; (2) in the case of IR images with poor texture, the identification of the minimum number of GCPs may be difficult and the final orientation accuracy may be questionable; and (3) mosaicking of IR images on the 3-D model is prone to show discontinuities in overlapping areas. To overcome these drawbacks, usually in photogrammetry, the bundle adjustment approach is applied. Basically, several images are registered together into the same reference system through the solution of a linearized system of Eqs. (1) and (2). Also some approaches based on DLT exist, but are less popular. The unknowns of the system are the six EO parameters per each image, whereas the intrinsic calibration parameters are usually determined in an independent way. Some GCPs are used to setup the reference system where the registration is needed. In this case, GCPs have to be shared with the laser scanning point cloud. However, GCPs should not necessarily be measured on all images, mitigating the problem (2) in space resection methods. They have to be positioned to fix a general 3-D similarity transformation (seven parameters) that setup the reference system. This call for using at least three GCPs is not aligned. As a best practice, GCPs’ number should be larger and they should be spread out on the overall surveyed area. This has the advantage of either raising the numerical redundancy of solving system of equations or improving the stability of the solution. On the other hand, if the number of GCPs is reduced, the system would show a rank deficiency that needs to be filled by using the so called tie-points (TPs). TPs are corresponding points measured on at least two images, giving rise to at least four additional Eqs. (1) and (2). TPs do not need to be measured in the object space because their object coordinates are also computed during the adjustment. It is clear that every TP in two images introduces four equations and three new unknowns (the 3-D coordinate in the object space), resulting in a positive contribution to the global redundancy of the system. This contribution is much higher if a TP is seen in more than two images. Consequently, a good configuration for the bundle adjustment requires multiple TPs. This solution not only increases the global redundancy, but also improves the local redundancy of single observations, with a greater chance to detect errors. The block geometry should be properly selected as it would require large overlaps to find many multiple TPs, whose measurements can be carried out in a manual or automatic way.26 The second option is possible only if the images have an adequate texture. In addition, bundle adjustment also has the advantage of exploiting common GCPs between images, reducing the total number of points to be measured on the images. However, in many cases, the configuration of IR camera poses is quite different from the one of photogrammetric blocks made up of RGB images. This is strictly related to the characteristic of close-range IR sensors: the narrower FoV increases the number of images to be processed and reduces the baselines (i.e., the distance in space between the camera stations) between consecutive images, causing a worsening in the orientation accuracy. Moreover, in most cases the baselines are so short compared to the camera/object distance, that the numerical stability of the solving numerical system is dropped. For the sake of completeness, some specific acquisition systems designed to speed up the thermal image orientation can be also found in the literature. A “bi-camera” system, coupling a traditional RGB camera with an IR sensor, can be also used. In this case, only RGB images are processed in the bundle adjustment deriving their EO parameters. Then, from the knowledge of the relative orientation between RGB and IR cameras, which could be determined in a calibration phase, thermal images are oriented.14 However, the bi-camera system can be quite bulky and not always applicable. In the case of mobile mapping systems integrating IR cameras, the image orientation can be performed in a two-step way. Thermal images are first relatively oriented using Neister’s “five point algorithm.”27 Then, the obtained sequence is matched to the recorded GPS camera path and then to the building façade.28 The solution presented here is based on a global photogrammetric bundle adjustment combining both IR and RGB images, which tries to overcome some drawbacks connected to the standard space resection and to the bundle adjustment of IR images only. The procedure starts with the acquisition of an adequate set of RGB images with a calibrated camera, meaning that the image block should satisfy the standard requirements of a close-range survey in terms of image overlap, baseline between consecutive images, and image resolution.29 For instance, in the case of a planar-like façade, a simple strip of images with an overlap of about 80% can be a good choice as it allows one to find TPs on three to four images. In building surveys, some factors like occlusions caused by surroundings, buildings and/or trees, logistics limitation, and the like might influence the block design. Consequently, a trade-off between concurring requirements has to be defined. Then, RGB images are oriented within a standard photogrammetric bundle adjustment, which is based on a set of TPs measured on the images and some GCPs that are used to register the project in the reference system of the laser scans. An important consideration deserves to be mentioned: TPs individuated in this first step will then be adopted for registration of IR images. For this reason, their spatial distribution should be carefully planned. In particular, TPs should be preferably measured in correspondence of elements that are clearly visible in both RGB and IR images (e.g., windows’ and doors’ corners). This strategy may result in increasing the processing time of the bundle adjustment of the RGB images, if compared to a standard photogrammetric project where the integration of IR images is not needed. For example, in our application up to more than 100 TPs were individuated on a single RGB image. On the other hand, the larger number of TPs will help the registration of the IR data. Once RGB images have been registered by means of bundle adjustment, IR images can be added to the block by measuring those TPs which have been previously determined in the RGB images. A final combined bundle adjustment including all data is actually carried out to obtain the EO parameters of all images simultaneously. To account for the different precision of TPs measured in RGB and IR images in the computation of least squares solution, different kinds of observations are properly weighted. Basically, weights of image coordinates in the RGB images are derived from the statistics of bundle adjustment including the RGB images only. Weights of IR images are assigned on the basis of the pixel size of the adopted thermal camera. This combined adjustment has several advantages:
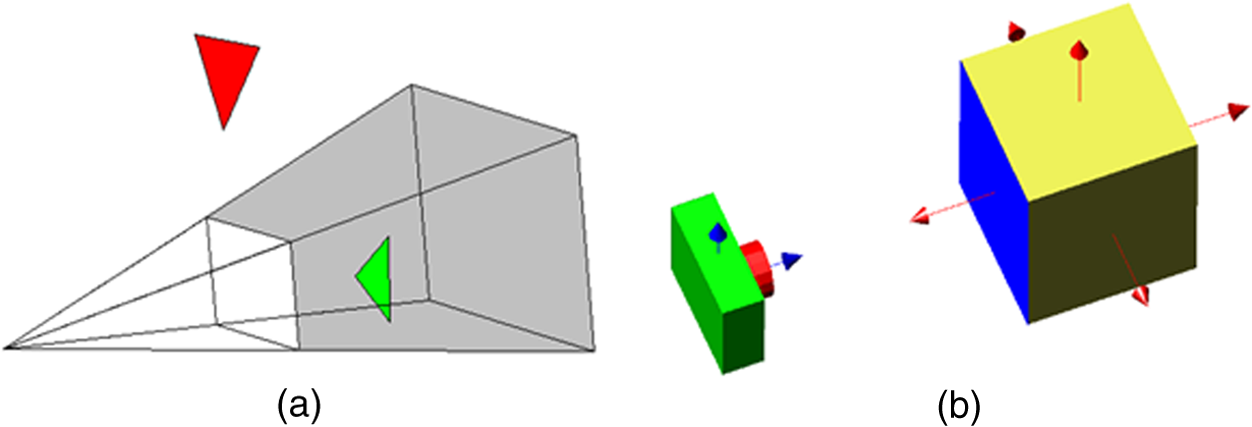
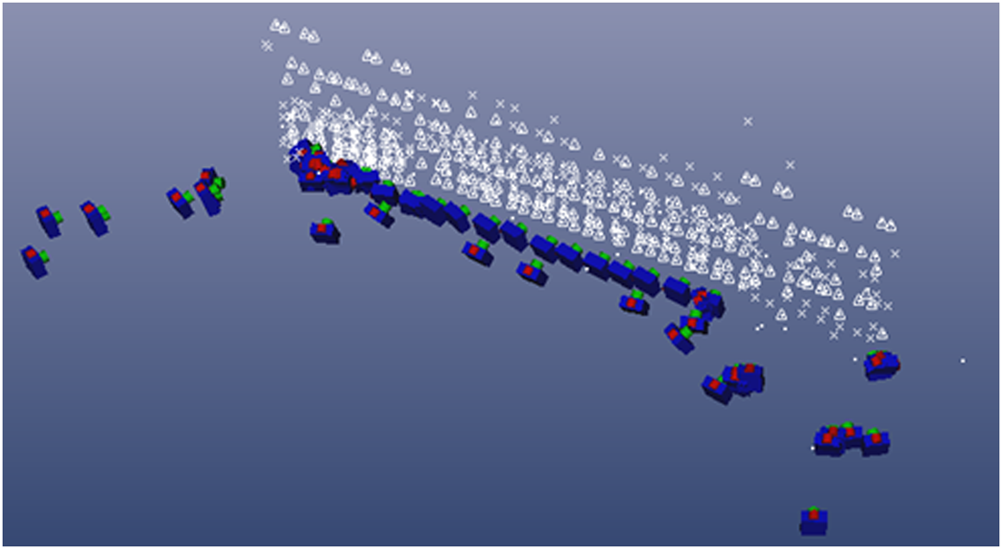
On the other hand, TPs have to be measured manually both in RGB and IR images and, in addition, they have to be measured in abundance in RGB images in order to cope with the limited FoV of IR camera. An application example of this orientation technique is the “Nave” building of Politecnico di Milano (Fig. 6). First, 17 RGB images acquired with a Nikon D80 with a 20 mm Sigma lens were registered within a bundle adjustment. In this project, 16 retro-reflective targets measured with a theodolite Leica TS30 and also employed for the registration of laser scans were used as GCPs during bundle adjustment. As can be seen in Fig. 7(b), the irregular distribution of both RGB (red cameras) and IR images (blue cameras) depends on the presence of several occlusions due to obstacles like other buildings and trees. Then, 65 IR images were included in the bundle adjustment by using more than 600 TPs previously measured in the RGB images. Thermal images were acquired with two different IRT cameras (AVIO TVS700 and NEC TH9260) and were included in a unique adjustment with different sets of intrinsic calibration parameters. The high number of TPs used is connected with the narrow FoV of both thermal cameras that limits the number of elements clearly measurable in each image (Fig. 7). Statistics of the combined bundle adjustment show a final RMS of about 1.2 pixels. This result can be considered as acceptable due to the low geometric resolution of IR images. In fact, the ground sample distance of the thermal images was about 1 cm, while the one of RGB images was 1 mm, meaning 1 order of magnitude of difference. An important remark concerns the identification of TPs on RGB and IR images. As previously mentioned, TPs identified in RGB images are abundant [Fig. 7(a)], resulting in a higher increment of the processing time of RGB images. However, TP localization is not a problem. On the other hand when IR images are used, the presence of repeated elements, such as windows or doors [Fig. 7(c)], may determine some ambiguities in the identification of TPs. For this reason, in the surveying phase some notes should be taken. This measurement is quite laborious and can last several hours and, in the case of large projects, even days. Fig. 7In the upper row (a) an RGB image with the measured tie points (TPs) (red crosses); and a 3-D view showing camera poses of both RGB (red) and thermal (blue) datasets (b). In the lower row (c), some IR images used for texturing the 3-D model with measured TPs; red lines are a graphical representation of the residuals after registration through the bundle adjustment (a magnification factor 50 is applied).  2.4.Texture Mapping of the IR ImagesOnce IR and RGB images are registered in the same reference system of laser scanning point cloud, they can be mapped and mosaicked on the model of the façade. The process aimed at applying artificial or reality-based textures to a 3-D model is known as texture mapping. In the former case, a predefined pattern is applied to each elementary surface which forms the digital surface model of the object. In the latter case, an image captured on the real object has to be mapped on the corresponding portion of the object model. Several works in the fields of photogrammetry, computer vision, and computer graphics focused on how to obtain the automatic photorealistic texture mapping from RGB images.30–33 In many cases, the general workflow is similar. As a preliminary stage, images and surface model (e.g., a 3-D TIN), which have been recorded independently, are registered in a common reference system. Then, the texture mapping process can be performed. As each portion of the façade is usually visible in more than one image, the second step is the implementation of an automatic criterion to select the image that is more suitable for mapping that area. This choice should take into account the image quality and the presence of occlusions. For instance, images used in the mapping phase are selected to maximize a score function or to optimize some geometric parameters such as viewing direction, level of detail, distance from the object, etc. Finally, the pointwise correspondences between pixels in the image and points on the elementary surface to be textured are established. In the application presented in this paper, the elementary surface is each triangle of the TIN generated from the laser scanner point cloud, and Eqs. (1) and (2) are used for mapping. Eventually, the obtained textures should be corrected for radiometric differences due to different lighting conditions. Some commercial software packages (e.g., 3-D Studio Max®, Geomagic® Studio, PhotoModeler® Scanner, ShapeTexture®, etc.) accomplish texture mapping. However, in many cases, the process is manual, meaning that the measurement of corresponding points () is carried out manually for each image. Also in the case that the image orientations can be uploaded in the software allowing a more automated processing, a significant editing phase is needed to fix problems related to occlusions, variations in lighting, and camera settings. On the other hand, when a small number of IR images or a simplified mesh model is used, these problems are less relevant. But when the number of IR images to adopt is large (also more than 50 to 100 images) and the façade model presents a high degree of complexity, a more efficient approach should be applied. The algorithm adopted here for texture mapping has been designed in order to minimize self occlusions and texture assignment problems.34 The procedure that identifies occluded areas is called visibility analysis. Figure 8 helps to understand the basic idea of this method: if triangle is not visible from the viewpoint , there will be at least another triangle which occludes it. In the image space, the occlusion is reflected by an intersection between the two back-projected triangles. In order to understand which is the occluded triangle and which is the occluding one, the reciprocal distance between the vertices of the triangles and the image projection center is calculated. The farther triangle is occluded, whereas the closer is the occluding one. Fig. 8The visibility analysis principle: (a) the two triangles do not occlude each other and no triangle intersection exists in the image space; (b) the green triangle occludes the magenta one (blue region intersection in the image space).  From a computational point of view, this phase is very demanding because the analysis should be repeated for all the triangles composing the whole mesh (computation complexity ). This might be a problem in the case of models composed of millions of triangles. To reduce the number of triangles to be checked, three different strategies have been implemented: (1) view frustum culling, (2) back-facing culling, and (3) triangle distance culling. The view frustum culling is based on labeling as occluded all triangles outside the camera view frustum [Fig. 9(a)] since they are not directly visible from viewpoint . The camera view frustum is the region of space where objects might have been imaged from a given camera station. In this case, it corresponds to the FoV of the adopted camera. The nearest and farthest planes limiting the camera view frustum are, respectively, the plane of the camera sensor and the plane at infinity. The classification of any triangle outside this region as “occluded” limits the number of visibility analyses to accomplish when dealing with triangles inside the view frustum. A further reduction of the number of triangles to check can be obtained using the back-facing culling [Fig. 9(b)]. If the mesh is oriented, the normal vector for each triangle is defined. All triangles whose normal forms an angle with the camera viewing direction are geometrically not visible from image viewpoint because they are occluded by the triangles facing toward the camera. In the case where the angle is smaller, it is labeled as potentially visible [blue face in Fig. 9(b)]. Depending on the dataset structure, the number of testing triangles can be significantly reduced. The triangle distance culling strategy (3) is based on the observation that in the visibility analysis, a lot of time is spent to analyze those triangles whose back projection in the image fall quite far from the reference triangle. On the other hand, triangles that back projected in the image are close to the reference one will have a higher probability of intersection. For this reason, we limit the intersection test only to a certain number of nearest neighbor triangles with respect to the reference one. Their number depends on the quality of the geometric model and on the image scale. The second important aspect that has been implemented in the procedure for texture mapping concerns the choice of the best image to be used for texturing in overlapping areas. This choice is performed evaluating two texture quality parameters: the resolution of the image in object space and the camera viewing direction. The image whose quality parameters are better ranked is used as the source for texturing. Finally, the texture coordinates for the triangle are calculated by back projecting the triangle coordinates in the object space onto the selected image by means of Eqs. (1) and (2). The described algorithm works independently for each triangle. Therefore, depending on the illumination conditions during acquisition, sharp color differences in the textured model may appear. This is expected especially when two different images are used to map adjacent triangles of the model. Nonhomogeneous texture can be reduced by using a color/brightness correction. The developed color/brightness correction is not performed in the traditional RGB space but in the color space.35 Indeed, unlike the RGB color model, color space is designed to approximate human vision. In particular, its component closely matches human perception of lightness, whereas and channels define the color plane. This distinction can thus be used to make accurate color balance corrections by modifying both and components and to adjust the lightness contrast using the component. The color and brightness corrections are estimated by exploiting common small areas detected in multiple images. The procedure for texture mapping IR images has been applied to the Nave building of Politecnico di Milano (see Fig. 6). The textured 3-D model was then rotated by using a viewing direction normal to the façade plane and both IR and RGB orthoimages (Fig. 10) were generated. Such products are useful for visual and analytical inspections. As can be seen, some holes, which are filled with RGB images, are present in the IR data orthoimage due to some obstacles which prevented the acquisition of IR images. 2.5.Comparison with Other MethodsIn this section, a comparative analysis between the method described in this section and other techniques which are normally adopted in the current practice (i.e., homography and space resection) is carried out. As previously discussed, in both homographic transformations and space resection methods, images are processed individually, requiring the identification of a high number of CPs between images and the building model. In contrast, in the method based on the combined bundle adjustment of RGB and IR images, several TPs are measured in the RGB images instead of the laser scans. In the case of homographic or space resection methods, CPs can be measured in two different ways: (1) from a theodolite survey, a process that may become highly time consuming due to the high number of points to survey or (2) by identifying some features in the laser scanning point cloud. In this second case, the quality of the point cloud and, in particular, its resolution play an important role in the accuracy of the registration. The comparative analysis is carried out considering a portion of the “Nave” building covered by 10 IR images. For this test site, IR images are registered by using all three discussed methods (bundle adjustment of RGB and IR images, homography, and space resection) and a final orthophoto is generated by adopting the same geometric model for the building. The comparison among the three different approaches is performed considering two different parameters:
In the case of homography and space resection methods, CPs used for image registration were directly derived from the laser scanning point cloud. Moreover, because these two approaches are based on the individual processing of each image, the average RMSE were evaluated on the whole set of 10 IR images analyzed. On the other hand, the simultaneous bundle adjustment of all IR images gives out a single statistic for the whole block orientation. As can be seen from Table 1, RMSE for bundle adjustment is in the order of 1 pixel as previously anticipated, while those corresponding to homography and space resection methods are significantly larger. This is mainly due to the fact that the identification of corresponding points between IR images and point cloud is limited by lower resolution of laser scanning data. On the other hand, the bundle adjustment is based on the measurements of TPs in RGB images instead of laser scans, resulting in an improved precision of point measurement and finally in a higher registration accuracy. Table 1RMS comparison for homography, space resection and combined bundle adjustment methods.
The second comparison is directly performed on the derived orthophotos. In this case, some check points which were clearly visible on both the RGB and thermal orthophotos were selected, and the error between IR and RGB data was evaluated. As can be seen from Table 2 and Fig. 11, discrepancies for homography and space resection are much larger than those obtained from the combined bundle adjustment method. Table 2RMS comparison for homography, space resection and combined bundle adjustment methods.
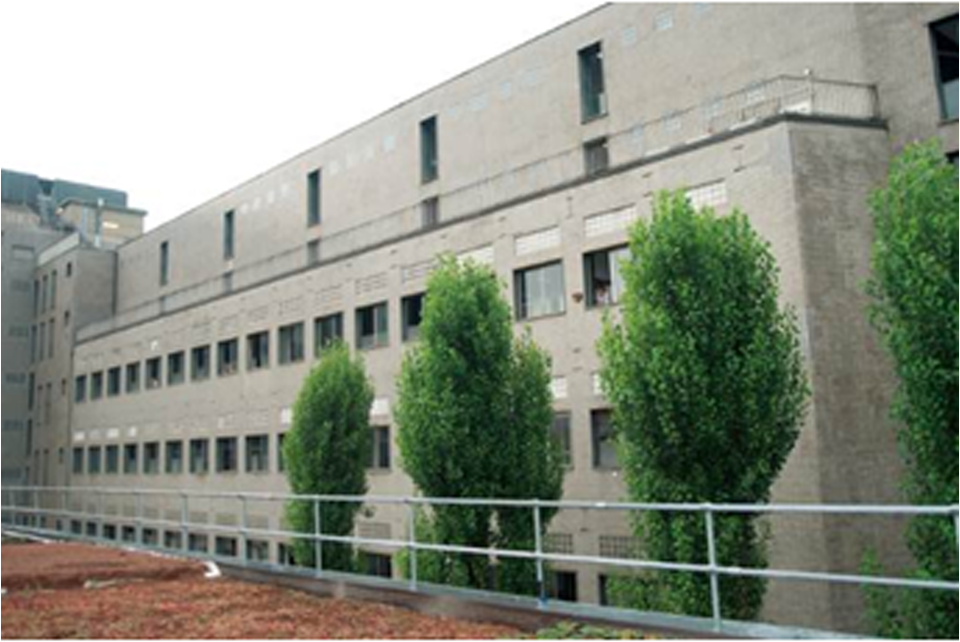
2.6.Application of the Whole ProcedureThe examples reported along the previous section demonstrated the results obtained by different steps. In this section, a complete case study is presented to show the entire process. The building is still located in the main campus of Politecnico di Milano University and it is a wing of the Padiglione Sud, which mainly hosts classrooms and offices (Fig. 12). In this case, the building was constructed in the 1920s and presented typical decorations and architectural features of that time. The aim of IRT investigation was the detection of thermal anomalies due to stucco delamination, thermal loss of the structure, and damages of the finishing. Fig. 12Photo (at top) and 3-D laser scanning model (at bottom) of Padiglione Sud building at Politecnico di Milano.  The laser scanning survey was based on several stations from which scans were acquired with a Riegl LMS-Z420i instrument to cover the whole façade. It should be noted that this long-range instrument undoubtedly was not the best solution for architectural surveys. Considering the short ranges involved (a few tens of meters), a more precise, faster and less noisy phase-shift scanner should be preferred for this application. On the other hand, from one side that was the only instrument available when needed. Second, the aim of survey was not to derive an accurate 3-D model of the building but only to construct a TIN surface for mapping IR images. In addition, a photogrammetric survey to collect RGB images was carried out with a camera Nikon D80. Also in this case, the scope of this survey was not the geometric modeling of the building36 but only to provide image for texturing the 3-D model and to be used for helping the registration of IR images. A set of retroreflective targets positioned on the façade were adopted to establish a local reference system for georeferencing the laser scans and also to be used as GCPs in the combined bundle adjustment of RGB/IR images. IR thermal images were registered by using the method presented in Sec. 2.3. Other solutions like the use of a “bi-camera system” as reported in Ref. 14 were tried. However, occlusions due to a railing close to the façade and many trees made this solution not feasible due to the bulky coupling equipment. On the other hand, the combined bundle adjustment method allowed the acquisition of IR images simply by placing the camera on a photographic tripod. Also a method based only on homography estimation resulted in improper images due to the presence of stucco and concrete decorations which altered the flat model needed for this registration model. The orientation was carried out by using the commercial photogrammetric software PhotoModeler®. This software allows for identification of GCPs and TPs in the images and does not require any approximation of the EO parameters for the bundle adjustment. First, 30 RGB images were oriented by using 20 retro reflective targets as GCPs and by identifying 150 TPs all over the façade. Then, about 90 IR images were oriented in a combined bundle adjustment with RGB images, offering a final average precision for image coordinates of (Fig. 13). The processing time for this phase was about four business days. In parallel, the laser scans were registered together and the TIN model was generated and edited. Finally, the 3-D digital textured model was obtained by using the procedure presented in Sec. 2.4 and then the final orthoimages (Fig. 14) with RGB and IR data derived by simply projecting the images onto the model of the façade. Also in this case, some gaps in the thermal map are clearly visible, mainly due to the presence of obstacles (vegetation, fence, …). The obtained model and the derived orthoimages were used to identify defects and delamination in the stucco using the procedure presented in Ref. 37. 3.ConclusionsAn innovative solution allowing the generation of 3-D digital models of complex structures textured by IR images was presented. The integration between different surveying techniques like photogrammetry, TLS, and IR thermography allowed an accurate mapping of IR thermal data on a detailed 3-D model, simplifying the detection of anomalies. The outputs of the procedure consisted of photo-textured 3-D models and orthoimages which gave support to the precise localization of thermal defects/anomalies and to the evaluation of their extension. These achievements could be exploited for the optimization of the conservation plan and for the maintenance activity planning. However, in order to obtain a satisfactory result both in image registration and in the final texturing phase, a calibration of the IR camera lens system by using a rigorous photogrammetric procedure is needed. Thermal image registration can be enhanced by introducing an adjustment in the images acquired by a RGB calibrated camera (with a better geometric resolution and a larger FoV than IR sensor). Data acquisitions of RGB and IR images are independent from each other. This is an important advantage because it allows us to select the best time for each survey. For example, RGB images should be captured with good natural lighting conditions, whereas IR data should be gathered at a time where thermal radiation of the façade is higher. The precision of image registration is in the order of and it is generally acceptable. On the other hand, some problems still exist, mainly in the acquisition of IR images. Due to the long time needed to perform a complete survey of a building façade, the environmental conditions might drastically change, resulting sometimes in significant variations of the surface temperature between different images. Even if an algorithm for color/brightness correction and radiometric difference reduction was developed, this could be used only in the generation of RGB mosaics. In fact, it is worthwhile to notice that radiometry in IR images is directly connected to temperature, and a simple correction based on color and brightness seems inadequate for IRT images. A more complex model based on heat diffusion and material property may be appropriate for temperature correction. Another problem concerns IR images depicting homogeneous areas, where the lack of radiometric texture can cause problems in identifying corresponding points among IR images and also with RGB images. The procedure for image registration, that is the core of the whole process presented here, is still largely time consuming owing to the manual measurement of TPs. This task can be accomplished in an automatic way when dealing with RGB images only.26 Unfortunately, it becomes much more involved in the case RGB and IR data that need to be integrated. Some authors38,39 have published procedures for automatic coregistration of RGB and IR images, which look promising but still work on a limited number of applications. AcknowledgmentsThis work was supported by “Progetto di ricerca di Ateneo Campus Sostenibile, Politecnico di Milano, AA 2010–2015.” ReferencesH. Wiggenhauser,
“Active IR-applications in civil engineering,”
Infrared Phys. Technol., 43
(3), 233
–238
(2002). http://dx.doi.org/10.1016/S1350-4495(02)00145-7 IPTEEY 1350-4495 Google Scholar
E. Villa-Alemanet al.,
“Aerial thermography studies of power plant heated lakes,”
Proc. SPIE, 4020 367
–373
(2000). http://dx.doi.org/10.1117/12.381571 PSISDG 0277-786X Google Scholar
A. TreptowG. CielniakT. Duckett,
“Active people recognition using thermal and grey images on a mobile security robot,”
in 2005 IEEE/RSJ Int. Conf. on Intelligent Robots and Systems, IROS,
3610
–3615
(2005). Google Scholar
W. T. Chiuet al.,
“Infrared thermography to mass-screen suspected SARS patients with fever,”
Asia Pacific J. Public Health, 17
(1), 26
–28
(2005). http://dx.doi.org/10.1177/101053950501700107 1010-5395 Google Scholar
C. HildebrandtC. RaschnerK. Ammer,
“An overview of recent application of medical infrared thermography in sports medicine in Austria,”
Sensors, 10
(5), 4700
–4715
(2010). http://dx.doi.org/10.3390/s100504700 SNSRES 0746-9462 Google Scholar
C. BalarasA. Argiriou,
“Infrared thermography for building diagnostics,”
Energy Build., 34
(2), 171
–183
(2002). http://dx.doi.org/10.1016/S0378-7788(01)00105-0 ENEBDR 0378-7788 Google Scholar
S. M. OcañaC. I. GuerreroI. G. Requena,
“Thermographic survey of two rural buildings in Spain,”
Energy Build., 36
(6), 515
–523
(2004). http://dx.doi.org/10.1016/j.enbuild.2003.12.012 ENEBDR 0378-7788 Google Scholar
S. RibarićD. MarčetićD. S. Vedrina,
“A knowledge-based system for the non-destructive diagnostics of façade isolation using the information fusion of visual and IR images,”
Expert Syst. Appl., 36
(2), 3812
–3823
(2009). http://dx.doi.org/10.1016/j.eswa.2008.02.043 ESAPEH 0957-4174 Google Scholar
X. Maldague, Nondestructive Testing Handbook: Infrared and Thermal Testing, 3rd ed.ASNT, Columbus, OH
(2001). Google Scholar
S. Lagüelaet al.,
“Calibration and verification of thermographic cameras for geometric measurements,”
Infrared Phys. Technol., 54
(2), 92
–99
(2011). http://dx.doi.org/10.1016/j.infrared.2011.01.002 IPTEEY 1350-4495 Google Scholar
E. EdisI. Flores-ColenJ. de Brito,
“Passive thermographic inspection of adhered ceramic claddings: limitations and conditioning factors,”
J. Perform. Constr. Facil., 1 258
–268
(2012). http://dx.doi.org/10.1061/(ASCE)CF.1943-5509.0000365 JPCFEV 0887-3828 Google Scholar
Airborne and Terrestrial Laser Scanning, 318 320 Whittles Publishing, Dunbeath, UK
(2010). Google Scholar
Topographic Laser Ranging and Scanning: Principles and Processing, 528 CRC Press, London, UK
(2008). Google Scholar
Close Range Photogrammetry: Principles, Techniques and Applications, 528 Whittles, Dunbeath, UK
(2007). Google Scholar
M. Albaet al.,
“Mapping infrared data on terrestrial laser scanning 3D models of buildings,”
Remote Sens., 3
(12), 1847
–1870
(2011). http://dx.doi.org/10.3390/rs3091847 2072-4292 Google Scholar
T. Luhmannet al.,
“Geometric calibration of thermographic cameras,”
International Archives of Photogrammetry, Remote Sensing and Spatial Information Sciences, 411
–416 Newcastle upon Tyne, UK(2010). Google Scholar
D. Brown,
“Close-range camera calibration,”
Photogramm. Eng. Remote Sens., 37
(8), 855
–866
(1971). PGMEA9 0099-1112 Google Scholar
M. GianinettoF. RoncoroniM. Scaioni,
“Calibration of close-range thermal imagery for integration into 3D VR models,”
in Proc. of Work. Italy-Canada 2005 “3D Digital Imaging and Modeling: Applications of Heritage, Industry, Medicine and Land,
(2005). Google Scholar
S. I. Granshaw,
“Bundle adjustment methods in engineering photogrammetry,”
Photogramm. Rec., 10
(56), 181
–207
(1980). http://dx.doi.org/10.1111/(ISSN)1477-9730 PGREAY 0031-868X Google Scholar
C. Brenner,
“Building reconstruction from images and laser scanning,”
Int. J. Appl. Earth Obs. Geoinf., 6
(3), 187
–198
(2005). http://dx.doi.org/10.1016/j.jag.2004.10.006 0303-2434 Google Scholar
P. Rönnholmet al.,
“Integration of laser scanning and photogrammetry,”
in International Archives of Photogrammetry, Remote Sensing and Spatial Information Sciences,
355
–362
(2007). Google Scholar
L. Barazzettiet al.,
“Photogrammetric survey of complex geometries with low-cost software: application to the “G1” temple in Myson, Vietnam,”
J. Cultural Heritage, 12
(3), 253
–262
(2011). http://dx.doi.org/10.1016/j.culher.2010.12.004 1296-2074 Google Scholar
H. González-Jorgeet al.,
“Single image rectification of thermal images for geometric studies in façade inspections,”
Infrared Phys. Technol., 55
(5), 421
–426
(2012). http://dx.doi.org/10.1016/j.infrared.2012.05.003 IPTEEY 1350-4495 Google Scholar
C. S. Fraser,
“Automatic camera calibration in close range photogrammetry,”
Photogramm. Eng. Remote Sens., 79
(4), 381
–388
(2013). PGMEA9 0099-1112 Google Scholar
P. J. G. Teunissen, Adjustment Theory. An Introduction, Series on Mathematical Geodesy and Positioning, 193 VSSD Delft, The Netherlands
(2009). Google Scholar
“Direct linear transformation from comparator coordinates into object-space coordinates,”
in Close-range Photogrammetry,
1
–18
(1971). Google Scholar
L. BarazzettiF. RemondinoM. Scaioni,
“Orientation and 3D modelling from markerless terrestrial images: combining accuracy with automation,”
Photogramm. Rec., 25
(132), 356
–381
(2010). http://dx.doi.org/10.1111/phor.2010.25.issue-132 PGREAY 0031-868X Google Scholar
D. Nistèr,
“An efficient solution to the five-point relative pose problem,”
IEEE Trans. Pattern Anal. Mach. Intell., 26
(6), 756
–777
(2004). http://dx.doi.org/10.1109/TPAMI.2004.17 ITPIDJ 0162-8828 Google Scholar
L. HoegnerU. Stilla,
“Thermal leakage detection on building facades using infrared textures generated by mobile mapping,”
in Urban Remote Sensing Event, 2009,
1
–6
(2009). Google Scholar
C. S. Fraser,
“Network design considerations for non-topographic photogrammetry,”
Photogramm. Eng. Remote Sens., 50
(8), 1115
–1126
(1983). PGMEA9 0099-1112 Google Scholar
Multiple Texture Stitching and Blending on 3D Objects, Eurographics Rendering Workshop, Granada, Spain
(1999). Google Scholar
V. LempitskyD. Ivanov,
“Seamless mosaicing of image-based texture maps,”
in IEEE Conf. Computer Vision and Pattern Recognition,
1
–6
(2007). Google Scholar
M. CallieriP. CignoniR. Scopigno,
“Reconstructing textured meshes from multiple range RGB maps,”
in 7th Int. Fall Workshop on Vision, Modeling and Visualization 2002 Citeseer,
419
–426
(2002). Google Scholar
D. Abateet al.,
“Remote rendering and visualization of large textured 3D models,”
in Proc. 18th IEEE Int. Conf. Virtual Systems and MultiMedia (VSMM),
399
–404
(2012). Google Scholar
M. PrevitaliL. BarazzettiM. Scaioni,
“An automated and accurate procedure for texture mapping from images,”
in Proc. 18th IEEE Int. Conf. Virtual Systems and MultiMedia (VSMM),
591
–594
(2012). Google Scholar
K. McLaren,
“XIII—The Development of the CIE 1976 Uniform Colour Space and Colour-difference Formula,”
J. Soc. Dyers Colourists, 92
(9), 338
–341
(1976). http://dx.doi.org/10.1111/j.1478-4408.1976.tb03301.x JSDCAA 0037-9859 Google Scholar
N. HaalaM. Kada,
“An update on automatic 3D building reconstruction,”
ISPRS J. Photogramm. Remote Sens., 65
(6), 570
–580
(2010). http://dx.doi.org/10.1016/j.isprsjprs.2010.09.006 IRSEE9 0924-2716 Google Scholar
M. Previtaliet al.,
“Generation of a GIS-based environment for infrared thermography analysis of buildings,”
Proc. SPIE, 8511 85110U
(2012). http://dx.doi.org/10.1117/12.930050 PSISDG 0277-786X Google Scholar
S. Lagüelaet al.,
“Automation of thermographic 3D modelling through image fusion and image matching techniques,”
Autom. Constr., 27
(0), 24
–31
(2012). http://dx.doi.org/10.1016/j.autcon.2012.05.011 AUCOES 0926-5805 Google Scholar
S. Lagüelaet al.,
“Automatic procedure for the registration of thermographic images with point clouds,”
Int. Arch. Photogramm. Remote Sens. Spatial Inf. Sci., 34
(B5), 211
–216
(2012). Google Scholar
Biography Mattia Previtali received a bachelor’s degree in September 2008 and a master’s degree in civil engineering in December 2010 at Politecnico di Milano, Italy. Currently he is a PhD student in geomatics and infrastructures at Politecnico di Milano since January 2011. Since 2011 his research activities have taken place at the IC&T Laboratory at the Politecnico di Milano. His research fields are image matching, close-range photogrammetry, and terrestrial laser scanning.  Luigi Barazzetti received a bachelor’s degree in civil engineering in July 2004 and a master’s degree in civil engineering (surveying and monitoring) in December 2006. In February 2011 he received a PhD cum laude in geomatics and infrastructures at Politecnico di Milano. Since 2008 he has been directly concerned with the work of the IC&T Laboratory at the Politecnico di Milano. His research activities are based around matching, registration and adjustment of satellite, aerial and close-range images. He has had numerous papers published (more than 80) on both national and international levels. He has held, or taken an active part in, more than 30 conferences on the topic of photogrammetry and laser scanning.  Veronica Redaelli received a degree in physics (University of Milan 2001) with a thesis on the application of thermographic technique in the cultural heritage. In 2003 she obtained the qualification of thermographic second level technical according to UNI EN 473. PhD in animal production (University of Milan 2010) with thesis on the application of thermography in veterinary science. She currently lectures in training courses, seminars and conferences in the field of thermography in cultural heritage and animal science.  Marco Scaioni graduated and achieved a PhD in geodetic and mapping sciences at Politecnico di Milano, Italy. Currently he is professor at Tongji University, College of Surveying and Geo-Informatics, Shanghai (China) since December 2011. He is affiliated with the Center for Spatial Information Science and Sustainable Development Applications. His research fields are mainly close-range photogrammetry, terrestrial laser scanning, satellite and terrestrial remote sensing, geo-hazards and polar research. His major current projects are focusing on spatial sensor networks for landslide monitoring/forecasting and application of remote-sensing data to evaluate ice mass-balance in Antarctica. He is chairman of the ISPRS Working Group V/3 on terrestrial laser scanning in 2012 to 2016. He is member of the editorial board of Applied Geomatics (Springer) and the European Journal of Remote Sensing.  Elisabetta Rosina is a researcher and professor on cultural heritage conservation and preservation technologies on historic buildings and valorization of built environment at the Politecnico di Milano, ABC Department. She is working in the field of design, planning and execution of nondestructive investigations and degradation surveys on buildings, for preservation and maintenance since 1991. Her major research activities are focusing on preservation technologies, specifically for historic buildings, performances and degradation of building materials, diagnostic methodologies and techniques such as infrared thermography, gravimetric tests, microclimatic monitoring, psycrometric maps, videoscope, iron/steel structures search inside masonry and instrumental surveys. |