|
|
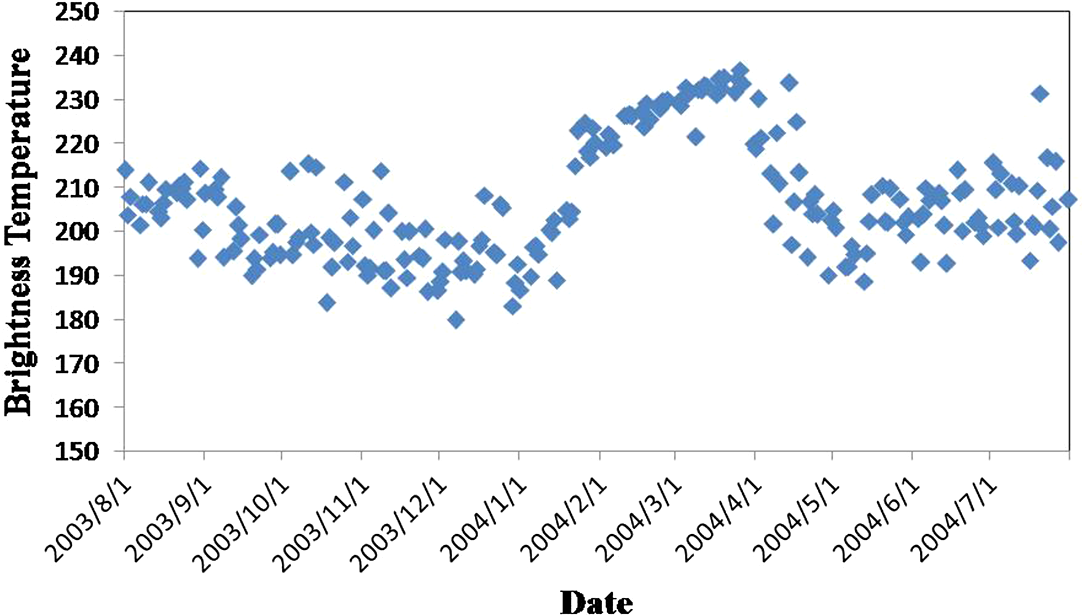
1.IntroductionThe influence of climatic change on the geophysical system is manifested primarily by a significant increase in glacial melt runoff and a significant decrease in lake ice cover.1,2 As the world’s third pole,3 the Tibetan Plateau bears the largest ice reserve outside of the two poles,4 and its response to global climate change is more sensitive than that of other parts of China.5 The lake surface area in the Tibetan Plateau accounts for more than half of the total in China.6 This large number of lakes with huge areas not only sensitively responds to climate change but also plays an important role in the climate change.7 They influence the climate by changing the underlying surface conditions due to the changes of lake area or physical status.8 Because these lakes are located in the high-altitude Tibetan Plateau with its cold climate, they are less disturbed by human activities. Therefore, their variations and changes essentially reflect the effects of natural environmental changes due to the climate changes.9 The Nam Co Basin holds a large number of modern glaciers and is the second largest saltwater lake in the Tibetan Plateau. It is, therefore, an ideal site to study the natural responses to climate change.10 A more thorough perspective of local climate change was obtained by Wu and Zhu through averaging data from the nearest meteorological stations.11 They found an increase of both temperature and precipitation in the period from 1971 to 2000. An obvious contribution to the lake rise connected to the rise of the temperature is an increased inflow of glacier melt water. Bolch et al.12 and Kang et al.13 reported dramatic glacier retreat of in the Nyainquentanghla range in the last 30 years. Consequently, the response of lake area and water level in Nam Co Lake and basin to global climate change has been an important research topic for scholars in China and abroad.14–16 Due to the seasonality of lake ice, temperature variation can explicitly impact the freezing and ablation time of the lake ice. Therefore, the lake ice condition and the freezing and ablation times are good indicators of climate change.17,18 Lake ice can reflect climate change at both large and small scales; meanwhile, the freezing and ablation speed, maximum thickness, and ice temperature gradient of lake ice are also important indicators of regional climate change.19,20 Relevant parameters of lake ice can be obtained through field observations or meteorological and hydrological records, but field observations are time-consuming and labor-intensive, especially in large, sparsely populated areas with numerous lakes. Meanwhile, weather stations and hydrological stations in the Tibetan Plateau are very sparse and are not evenly distributed. It is difficult, if not impossible, to obtain lake ice records that cover a large area. Traditional ground-based stations are usually located on the shore, and they can only document the freezing and ablation of the lake surface within view of the recording stations due to sight limitation. For large lakes, the recording of ground observations cannot accurately reflect the freezing and ablation time of the entire lake. Remote sensing provides a convenient and prompt approach to monitor lake ice. It can acquire high-temporal resolution imagery over a large scale, which compensates for the shortcoming of the uneven distribution of manual observation stations, weather stations, and hydrological stations and provides a powerful tool for lake ice monitoring. Latifovic and Pouliot20 employed advanced very-high-resolution radiometer data to monitor lake ice according to the variation curve of lake reflectivity. Moderate resolution image spectroradiometer (MODIS) data were also applied to calculate the freezing and ablation times of lake ice according to the curve of surface temperature variation.21 Despite the important role of high-resolution optical remote sensing data in the monitoring of variation of lake ice phenology, it is vulnerable to the impact of clouds, and thus its application is subject to certain restrictions. Microwave remote sensing data have the all-weather and all-time advantages and are widely applied to lake ice monitoring. Howell et al.22 applied the variation in the backscattering coefficients of microwave data to monitor lake ice variation in Great Bear Lake and Great Slave Lake. Che et al.23 applied passive microwave remote sensing data spanning nearly 30 years to analyze the lake ice variation in Qinghai Lake of China, but no scholars have yet studied the long time series of lake ice variation in Nam Co Lake. In this paper, we used passive microwave data from the scanning multichannel microwave radiometer (SMMR) and special sensor microwave/imager (SSM/I) to obtain the freeze-up (FU) and break-up (BU) times of Nam Co Lake ice from 1978 to 2013. Advanced microwave scanning radiometer for Earth observation system (AMSR-E) and MODIS data were used to validate the results and examine the variation trends as well as the influence of temperature on the variation in the FU and BU time of lake ice. 2.Study Area DescriptionNam Co, the second largest salt lake in China, is located in the central part of the Tibetan Plateau (30°N, 90°E), with a location of 90°16’ to 91°03’E and 30°30’ to 30°55’N (Fig. 1). It belongs to the Qiangtang Plateau in the northern Tibetan Plateau.8 The area of Nam Co is 1920 square kilometers, with an altitude above average sea level (a.s.l).24 Climatologically, the Nam Co Basin belongs to the semiarid zone with cold and dry winter and humid summer. The area is at the margin of influence of the Indian monsoon with a mean annual precipitation of 414 mm (Nam Co Station), mostly in the period from June to September.8 The major tributaries coming from hilly areas enter the lake from the West and from the East. The southern tributaries originate from Nyainqêntanglha Mountains, which is a highly glaciated range that reaches 7162 m a.s.l. The maximum depth of the lake is .25 The large water volume prevents the lake from freezing before the end of January. It usually becomes completely ice-free in June.26 3.Data and Methods3.1.Data3.1.1.SMMR and SSM/IThe SMMR and SSM/I sensors are part of the Pathfinder Program of the United States National Aeronautics and Space Administration. The SMMR began collecting data on October 26, 1978, and ended on August 20, 1987. It observed at five frequencies of 6.6, 10.7, 18, 21, and 37 GHz, each with two polarizations, horizontal and vertical. The spatial resolution varies significantly with frequency. The resolution at 6.6 GHz is 148 km, and the highest resolution (27 km) is at 37 GHz. The SSM/I began to operate on July 9, 1987, and is still in operation. It observes at four frequencies of 19.35, 22.2, 37, and 85.5 GHz, with two polarizations, except for 22.2 GHz with only the vertical polarization. The spatial resolution is 12.5 km at 85.5 GHz and 25 km for the other three frequencies. The study in this paper primarily uses 37 GHz of SMMR and 19 and 37 GHz of SSM/I. We did not use the frequency of 85.5 GHz since it is affected by weather.23 Because Nam Co Lake is located in a mid-latitude area, there are data-free regions between adjacent orbits of the satellite. The data sampling period of SMMR was 2 days, which resulted in the data-free time of 2 or 4 days, possibly 6 to 8 days due to the occasional influence of missing pixels. The data sampling period of SSM/I was 1 day, which resulted in the data-free time of 1 to 3 days, with occasionally 3 to 5 days due to missing pixels. What is more, SSM/I data are missing from December 3, 1987, to January 12, 1988. Because the freezing time of Nam Co Lake is usually in January or February, there could be one chance to miss the freezing onset date for the winter season from late 1987 and early 1988. Although Che et al.23 proposed that the combination of data from the ascending and descending orbit can reduce the impact of data-free days, the effect is not obvious, most likely due to the different latitude of Nam Co Lake. Additionally, although low-frequency brightness temperature data are less affected by weather conditions, the brightness temperature of the same pixel could be different due to different imaging times of ascending and descending orbits of the same day. This decreases the feasibility of applying ascending and descending orbit data to reduce the influence of data-free days. We used the vector boundary of Nam Co Lake from a global database of lakes27 to extract the lake brightness temperature from the passive microwave images. Although the area of Nam Co Lake changed during 1978 to 2012,8 its variation is negligible with respect to the 25-km resolution of the image. To avoid the impact of mixed pixels, we extracted only the relatively pure pixel at the center of the lake for the analysis (relatively pure pixel means that land is ). The freezing of the lake surface begins along the shore and extends toward the center. For Nam Co Lake, with its relatively regular rectangular shape, we can assume that the entire lake surface is frozen if the center of the lake is frozen. In this paper, we assign one cycle from August 1 of each year to July 31 of the following year. 3.1.2.AMSR-EThe AMSR-E was launched by the United States in 2002 aboard the Aqua satellite, and it collects data through 12 channels at six frequency bands. The spatial resolution differs significantly with the various frequencies. The spatial resolution at 37 GHz is , whereas the highest resolution can be up to 6.25 km at 89 GHz. The data sampling interval is 1 day, and usually there is data missing for one day after a continuous observation of 4 days. By combining the data from the ascending and descending orbits, we can completely eliminate the impact of missing data. The AMSR-E brightness temperature data with higher spatial resolution from 2002 to 2011 were selected to validate the ice phenology of Nam Co Lake acquired based on SSM/I data. 3.1.3.MODISThe MODIS is a sensor onboard satellites Terra (launched in 1999) and Aqua (launched in 2002). As the new generation of optical remote sensing instrument with image and spectrum integrated, it can acquire global observation data every day. Within the electromagnetic range from 0.4 to 14 μm, it contains 36 discrete narrow-spectral bands with spatial resolutions of 250, 500, or 1000 m.28 MODIS has multiple products, and generally L1B products or reflectance products are selected for validation. In this study, we use the MOD09GA product for dates in 2003 with a 500-m resolution and less cloud cover (the data in other years were covered by cloud, which are not suitable for validation). We further validated the ice phenology of Nam Co Lake acquired based on SSM/I data through visual interpretation of the MODIS imagery because it is the most direct and accurate way to judge the ice existence. 3.2.MethodsFigure 2 is an example showing the brightness temperature of one full year. There is a significant difference in the brightness temperatures of ice and water, with the brightness temperature of ice clearly higher than that of water (high platform value or high value domain). This is consistent with what was found in Che’s study.23 Kouraev et al.17,29 applied the polarization ratio and frequency gradient to calculate the ablation time of lake ice. Che et al.23 directly applied the difference in brightness temperature to calculate the freezing and ablation times of lake ice, and also added the criterion of a brightness temperature on the descending orbit or on the ascending orbit to obtain more accurate results. In this paper, however, we did not apply this 200- and 240-K criterion because the difference between data from the ascending orbit versus the descending orbit is not obvious in the same polarization mode, and noise with considerable fluctuations cannot be effectively distinguished. Instead, we applied the method of brightness temperature difference search to determine the freezing and ablation times of lake ice, using the following formulas: where and are the computations of maximum and minimum, respectively, is the computation of average, and is the brightness temperature on the ’th Julian day. To accurately extract the freezing and ablation dates of the lake ice, we can apply the method of combining the equations above. It means that we can conduct a search and verify whether the result on the curve is accurate or not.Fig. 2Brightness temperature variation of Nam Co Lake (high platform value indicates the freeze-up period of the lake).  In addition, the results calculated by the method of searching for the maximum and minimum may not be the real position of freezing and ablation because the maximum or minimum does not appear at the location where freezing begins or ablation ends due to the impact of noise. Therefore, a method is proposed to amplify the difference between the data from the frozen and nonfrozen periods, which can also further reduce the influence of noise. It acts as an auxiliary method to verify the correctness of the results calculated by Eqs. (1) and (2). The formula is as follows: where is the brightness temperature of the ’th day at a certain frequency, is the median annual brightness temperature at this frequency, and is the maximum annual brightness temperature at this frequency. Similarly, we used the brightness temperature data for Nan Co Lake during 2005 to 2006 as an example to clearly identify the FU period of the lake (Fig. 3).3.3.Error AnalysisDue to the impact of the aforementioned sampling period and missing data, without considering the computational error, the error of the final computation results in the worst case can be up to 8 days (for SMMR) or 5 days (for SSM/I). This error postpones the calculated freezing time and advances the ablation time. The reason is that the freezing and ablation times of lake ice are derived by calculating the starting and ending locations of high platform values. Due to the presence of missing data, if data happen to be missing before the starting location or after the ending location of the calculated high platform values, it is impossible to determine whether the computation result is the exact time for the starting and ending of high platform values. For example, if the freezing date we calculated from SMMR is January 23, then the previous data available might be January 17 and the next one after 23rd might be January 29. However, if the freezing date we calculated from SSM/I is January 23, the previous data available might be January 20 and the following one might be January 25. Therefore, the error in the freezing and ablation times of lake ice calculated from SMMR data is larger than that for SSM/I because of the low data sampling period of SMMR, and there is no feasible method to reduce this type of error. In this paper, it is approximated that the freezing condition of a pure pixel in the central part of the lake can reflect the ice phenology of the entire lake. However, in the course of validation with optical images, it was found that the region of last freezing and first ablation in Nam Co Lake is to the west of the lake center, while the region of first freezing and last ablation is to the east of the central pixel. There is land in the east and west sides of the center pixel, and these mixed pixels might cause certain errors. Therefore, we used only the central pixel for the calculation, so that the eventually calculated freezing time is always earlier than the actual date of complete lake-wide freezing and the calculated ablation time is later than the actual start date. Moreover, due to the characteristics of the data and the actual freezing process, the jumping phenomenon of high platform values on the brightness temperature curve is not obvious for some years. When the lake surface freezes, it shifts from a low value to the high platform value along a steep slope; it later slowly changes back to the low value upon ice ablation (Fig. 4). The results obtained through the method of searching for the maximum and minimum are most likely not located at the initial position of high platform values, and the correction through visual interpretation cannot accurately pinpoint the initial location of high platform values. Generally speaking, the transition from low values to the high platform values means that the lake surface starts to freeze, and the lake surface is completely frozen when it reaches the high platform values; the transition from the high platform values to low values means the lake surface starts to thaw, and it is completely thawed when it returns to low values. In this situation, the results obtained through the difference amplification method in this paper reflect the time when the lake surface begins to freeze and when it is completely thawed. The kind of error due to computational methods is slightly different according to the data quality. There is a certain randomness causing the error to be larger or smaller, but it is generally not more than 3 days. This is because if the error is more than 3 days, it will be obvious during visual interpretation and thus the results can be corrected. 4.Results and Discussion4.1.Variability in Ice PhenologyBased on the SMMR and SSM/I passive microwave brightness temperature data from 1978 to 2013, we derived the variation of ice phenology in Nam Co Lake. The results indicate that the frozen period of Nam Co generally begins in January or February and ends in April or May every year; the average ice duration is [Figs. 5(a) and 5(b)]. The average freezing time is January 21. The earliest freezing time was January 4 in 1985 and 1996; the latest was February 8 in 1999, and the freezing times in 1990, 2009, and 2010 were also in February. The earliest ablation time was April 5 in 2010, and the latest was June 2 in 1986, with a difference of nearly two months. There are 16 years in which the ablation time was later than May, including seven years when the ablation time was later than May 10; six of those years were prior to 1990, and the last one was 1997. The longest duration of lake ice was 130 days, which occurred in 1986, and the shortest duration was 59 days, which occurred in 2010. Since 2000, there have been only three years when the duration of lake ice was . Between 1978 and 2000, there were only six years when the duration time of lake ice was . In the past 35 years, the freezing time of Nam Co Lake has become later by approximately 9 days on average, whereas the ablation time was advanced by approximately 9 to 10 days. The duration of lake ice has decreased by to 20 days. One point that should be noted here is, from 1978 to 2000, the average freezing time was January 19, the average ablation time was April 22, and the average duration time was 102 days. For 2000 to 2013 period, however, the average freezing time was January 23, the average ablation time was April 14, and the average duration time was 90 days. Fig. 5Variability in ice phenology on Nam Co Lake from 1978 to 2013. (a) Freezing up (FU) and breaking up (BU) timing. (b) Lake ice duration. 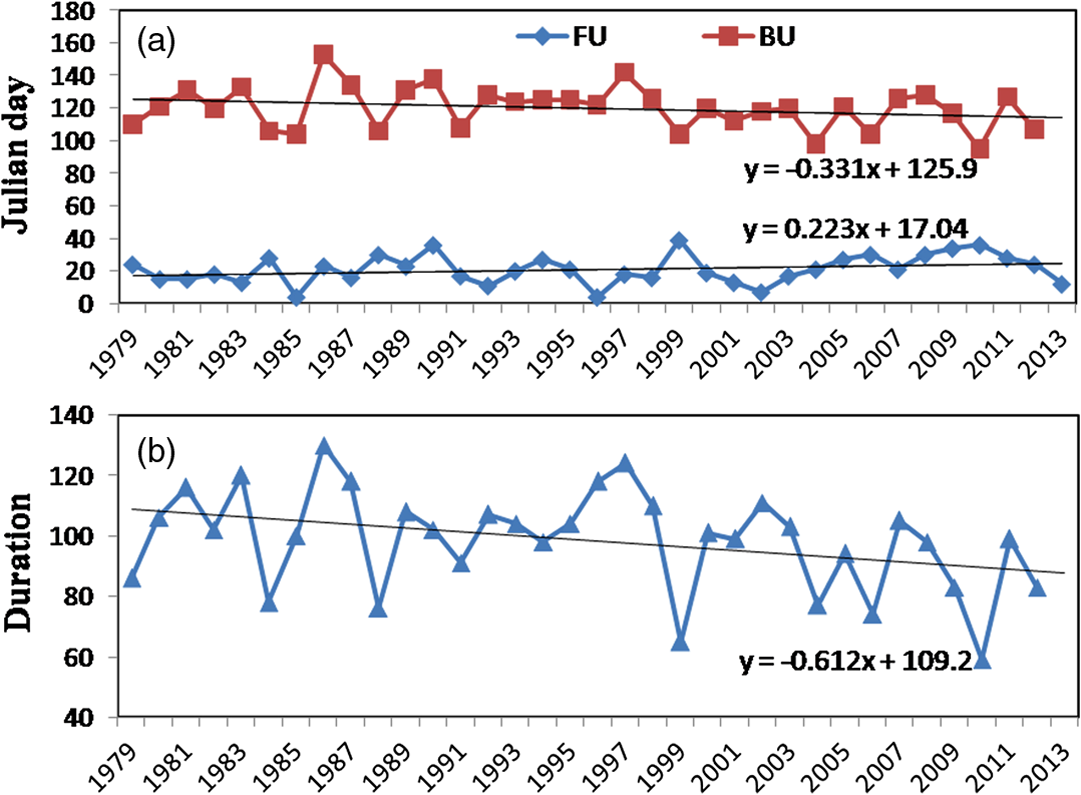 Kropáček et al.16 used MODIS 8-day composite data for 2001 to 2010 to analyze the lake ice phenology of the Tibetan Plateau and found that the average freezing time of Nam Co is February 13 and the average ablation time is April 4. Our analysis indicates that the average freezing time for 2001 to 2010 is January 23 and the average ablation time is April 13. The possible reason for this deviation could be that Kropáček applied MODIS 8-day composite data, so the result cannot be accurate to a single day; instead, it can only be the start date plus an integer multiple of 8. In addition, optical imagery is vulnerable to clouds, so the error is at least 8 days, or even 16 days if there are clouds on all 8 days. Another possible reason could be that the resolution of MODIS is much higher than that of the 25-km resolution of passive microwave imagery, and the coarse resolution can only identify the overall ice phenology of the lake surface. By contrast, MODIS can distinguish fine ice situations in small ranges; for example, the passive microwave data can only use the central pixel to represent the entire lake, whereas MODIS image can observe the entire lake. Che et al.23 applied passive microwave remote sensing data to monitor the lake ice in Qinghai Lake, which is also located in the Tibetan Plateau. Their results are essentially consistent with the trend of variation in the freezing, ablation, and duration times of Nam Co lake ice in this study. The longest duration of lake ice in Qinghai Lake appeared in 1986, and there was a trough in freezing time in 1997, which is most likely due to the same climatic background as Nam Co Lake. 4.2.ValidationAs shown in Table 1, the results from AMSR-E and SSM/I are very close. The maximum difference in freezing time between the two datasets is 3 days in 2004; the maximum difference in ablation time is 4 days in 2009. This indicates that it is feasible to apply this method to calculate the freezing and ablation times of lake ice based on SSM/I data. Table 1Comparison of freezing, ablation, and duration times of lake ice based on special sensor microwave/imager (SSM/I) and advanced microwave scanning radiometer for Earth observation system (AMSR-E) data (2003 to 2011).
Note: FU is the time of freeze-up, BU is the time of break-up, and Dur is the ice duration. The computation results for SSM/I indicate that the freezing time in 2003 was January 17 and the ablation time was April 30. As shown by the high-resolution MODIS imagery (Fig. 6), Nam Co Lake fully entered the FU period on January 20, which is 3 days’ difference from the computation result based on SSM/I data. It is inferred from the image of snow-covered mountains (Fig. 7) during thawing to the south of Nam Co Lake that, except for April 27, all three other images were affected by clouds (the image on April 29 was not used because the cloud coverage area on this day is relatively large). However, we can see that the lake ice was not completely melted on April 28, while it was completely melted on May 1. Therefore, the error is 1 day at most. Fig. 6Moderate resolution image spectroradiometer (MODIS) image of lake ice freezing on Nam Co Lake in 2003 (combination of bands 5, 4, and 3 of MOD09GA data).  Fig. 7MODIS image of lake ice ablation of Nam Co Lake in 2003 (combination of bands 5, 4, and 3 of MOD09GA data). 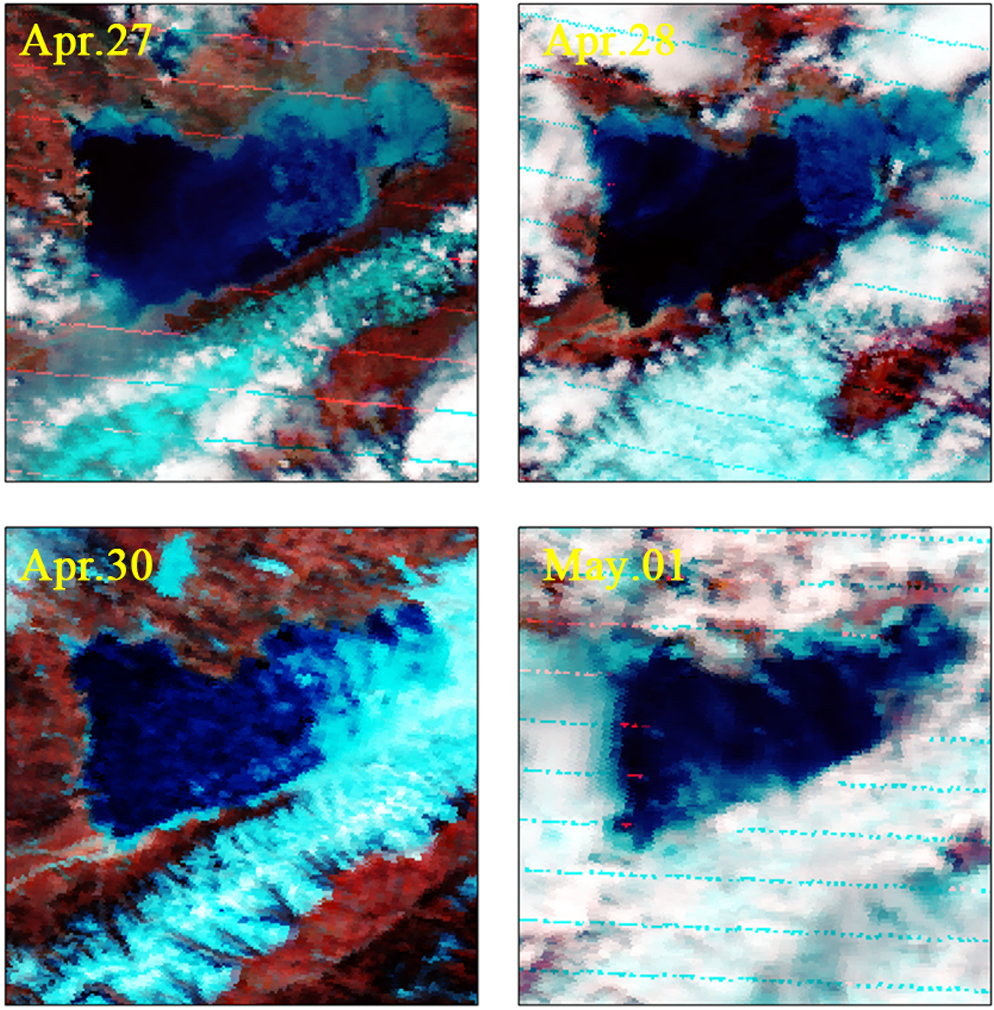 According to the verification result with AMSR-E and MODIS data, the error is much smaller than the error (systematic error) in the data themselves or the error in the aforementioned theoretical analysis. Therefore, it is feasible to apply the SMMR and SSM/I data to monitor the freezing and ablation times of lake ice, and the results are reliable. 4.3.Relationship Between Lake Ice Phenology and Annual Average TemperatureThe annual average temperature of the Nam Co Basin was for 1971 to 1991 and 0.22°C for 1991 to 2000. The increase in temperature is very obvious.11 However, the annual average temperature for 2000 to 2010 was 1.67°C, indicating that the increase in temperature has significantly accelerated.30 The results of Wang et al.31 also indicate that an upward trend in temperature in the Nam Co Basin is obvious. The comparison [Fig. 8(a)] between the duration time of lake ice and average temperature in corresponding years during 1979 to 2010 for Nam Co Lake indicates a negative correlation between them. The trend of the two curves is essentially the same whereas the peak values are opposite, which further indicates that the response of lake ice to temperature is very sensitive. Over the past several decades, the temperature has increased and the duration of lake ice has decreased. The comparison between the freezing and ablation times of lake ice and annual average temperature [Fig. 8(b)] indicates a negative correlation between the ablation time of lake ice and annual average temperature; the peak values of the curves are opposite and the agreement is very high. The freezing time of lake ice is positively correlated with annual average temperature, and the trends of the two curves are essentially the same. However, there is no strict linear relationship between the annual average temperature and the length of duration time, freezing time, and ablation time of lake ice. For example, the average temperature in 1997 was the lowest from 1979 to 2010, whereas the duration time of lake ice was not the longest, nor was the ablation time the latest. The main reason for this disagreement is that the freezing and ablation times have a higher correlation with monthly average temperature, and an abrupt temperature change in a short time will affect the freezing and ablation status of lake ice. 5.ConclusionBased on our results, we suggest that it is feasible to apply the SMMR and SSM/I data to calculate the freezing, ablation, and duration times of lake ice for a long time and that the results are reliable. From 1978 to 2013, the duration of Nam Co lake ice decreased by to 20 days. The freezing date of lake surface has been delayed approximately 9 days, and the ablation date of the lake surface has advanced by 9 to 10 days. The duration of lake ice has a negative correlation with annual average temperature, and therefore, the duration time of lake ice can be used as an indicator of regional climate change. For remote alpine lakes such as Nam Co Lake, it is necessary to obtain information about the ice phenology of the lake and analyze regional climate change through remote sensing methods. The freely available long time series of passive microwave remote sensing data with high revisit periods plays a pivotal role in the study of the response of lake ice phenology to climate warming. However, there are many factors that affect the variation in lake ice phenology, such as terrain, wind direction and speed, salinity, and water depth in addition to temperature. How these factors impact Nam Co lake ice and how the lake ice responds to global warming in the future are still not answered and are beyond the scope of this study. Therefore, the application of high-resolution multisource remote sensing data to comprehensively analyze the freezing and ablation of lakes and their response to climate change is an important area of research for the future. AcknowledgmentsThis work is financially supported by State Key Laboratory of Lake Science and Environment, Nanjing Institute of Geography and Limnology, Chinese Academy of Sciences (No. 2012SKL011), program for National Key Technology Research and Development (No. 2012BAH28B02), program for National Nature Science Foundation (No. 41371391), program for the Specialized Research Fund for the Doctoral Program of Higher Education of China (No. 20120091110017), and a project funded by the Priority Academic Program Development of Jiangsu Higher Education Institutions. The scanning multichannel microwave radiometer and special sensor microwave/imager data used in this study are obtained from the National Snow and Ice Data Center ( http://nsidc.org). We would thank the two anonymous reviewers and editor for the valuable comments and suggestions to greatly improve the paper. ReferencesJ. A. AustinS. M. Colman,
“Lake Superior summer water temperatures are increasing more rapidly than regional air temperatures: a positive ice-albedo feedback,”
Geophys. Res. Lett., 34
(6),
(2007). http://dx.doi.org/10.1029/2006GL029021 GPRLAJ 0094-8276 Google Scholar
J. AustinS. Colman,
“A century of temperature variability in Lake Superior,”
Limnol. Oceanogr., 53
(2), 2724
–2730
(2008). http://dx.doi.org/10.4319/lo.2008.53.6.2724 LIOCAH 0024-3590 Google Scholar
J. Qiu,
“The third pole,”
Nature, 454
(7203), 393
–396
(2008). http://dx.doi.org/10.1038/454393a NATUAS 0028-0836 Google Scholar
W. W. ImmerzeelL. P. van BeekM. F. Bierkens,
“Climate change will affect the Asian water towers,”
Science, 328
(5984), 1382
–1385
(2010). http://dx.doi.org/10.1126/science.1183188 SCIEAS 0036-8075 Google Scholar
T. Yaoet al.,
“Amplitude of climatic changes in Qinghai-Tibetan Plateau,”
Chinese Sci. Bull., 45
(13), 1236
–1243
(2000). http://dx.doi.org/10.1007/BF02886087 CSBUEF 1001-6538 Google Scholar
R. Maet al.,
“China’s lakes at present: number, area and spatial distribution,”
Sci. China Ser. D., 54
(2), 283
–289
(2011). http://dx.doi.org/10.1007/s11430-010-4052-6 SCDEF8 1006-9313 Google Scholar
L. ZhuM. XieY. Wu,
“Quantitative analysis of lake area variations and the influence factors from 1971 to 2004 in the Nam Co basin of the Tibetan Plateau,”
Chinese Sci. Bull., 55
(13), 1294
–1303
(2010). http://dx.doi.org/10.1007/s11434-010-0015-8 CSBUEF 1001-6538 Google Scholar
G. Yuet al.,
“The last glacial lakes in China records and its climatic significance,”
Chinese Sci. Bull., 45
(3), 250
–255
(2000). http://dx.doi.org/10.1007/BF02884684 CSBUEF 1001-6538 Google Scholar
Y.-J. Dinget al.,
“Climatic implications on variations of lakes in the cold and arid regions of China during the recent 50 years,”
J. Glacio. Geocryo., 28
(5), 623
–632
(2006). Google Scholar
F. Chenet al.,
“Glaciers and lake change in response to climate change in the Nam Co Basin, Tibet,”
J. Mt. Sci., 27
(6), 641
–647
(2009). 1672-6316 Google Scholar
Y. WuL. Zhu,
“The response of lake-glacier variations to climate change in Nam Co Catchment, central Tibetan Plateau, during 1970–2000,”
J. Geogr. Sci., 18
(2), 177
–189
(2008). http://dx.doi.org/10.1007/s11442-008-0177-3 1009-637X Google Scholar
T. Bolchet al.,
“A glacier inventory for the western Nyainqentanglha Range and the Nam Co Basin, Tibet, and glacier changes 1976-2009,”
Cryosphere, 4
(3), 419
–433
(2010). http://dx.doi.org/10.5194/tc-4-419-2010 1994-0416 Google Scholar
S.-C. Kanget al.,
“Glacier retreating dramatically on Mt. Nyainqêntanglha during the last 40 years,”
J. Glacio. Geocryo., 29
(6), 869
–873
(2007). Google Scholar
B. Quet al.,
“Lake ice and its effect factors in the Nam Co Basin, Tibetan Plateau,”
Progressus Inquisitiones De Mutatione Climatis, 8
(5), 327
–333
(2012). Google Scholar
C. R. Duguayet al.,
“Recent trends in Canadian lake ice cover,”
Hydrol. Process., 20
(4), 781
–801
(2006). http://dx.doi.org/10.1002/(ISSN)1099-1085 HYPRE3 1099-1085 Google Scholar
J. Kropáčeket al.,
“Analysis of ice phenology of lakes on the Tibetan Plateau from MODIS data,”
Cryosphere, 7
(1), 287
–301
(2013). http://dx.doi.org/10.5194/tc-7-287-2013 1994-0416 Google Scholar
A. Kouraevet al.,
“Observations of Lake Baikal ice from satellite altimetry and radiometry,”
Remote Sens. Environ., 108
(3), 240
–253
(2007). http://dx.doi.org/10.1016/j.rse.2006.11.010 RSEEA7 0034-4257 Google Scholar
W. MarszelewskiR. Skowron,
“Ice cover as an indicator of winter air temperature changes: case study of the Polish Lowland lakes,”
Hydrol. Sci. J., 51
(2), 336
–349
(2006). http://dx.doi.org/10.1623/hysj.51.2.336 HSJODN 0262-6667 Google Scholar
G. MarcJ. Martin,
“Temperature variations in lake ice in central Alaska, USA,”
Ann. Glaciol., 40
(1), 89
–94
(2005). http://dx.doi.org/10.3189/172756405781813825 ANGLDN 0260-3055 Google Scholar
R. LatifovicD. Pouliot,
“Analysis of climate change impacts on lake ice phenology in Canada using the historical satellite data record,”
Remote Sens. Environ., 106
(4), 492
–507
(2007). http://dx.doi.org/10.1016/j.rse.2006.09.015 RSEEA7 0034-4257 Google Scholar
T. NonakaT. MatsunagaA. Hoyano,
“Estimating ice breakup dates on Eurasian lakes using water temperature trends and threshold surface temperatures derived from MODIS data,”
Int. J. Remote Sens., 28
(10), 2163
–2179
(2007). http://dx.doi.org/10.1080/01431160500391957 IJSEDK 0143-1161 Google Scholar
S. E. L. Howellet al.,
“Variability in ice phenology on Great Bear Lake and Great Slave Lake, Northwest Territories, Canada, from SeaWinds/QuikSCAT: 2000–2006,”
Remote Sens. Environ., 113
(4), 816
–834
(2009). http://dx.doi.org/10.1016/j.rse.2008.12.007 RSEEA7 0034-4257 Google Scholar
T. CheX. LiR. Jin,
“Monitoring the frozen duration of Qinghai Lake using satellite passive microwave remote sensing low frequency data,”
Chinese Sci. Bull., 54
(13), 2294
–2299
(2009). http://dx.doi.org/10.1007/s11434-009-0044-3 CSBUEF 1001-6538 Google Scholar
Z. GuanC. ChenY. Qu, Rivers and Lakes in Tibet, 176
–182 Science Press, Beijing
(1984). Google Scholar
J. Wanget al.,
“Investigation of bathymetry and water quality of Lake Nam Co, the largest lake on the central Tibetan Plateau, China,”
Limnology., 10
(2), 149
–158
(2009). http://dx.doi.org/10.1007/s10201-009-0266-8 LIOCAH 0024-3590 Google Scholar
J. Kropáčeket al.,
“Analysis of lake level changes in Nam Co in central Tibet utilizing synergistic satellite altimetry and optical imagery,”
Int. J. Appl. Earth Obs. Geoinf., 17 3
–11
(2012). http://dx.doi.org/10.1016/j.jag.2011.10.001 ITCJDP 0303-2434 Google Scholar
B. LehnerP. Döll,
“Development and validation of a global database of lakes, reservoirs and wetlands,”
J. Hydrol., 296
(1–4), 1
–22
(2004). http://dx.doi.org/10.1016/j.jhydrol.2004.03.028 JHYDA7 0022-1694 Google Scholar
W. L. BarnesT. S. PaganoV. V. Salomonson,
“Prelaunch characteristics of the moderate resolution imaging spectroradiometer (MODIS) on EOS-AM1,”
IEEE Trans. Geosci. Remote Sens., 36
(4), 1088
–1100
(1998). http://dx.doi.org/10.1109/36.700993 IGRSD2 0196-2892 Google Scholar
A. V. Kouraevet al.,
“Sea ice cover in the Caspian and Aral Seas from historical and satellite data,”
J. Mar. Syst., 47
(1–4), 89
–100
(2004). http://dx.doi.org/10.1016/j.jmarsys.2003.12.011 JMASE5 0924-7963 Google Scholar
N. Linet al.,
“Correlation degree analysis of meteorological elements and dynamic remote sensing of Alpine lakes in Naqu,”
J. Eco. Rural Environ., 28
(3), 231
–237
(2012). Google Scholar
X. Wanget al.,
“Glacier temporal-spatial change characteristics in western Nyainqentanglha Range, Tibetan Plateau 1977-2010,”
J. China Univ. Geosci., 37
(5), 1082
–1092
(2012). JCUGEX Google Scholar
|