
|
|
1.IntroductionThe subsurface stratigraphic and physical tectonic features of lunar regolith are the main tasks of lunar exploration.1–3 In China’s first lunar exploration project, a multichannel (3.0, 7.8, 19.35, and 37 GHz) microwave radiometer (MRM) was aboard Chang’E-1 (CE-1) for measuring the brightness temperature (TB) from the lunar surface, surveying the global distribution of lunar regolith thickness, and globally evaluating 3He content.4,5 During CE-1’s lifetime of more than a year, it covered the surface of the moon many times in a precession polar orbit 200 km above the lunar surface, transmitting 1.38 terabytes of data to Earth. The first global TB map of the moon6 was obtained from CE-1’s MRM, without the distortion due to the mixing spatial and temporal effects. Lunar topographic signatures, such as the boundaries between mare and highland, and the contour of craters, can be identified in the 37 GHz TB maps, and are similar to those seen in Clementine’s lunar topography maps5,7,8 and CE-1 global optical maps.9 To find more new features of craters from the TB data, three aspects of topographic signatures over craters have been analyzed in a single track view in this paper, including TB variation along the track, the peak-to-peak value of TB variation with respect to physical parameters, and the correlation between the diurnal TB difference and the altitude profile. Since the topographic effect is more obvious at 37 GHz than at other three frequencies of MRM, 37 GHz TB is chosen to be studied here. 2.TB Data Sets from CE-1 Orbiter2.1.MRM, Charge Coupled Device Camera and Laser Altimeter DataThe observed data applied here are level 2C MRM data, level 2C charge coupled device (CCD) stereo camera data, and level 2B laser altimeter (LAM) data from CE-1 lunar orbiter, which comply with Planetary Data System10 (PDS) standards for file formats and directory names, and are now publicly available at the website http://159.226.88.59:7779/CE1OutENGWeb/ce1files.jsp. The CE-1 MRM was calibrated onboard periodically (the calibration performs every 11.6 s, i.e., once every MRM measurement cycle) to ensure its reliability and accuracy, using a two-point calibration method.11 The nonlinear error of the calibration is within 1 K at 37-GHz channel.11 The detailed description about data calibration and data quality can be found in the relevant literature.6,7,11 The definition of MRM data at various levels of preprocessing was described before,6 and the definition of CCD camera and LAM data at various levels of preprocessing is similar to that of MRM data. 2763 tracks (orbit number from 0243 to 3005) of MRM data by CE-1 from November 2007 to July 2008 are collected. 2.2.Data PreprocessThe triple standard deviation is employed to eliminate the sharp abnormal data (i.e., the exceptionally cold/hot data) from one-track observation (including the MRM and LAM data) as follows: where is the standard deviation of the data in one-track observation, stands for the value of the data, and is the data length. The standard deviation of one track data is computed once for both daytime and nighttime.For helping the study of topographic features, the coordinated universal time (UTC) time recorded in the MRM and LAM data sets is transformed to the lunar local time to know the solar illumination condition directly. The detailed transformation algorithm is shown in Fig. 1. With the time difference (Earth days) between the measured time and the subsolar time at zero longitude, the longitude of the subsolar site at the measured time (Julian day) is obtained, where it is supposed to be at lunar local noon. Combined with the longitude difference between the subsolar site and the target site, the lunar local time of the measurement at the target site is derived. Here, the lunar local time is divided into 12 time zones, like the time zones on the Earth. 3.Observed TB Over CratersThere is a large number of impact craters on the lunar surface. The geometric characteristics such as diameter, morphology, age, and crater shape vary among different craters. Therefore, in the analysis of the TB variation of the crater, the crater should be discussed by catalog. As the crater diameter is usually used to statistically model other geometric properties of craters,12 craters with different diameters from 24 to 180 km have been chosen. In this section, four craters are analyzed as examples, including two complex craters Aristoteles (50.2°N, 17.4°E) and Hercules (46.7°N, 39.1°E), one simple crater Helicon (40.4°N, 23.1°W), and one large crater Schiller (51.9°S, 39.0°W). Figure 2 shows the temporal sequence of CE-1 frame acquisitions. It takes MRM 11.6 s to make one measurement cycle, including 1.6 s for the two-point calibration (background and heat source), shots’ time for six measurements (each 1.6 s), and 0.4 s waiting time. Due to the oversampling of MRM’s observation, there are about 24 to 26 TB values obtained when observing crater Hercules (diameter 69 km). Fig. 2Plane view of the MRM’s measurement cycle on the lunar surface. It takes CE-1 about 127 min to perform a circle around the moon in the circular polar orbit of 200 km, the average speed of CE-1 can be obtained by . The shot-to-shot distance between two consecutive CE-1 shots is about 2.56 km (). 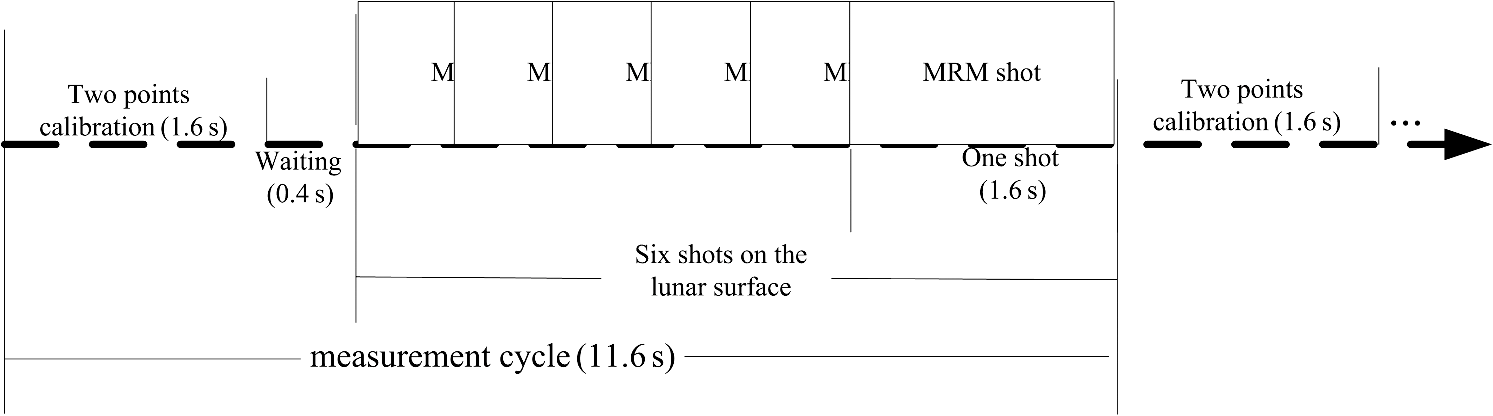 3.1.TB Features in One TrackFigure 3 shows the daytime (nighttime) TB variation in one track over craters Aristoteles, Hercules, Helicon, and Schiller. The TB variation over the flat region near the craters and the nadir-looking CCD images of the crater and the nearby flat region are presented to help study the TB features over craters. Fig. 3Observed TB over lunar craters (a) nighttime TB over crater Aristoteles and the nearby flat region, (b) daytime TB over crater Aristoteles and the nearby flat region, (c) optical image of crater Aristoteles and the nearby flat area, (d) nighttime TB over crater Hercules and the nearby flat region, (e) daytime TB over crater Hercules and the nearby flat region, (f) optical image of crater Hercules and the nearby flat area, (g) nighttime TB over crater Helicon, (h) daytime TB over crater Helicon, (i) optical image of crater Helicon, (j) nighttime TB observation over crater Schiller, (k) daytime TB over crater Schiller, and (l) optical image of crater Schiller.  From Fig. 3, it can be seen that the daytime (nighttime) TB along the track decreases in the ascending observation, but increases in the descending observation. From Figs. 3(b), 3(e), and 3(h), it can be seen that the variation of daytime TB along the flight direction over a single crater shows an oscillatory behavior, whereas the variation of daytime TB over nearby flat regions looks like a linear curve. The peak-to-peak values of the TB curves in Figs. 3(b), 3(e), and 3(h) are about 12, 10, and 4 K, respectively. The variations of nighttime TB in Figs. 3(a), 3(d), and 3(g) along the flight direction also display an oscillatory behavior. The peak-to-peak values in Figs. 3(a), 3(d), and 3(g) are about 6, 6, and 1 K, respectively, which are smaller than that of the daytime variation. The same variation can be found in one-track observation over the three single craters in Figs. 3(j) and 3(k), covering crater Schiller and two other smaller craters. The variation of daytime (nighttime) TB displays the same oscillatory behavior when MRM across the two smaller craters and the peak-to-peak values of the curves over this region are about 4 K. Here, TB varies like that over a single-crater when MRM scans over these two craters, as they are very close to each other, and both whose diameters are about 30 km. When MRM flies away from these small craters to the flat area, the TB variation becomes linear. The TB shows the same oscillatory behavior when MRM scans over crater Schiller and the peak-to-peak values of the curves over this region are about 8 K. Here, the two small craters are far enough away from crater Schiller (the distance of 48 km between them is larger than MRM’s spatial resolution of 35 km), which make the TB variation over crater Schiller shows the same behavior as that over a single crater. Thirty-seven gigahertz TB over most lunar craters by CE-1 MRM has been found to show an oscillatory behavior along the flight direction in one-track observation. However, limiting by the length of the paper, TB variations over other lunar craters are not presented. Actually, TB is the averaged radiometry of the lunar surface within a spatial resolution weighting with the MRM antenna radiation pattern.11 With the smaller penetration, the value of 37 GHz TB along the profile of a crater is determined by the average temperature within a spatial resolution, i.e., the percentage of the cold and warm areas due to the effect of shadow and surface tilts. As MRM scanning across the crater, the percentage of cold and warm areas inside a spatial resolution varies and the TB shows an oscillatory behavior. The amplitude of TB curves at 37 GHz varies with different craters (from 1 to 12 K). 3.2.Peak-to-Peak Value of Daytime TBThe lowest value of 37 GHz daytime TB along the profile of a crater is determined by the average temperature value and the percentage of the cold area, and the highest TB value is determined by the average temperature value and the percentage of the warm area. The physical temperature distribution (cold and warm areas) is affected by the parameters, including illumination conditions (observation time and latitude), and the crater shape.13 The crater shape can be described by the relative slope angle and where , , and are the depth (m), diameter (m), and floor diameter (m) of a crater, respectively. The relative slope angles of the craters Aristoteles, Hercules, Schiller, and Helicon are 13.38, 14.66, 10.07, and 10.68 deg, which are estimated with the heights from level 2B LAM data. The amplitude of 37 GHz daytime TB (the highest value minus the lowest value) over a crater is mainly affected by the observation time (solar incident angle), the crater shape, and the crater diameter, as the effect on TB by other parameters such as age and latitude is almost eliminated by the subtraction.Take four craters as examples. The observation time of TB over crater Schiller (lunar time around 13:17) and Helicon (lunar time around 13:18) is approximately the same. The relative slope angle of crater Schiller is almost the same as that of crater Helicon. Therefore, the bigger amplitude of TB curve over crater Schiller compared to that of crater Helicon is likely caused by the bigger diameter of crater Schiller, which makes the maximum percentage of the cold area and warm area within a spatial resolution larger. Here, the diameter of crater Helicon is about 24 km, so the maximum percentage of the cold and warm areas within a spatial resolution (35 km) cannot be large. The lunar local time for observations over crater Hercules (lunar time around 9:59 and solar incident angle about 53.5 deg) and Aristoteles (lunar time around 11:40 and solar incident angle about 51.9 deg) is earlier before noon than that for observations over craters Schiller and Helicon (solar incident angle about 45.4 deg). With larger solar incident angles and larger relative slope angles, it is easier to be shadowed at the regions against the sun inside the craters Hercules and Aristoteles than at these regions inside two other craters, leading to the cooler average temperature of the cold areas inside craters Hercules and Aristoteles. The average temperature of the warm areas inside craters Hercules and Aristoteles is warmer due to the larger tilts. Therefore, the amplitudes of daytime TB curves over craters Hercules and Aristoteles are bigger. The uniform distribution of content over a crater may also affect the amplitude of 37 GHz TB curve. This may be the reason for the bigger amplitude of TB over crater Aristoteles, compared to the crater Hercules. In other words, the observation time and the crater shape are the main factors to determine the amplitude of daytime TB variation at 37 GHz over craters with a diameter larger than the spatial resolution of MRM. The amplitude of daytime TB at 37 GHz over craters whose diameter is smaller than (e.g., 24 km) the spatial resolution of MRM, cannot be large due to the smaller percentage of the cold and warm areas within an MRM shot. 4.Diurnal TB Difference Over Young Craters4.1.Correlation Between TB Difference and Altitude ProfileSpecial characteristics have been found over the relatively younger craters, e.g., craters Aristarchus and King are cold spots in the nighttime TB map at 37 GHz,6 which have been identified as hot spots during a lunar eclipse.14,15 Besides, the nighttime TB is cooler and the daytime TB is warmer16 over young craters, due to the large rock abundance preserved in the young craters.17 Therefore, the diurnal TB variation over a young crater, which is obviously large and typical, has been chosen to be studied here. To study the relation between TB and crater terrain, the diurnal difference of 37 GHz TB over four young craters, including Aristarchus (23.7°N, 47.4°W), Tycho (43.31°S, 11.36°W), King (5.0°N, 120.5°E), and Colombo (15.1°S, 45.8°E), have been chosen to be compared with their altitude profile. The diurnal TB difference is defined as where (K) stands for the diurnal difference over a crater, (K) is the nighttime observation, and (K) is the daytime observation. Here, the time interval between daytime and nighttime is about half a lunar day. The altitude is gotten by the formula , where is from level 2B LAM data.Figure 4 shows the TB diurnal difference and altitude profile plotted as a function of latitude for the four craters. From Fig. 4, it can be seen that the peak-to-peak values of these four diurnal difference curves are about 20, 20, 20, and 5 K and the largest differences over the four craters are about , , , and , respectively. Compared with the latitude of the crater center, the latitudes of the trough of TB difference curves are shifted by a little to the warm area (the sunlit wall) inside the craters, due to the effect of surface tilts and the oblique incidence of the sun. The shifted degrees of these four TB difference curves are about 0.3, 0.4, 0.5, and 0.1 deg, which depend on the solar incident angle and the relative slope angle of the crater. Here, the position of the warm area inside the crater is estimated by the solar azimuth angle known from the MRM data files, e.g., the warm area is estimated to be at the northeast wall of crater Aristarchus (the latitude is higher than that of crater center), according to the position of the subsolar site, which is at the southwest of the crater, estimated by the solar azimuth angle (about 215 deg). Fig. 4The TB diurnal difference and altitude profile plotted as a function of latitude for the four craters (a) crater Aristarchus, (b) crater Tycho, (c) crater King, and (d) crater Colombo. 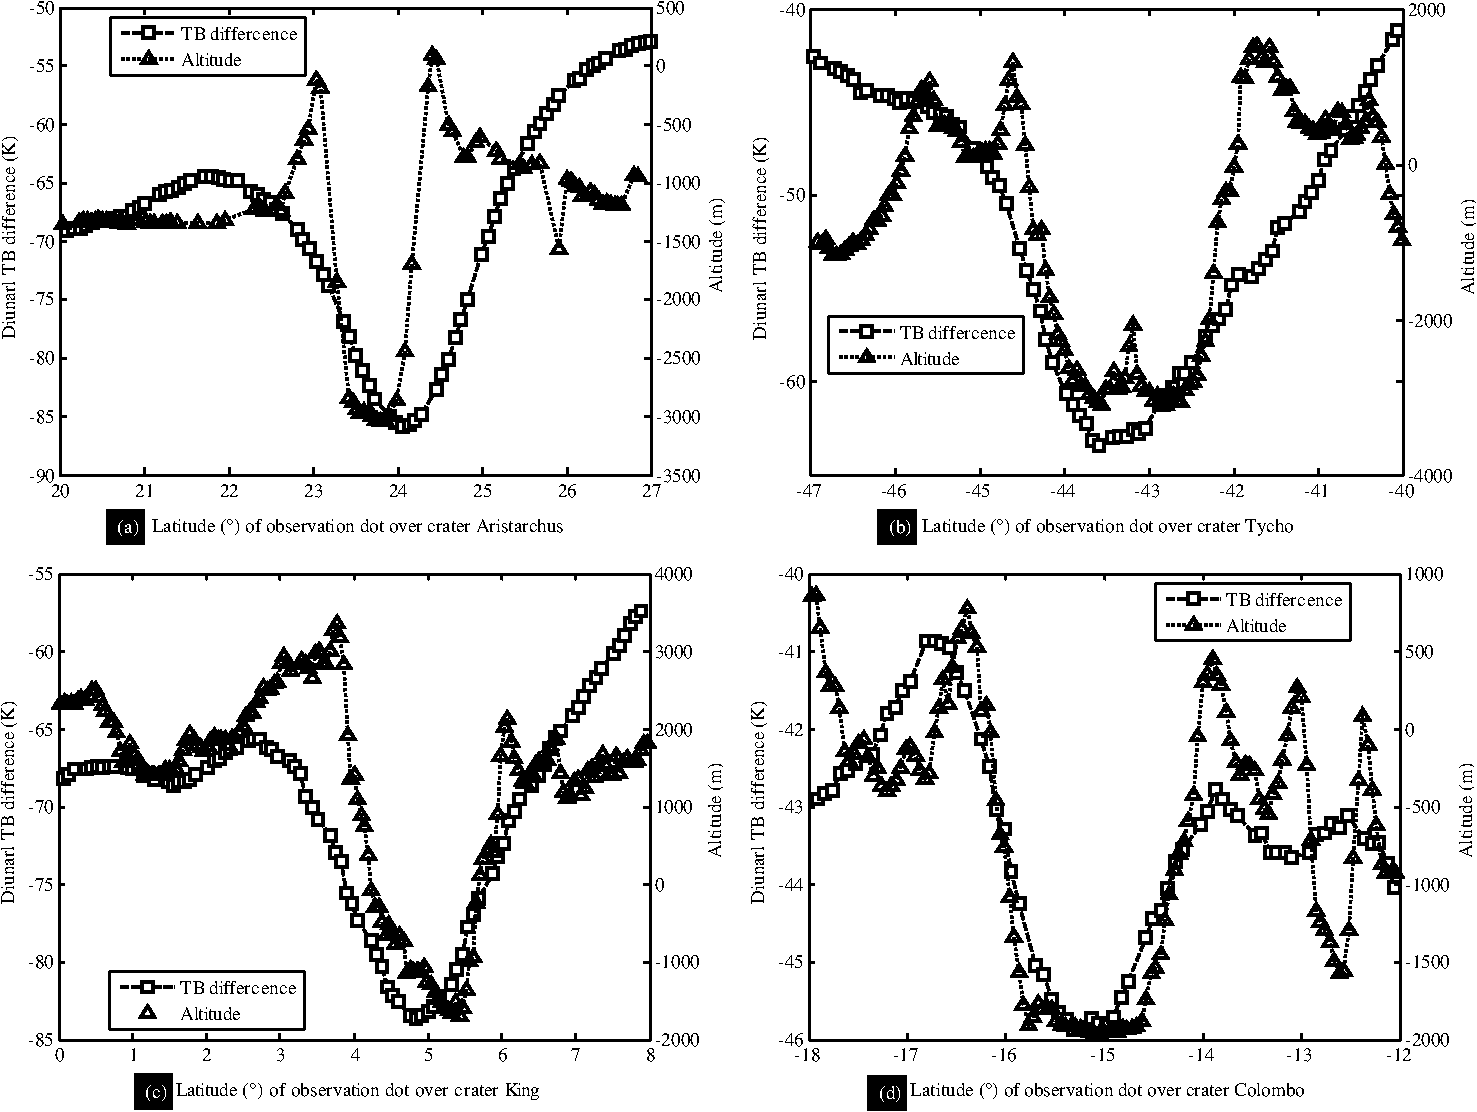 From Fig. 4, it can be seen that the curved shape of the diurnal TB difference and the altitude profile display general similarities over craters, especially over regions inside the craters. As the value of daytime TB is much higher than that of nighttime TB over a crater, the diurnal TB difference curves reflect the shape of daytime TB curves to a certain degree. So, the diurnal TB difference is bigger inside the craters than that over regions off the craters, caused by the higher value of daytime TB at the warm area. In other words, there is a great curve shape similarity between the diurnal TB difference and the altitude profile over these young craters. Due to the sunlit crater wall of the selected craters, the biggest diurnal TB difference occurs nearby the crater center, not at the center. The bigger diurnal TB difference (about to 86 K) over these four craters is caused by the rock and the bright rays preserved in the young crater15 surfaces. The value of diurnal TB difference varies with the different craters. 4.2.Explanation for the Diverse TB DifferenceThe local lunar time of the highest TB observed at 37 GHz by CE-1 is about 14:00 and that of the lowest TB is about 5:00.6 Therefore, when the observation time is closer to 14:00, the TB value at daytime is higher; when the observation time is closer to 5:00, the TB value at nighttime is lower. Although the local time of observations over crater King (around 11:40 at daytime and around 22:39 at nighttime) is farther from 14:00 and 5:00 than that of observations over the other three craters, the biggest diurnal TB difference is larger than that of craters Tycho and Colombo, and is almost the same as that of crater Aristarchus. The larger diurnal TB difference is likely caused by the larger rock abundance of crater King (see Fig. 5) than that of the other three craters. Here, the rock abundance is the retrieved results17 from Diviner Lunar Radiometer Experiment data at the website: ftp://pds-geosciences.wustl.edu/lro/lro-l-dlre-4-rdr-v1/lrodlr_1001/data/gdr_l3/cylindrical/img/. Fig. 5Rock abundance over young craters, including crater Aristarchus, crater Tycho, crater King, and crater Colombo. 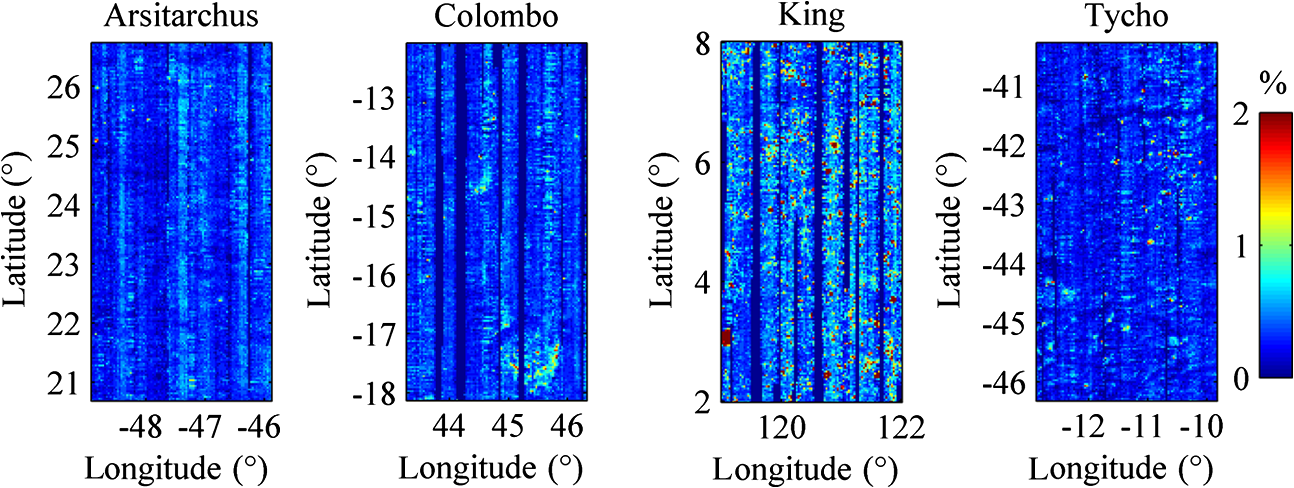 From Fig. 5, it can be seen that the rock abundance over craters Aristarchus, Tycho, and Colombo is almost the same. Therefore, the bigger diurnal TB difference over crater Aristarchus compared with that of craters Tycho and Colombo, is mainly caused by its local time of the observations (around 13:11 at daytime and around 0:20 at nighttime), among which the local time at daytime is closer to 14:00 and the local time at nighttime is closer to 5:00. The bigger diurnal TB difference over crater Tycho than that over Colombo is also caused by the local time for observation over crater Tycho (around 12:15 at daytime and around 1:09 at nighttime). Here, the same local time difference at nighttime causes lesser TB difference than the TB difference results from the local time difference at daytime. In other words, the variation of diurnal TB difference at 37 GHz with respect to the selected young craters is mainly caused by the rock abundance and observation time (from about 46 to 84 K). 5.ConclusionsThe variation of daytime (nighttime) TB at 37 GHz along the profile of a lunar crater shows an oscillatory behavior in one-track observation, whether the diameter of crater is smaller (e.g., 24 km) or bigger (e.g., 180 km) compared with the spatial resolution (35 km) of CE-1 MRM. The peak-to-peak value of TB variation changes over craters. The crater shape and the observation time are the main factors to determine the amplitude of daytime TB variation at 37 GHz over craters, with the diameter larger than the spatial resolution of MRM. Diurnal TB difference and the altitude profile display general similarities along the profile of a selected young crater. The biggest difference occurs near the center of the selected crater but not at the center, caused by the warm area (sunlit crater wall) due to the effect of surface tilts. The diurnal TB difference varies over selected young craters, and is significantly affected by the rock abundance and the observation time. The large diurnal difference over selected craters is caused by the highly conducting rock preserved on the young impact surface. However, the topographic features of lunar craters found here will be better explained with the improved TB model, incorporating the crater shape, and rock abundance, which may help to improve the retrieval of parameters such as lunar regolith thickness from the MRM data. AcknowledgmentsThis work was jointly supported by grants from the National Natural Science Foundation of China (Nos. 41001195, 40971185, and 41275032), the Foundation for Independent Innovation (No. 2011QN029), and Science and Technology Development Fund in Macao SAR (Grant No. 048/2012/A2). We gratefully thank the reviewer for the careful reading and valuable suggestion. We would like to thank Professor Luo Jun for his help. We appreciate the contributors of China’s Lunar Exploration Program. It is their contribution that makes the observation data of CE-1 available. ReferencesJ. N. GoswamiM. Annadurai,
“Chandrayaan-1 mission to the Moon,”
Acta Astronaut., 63
(11–12), 1215
–1220
(2008). http://dx.doi.org/10.1016/j.actaastro.2008.05.013 AASTCF 0094-5765 Google Scholar
T. Onoet al.,
“Lunar radar sounder observations of subsurface layers under the nearside maria of the Moon,”
Science, 323
(5916), 909
–912
(2009). http://dx.doi.org/10.1126/science.1165988 SCIEAS 0036-8075 Google Scholar
S. Nozetteet al.,
“The Clementine mission to the Moon: scientific overview,”
Science, 266
(5192), 1835
–1839
(1994). http://dx.doi.org/10.1126/science.266.5192.1835 SCIEAS 0036-8075 Google Scholar
Z. Y. Ouyanget al.,
“Chang’E-1 lunar mission: an overview and primary science results,”
Chin. J. Space Sci., 30
(5), 392
–403
(2010). KKXUDK 0254-6124 Google Scholar
Y. C. Zhenget al.,
“China’s lunar exploration program: present and future,”
Planet Space Sci., 56
(7), 881
–886
(2008). http://dx.doi.org/10.1016/j.pss.2008.01.002 PLSSAE 0032-0633 Google Scholar
Y. C. Zhenget al.,
“First microwave map of the Moon with Chang’E-1 data: the role of local time in global imaging,”
Icarus, 219
(1), 194
–210
(2012). http://dx.doi.org/10.1016/j.icarus.2012.02.017 ICRSA5 0019-1035 Google Scholar
K. L. Chanet al.,
“Lunar regolith thermal properties revealed by Chang’E-1 microwave brightness temperature data,”
Earth Planet. Sci. Lett., 295
(1–2), 287
–291
(2010). http://dx.doi.org/10.1016/j.epsl.2010.04.015 EPSLA2 0012-821X Google Scholar
J. S. Jianget al.,
“The microwave moon-microwave sounding the lunar surface from China lunar orbiter CE-1 satellite,”
in 37th COSPAR Meeting,
(2008). Google Scholar
C. L. Liet al.,
“The global image of the moon by the Chang’E-1: data processing and lunar cartography,”
Sci. China Earth Sci., 40
(3), 294
–306
(2010). Google Scholar
S. K. McMahon,
“Overview of the planetary data system,”
Planet. Space Sci., 44
(1), 3
–12
(1996). http://dx.doi.org/10.1016/0032-0633(95)00101-8 PLSSAE 0032-0633 Google Scholar
Z. Z. Wanget al.,
“Calibration and brightness temperature algorithm of CE-1 Lunar Microwave Sounder (CELMS),”
Sci. China Ser. D Sci., 53
(9), 1392
–1406
(2010). http://dx.doi.org/10.1007/s11430-010-4008-x SCDEF8 1006-9313 Google Scholar
Lunar Sourcebook A User’s Guide to the Moon, 736 Cambridge Univ. Press, Cambridge, UK
(1991). Google Scholar
X. Y. LiS. J. WangY. C. Zheng,
“Estimation of solar illumination on the moon: a theoretical model,”
Planet. Space Sci., 56
(7), 947
–950
(2008). http://dx.doi.org/10.1016/j.pss.2008.02.008 PLSSAE 0032-0633 Google Scholar
S. D. PriceD. Mizuno,
“Thermal profiles of the eclipsed Moon,”
Adv. Space Res., 31
(11), 2299
–2304
(2003). http://dx.doi.org/10.1016/S0273-1177(03)00531-3 ASRSDW 0273-1177 Google Scholar
R. W. ShorthillJ. M. Saari,
“Nonuniform cooling of the eclipsed moon: a listing of thirty prominent anomalies,”
Science, 150
(3693), 210
–212
(1965). http://dx.doi.org/10.1126/science.150.3693.210 SCIEAS 0036-8075 Google Scholar
X. H. GongY. Q. Jin,
“Diurnal change of MW and IR thermal emissions from lunar craters with relevance to rock abundance,”
Acta Astronaut., 86 237
–246
(2013). http://dx.doi.org/10.1016/j.actaastro.2013.01.020 AASTCF 0094-5765 Google Scholar
J. L. BandfieldR. R. GhentA.R. Vasavada,
“Lunar surface rock abundance and regolith fines temperatures derived from LRO Diviner radiometer data,”
J. Geophys. Res., 116
(E12), E00H02
(2011). http://dx.doi.org/10.1029/2011JE003866 JGREA2 0148-0227 Google Scholar
Biography Guo-Ping Hu received BS degree in communication engineering from Nanchang University, China, in 2006. He earned his MS degree in microwaves and electromagnetics from Huazhong University of Science and Technology (HUST), Wuhan, China, in 2008. He is now a PhD candidate in microwaves and electromagnetics from HUST. His research interests include microwave remote sensing, modeling of microwave radiometry, retrieval techniques from microwave data.  Ke Chen received BS and MS degrees in applied physics and a PhD degree in electrical engineering all from Huazhong University of Science and Technology (HUST), Wuhan, China, in 1999, 2002, and 2010, respectively. He is an associate professor in science and technology in the Multi-Spectral Information Processing Laboratory (Department of Electronics and Information Engineering), HUST. His research interests include microwave techniques and microwave remote sensing.  Wei Guo received BS and MS degrees in wireless physical from the University of Science and Technology of China, HeFei, China, in 1982 and 1987, respectively. He is a professor in science and technology in the Multi-Spectral Information Processing Laboratory (Department of Electronics and Information Engineering), Huazhong University of Science and Technology. His research interests include microwave techniques and microwave remote sensing.  Qing-Xia Li received BS, MS, and PhD degrees in electrical engineering from HUST, Wuhan, China, in 1987, 1990, and 1999, respectively. He is a professor in science and technology in the Multi-Spectral Information Processing Laboratory (Department of Electronics and Information Engineering), Huazhong University of Science and Technology (HUST). His research interests include microwave remote sensing and deep space exploration, electromagnetic theory and application, antenna array and signal processing.  Hong-Yan Su received a PhD degree from Beijing Institute of Technology, Beijing, China, in 2006. She is the deputy director of science and technology in the Millimeter-wave Laboratory, Beijing Institute of Remote-sensing Equipment. Her research interests include radar signal processing, millimeter wave radar systems with high range resolution, and submillimeter wave radar systems. |


