
|
|
1.IntroductionThe atmosphere is a superb integrator of spatiotemporally variable surface fluxes. The complexity of global and regional carbon cycles in surface fluxes leads to uncertainty in climate forecasting. The distribution of in the atmosphere, and its time evolution, can thus be used to quantify surface fluxes. A satellite-based remote sounding instrument capable of measuring the long-term global distributions of would greatly improve our ability to obtain the spatiotemporal variability of atmospheric concentrations.1,2 Satellite measurements of the global atmospheric distribution would record its continuous change, which could provide not only a long time series that is stable over wide regions, but also ground-to-aerial three-dimensional information regarding atmospheric composition. Advanced infrared (IR) sounders, particularly the atmospheric infrared sounder (AIRS) aboard the Aqua satellite and the Infrared Atmospheric Sounding Instrument (IASI) aboard the Metop satellite,3 have been approved to retrieve mid-troposphere concentration data. The scanning imaging absorption spectrometer for atmospheric chartography (SCIAMACHY)4 aboard the European Environmental Satellite (ENVISAT) is a spectrometer designed to measure the surface concentrations of because the channels sensitive to the near-IR are used for retrieval. The Greenhouse Gases Observing Satellite (GOSAT) was launched on January 23, 2009, and its task is to monitor global atmospheric levels of greenhouse gases from space.5 The orbiting carbon observatory (OCO) was specially equipped by the United States with a high-resolution spectroscopic instrument for observations.6 Unfortunately, the OCO failed to launch in 2009.3 Currently, only the AIRS can provide stable long-term data on the global distribution of . Therefore, simulated AIRS data were used to investigate the sensitivity of retrieval with high precision. Researchers have applied various methods to retrieve data using AIRS data.7–14 Because most of the variability in atmospheric occurs in the planetary boundary layer, the variability related to sinks and sources can be well represented by measurements of the total column. Such measurements should be precise enough to resolve the seasonal variability and horizontal gradients averaged over an atmospheric model grid box (e.g., ) and time scale (e.g., monthly) typical for climate studies and should be accurate enough to resolve long-term trends. For a column average, the mixing ratio gradients over horizontal scales of are typically 0.3% to 0.5% [i.e., 1 to 2 parts per million by volume (ppmv)]. The column measurement goal of 1-ppmv precision on a time scale of 1 month has been shown to improve surface source and sink estimates significantly in model studies.15 Radiance measurements from space can reflect not only absorption but also other atmospheric factors, such as different atmospheric temperatures and pressures. Satellites are expected to provide a promising new source of data by 2020. However, for column-integrated measurements to be useful for source and sink inversions, the requirements on the measurements are stringent.16 Moreover, little work on the sensitivity of atmospheric retrieval from the AIRS observations has been reported. It is well known that the increase in concentration contributes to global climate change. In this study, the focus on atmospheric change is through the response of radiance from the AIRS bands in relation to the responses of other variables. The dependence of the radiance sensitivity on the atmospheric temperature profile, water vapor profile, and data of different locations is also considered. This dependence produces the largest error source in the reverse accuracy of the column concentration, except for those error sources caused while measuring with instrument characteristics. Therefore, the present sensitivity study of global atmospheric retrieval from the AIRS observations will help to improve the understanding of uncertainty about climate change. 2.Measurement Strategies2.1.Ground-Based Validation of the AIRS ProductThe AIRS instrument has been orbiting the earth on NASA’s Aqua satellite in a sun-synchronous near-polar orbit since 2002. For the first time, it affords us the ability to retrieve concentrations globally over land, ocean, and polar regions during the daytime and nighttime, even in the presence of clouds. The accuracy is better than 2 ppmv (i.e., ), without relying on a priori or background information.8 An earlier study8 compared the monthly seasonal variations of the AIRS retrievals to those of airborne measurements17 for the period between September 2002 and March 2004. This comparison showed an agreement of . Further comparisons have been performed with collocated in situ observations available for the period from September 2002 to July 2011.7 The satellite data for this article come from NASA’s official AIRS mid-troposphere product site ( http://airs.jpl.nasa.gov/AIRS_CO2_Data/). Hyperspectral data of low instrument noise from the AIRS have been used to produce global profiles of temperature and water vapor as well as carbon dioxide and other trace gases. The tropospheric products are derived by binning the Level 2 standard retrievals in a grid that is 2 deg in latitude by 2.5 deg in longitude over daily, 8-day, and monthly time spans.7 Ground-based measurements can provide the concentration with high precision. The World Meteorological Organization (WMO), the U.S. National Oceanic and Atmospheric Administration (NOAA), the Meteorological Service of Canada (MSC), and the Japanese National Institute for Environmental Studies (NIES) have built numerous ground-based observation stations throughout the world18,19 to obtain information about variations in . Data from ground-based and aerial measurements are available at the WMO World Data Centre for Greenhouse Gases (WMO WDCGG) web site ( http://gaw.kishou.go.jp/wdcgg/wdcgg.html).18 The above-mentioned agencies provide measurements from a total of baseline observatories, fixed sites, and tall towers, complemented by measurements from ships and aircraft. Although the in situ measurements are highly accurate, the distribution in space and time is necessarily somewhat limited for global process studies.15 In this article, 123 in situ data are selected to validate the quality of the AIRS product. These data cover the period from September 2002 to July 2011, which is the same period as covered by the AIRS data. Figure 1 compares the AIRS products with the in situ observations for September 2002 to July 2011. This comparison shows that the AIRS results are consistent with the ground-based observations. Figure 1 provides the average bias, standard deviation, and correlation coefficients for both the ground-based and satellite observations over the years. The correlation coefficients are higher than 0.8 for most stations from 60°S to 30°N. Further, the bias is lower than 3 ppmv, and the monthly average standard deviation is . Fig. 1Error comparisons between atmospheric infrared sounder (AIRS) products and in situ observations.  The correlation coefficient is lower than 0.5 for the areas from 30°N to 90°N. That is, the northern hemisphere shows a lower correlation than the southern hemisphere, because the concentration of human activities is higher in the northern hemisphere than in the vast sparsely populated areas of the southern hemisphere. The bias is , and the monthly average standard deviation is generally within 6 ppmv (though some individual sites have large deviations). The validation results show that the AIRS mid-troposphere product is consistent with ground-based and aerial measurements at various latitudes. The error is mainly for northern latitudes from 30°N to 60°N, followed by the Arctic. 2.2.Sensitivity of AIRS Retrieval2.2.1.Algorithm for concentration retrievalThe AIRS is a high-spectral-resolution spectrometer with 2378 bands in the thermal IR (3.7 to 15.4 μm) and 4 bands in the visible wavelengths (0.4 to 1.0 μm). Data from the AIRS and its companion instrument, the Advanced Microwave Sounding Unit (AMSU), are combined to eliminate the effects of clouds.19 The resulting AIRS Level 2 products include these cloud-cleared IR radiances and retrieved profiles of atmospheric temperature, water vapor, and with a nominal spatial resolution of 45 km at nadir. The AIRS/AMSU/Humidity Sounder for Brazil (HSB) instrument suite is constructed to obtain atmospheric temperature profiles to an accuracy of 1 K for every 1-km layer in the troposphere and 1 K for every 4-km layer in the stratosphere up to an altitude of 40 km. The accuracy of the temperature profile in the troposphere matches that achieved by radiosondes launched from ground stations. In conjunction with the temperature profiles, the AIRS instrument suite obtains water vapor profiles to an accuracy of 20% in the 2-km layer of the lower troposphere and to an accuracy of 20% to 60% in the upper troposphere.20 The tropospheric products released by the AIRS project through the Goddard Earth Sciences Data and Information Services Center (GES DISC) are derived by means of the vanishing partial derivatives (VPDs) method of Chahine et al.8 The VPD method is based on the Gauss method for finding a local minimum on an -dimensional surface. The Gauss method is based on a general property of the total differential of a multivariate function: at the point of a local minimum (or maximum), the first partial derivatives of the function with respect to each unknown must individually vanish. The VPD solution is obtained by an iterative process that minimizes the RMS difference between the Level 2 cloud-cleared radiances and the forward-computed radiances from the Level 2 profiles retrieved for selected channels in the 15-μm band. The process begins with the AIRS Level 2 atmospheric state and climatology and then separately perturbs the temperature, water vapor, , and . The solution is obtained at the point where the partial derivatives of the channels with respect to temperature, water vapor, , and are individually equal to zero (minimized). Evaluation of the relative sensitivity of each channel to temperature, water vapor, , and leads to the choice of the spectral range used in the VPD retrieval. The range 690 to is well suited for selecting the channel set to retrieve the mixing ratio.17 Table 1 summarizes the IR channels whose cloud-cleared radiances are used in the VPD retrieval of tropospheric . An evaluation of the sensitivity of the retrieval to temperature, water vapor, and can help us to understand the sources of retrieval errors. Table 1List of channels used for the vanishing partial derivatives iterative solution.
2.2.2.Sensitivity of concentration retrievalRadiance measurements from the space in a absorption band can reflect the total column. Variations in the vertical temperature profile, the water vapor profile, and the distribution of interfering gases as the satellite instrument moves will add uncertainties to the measurements.1 To study the effects of these variations on the retrieval of columns, the AIRS measurements are simulated in the spectral range 690 to . The strong emission band at 15 μm is used to derive atmospheric temperature profiles, with the assumption that the concentration throughout the atmosphere is fixed. The sensitivity of space-observed radiance to emission temperature in this band is much greater than the sensitivity to the concentration. In addition, water vapor and the column cause significant interference within this band. The radiative transfer model used for atmospheric absorption in this study is called the line-by-line radiative transfer model (LBLRTM).21 The LBLRTM is an accurate, efficient, and well-established line-by-line algorithm that is widely used in studies of atmospheric radiation and remote sensing to validate band models, generate fast-forward models in retrieval processes, and simulate radiance for high-spectral-resolution sensor designs. The high-resolution transmission molecular absorption database is used as input to the LBLRTM.22 The Voigt profile is used for absorption line shapes to include both collisional- and Doppler-broadening processes throughout the column of the atmosphere. Models of five standard atmospheres are used for atmospheric profiles with extensions to 100 km.23 The atmospheric radiance in the spectral range 690 to is shown in Fig. 2(a). The baseline atmospheric mixing ratio is set to 380 ppmv, and the satellite view is set to nadir. Fig. 2Radiance at different spectral resolutions under five different standard atmospheric models: (a) all standard atmospheric models, (b) tropical, (c) midlatitude summer, (d) midlatitude winter, (e) subarctic summer, and (f) subarctic winter.  According to the accuracies of the AIRS products, the temperature profiles have an accuracy of 1 K for every 1-km layer, the atmospheric water vapor profile has an accuracy of 20% in 2-km layers, and there are 10% errors in the column. Based on the error quantification presented here, the change produced in the measured radiance by these errors is compared with the change in the concentration. Then the maximum uncertainty in the retrieved concentration is produced by these errors under the five standard atmospheric models. 3.Results3.1.Spectral ResolutionA scanning function is used, which can simulate the slit function of a grating spectrometer to convolve the monochromatic radiances calculated line-by-line. The radiance measurement of the reflected IR wavelength at high spectral resolution results in a high sensitivity to atmospheric change. Thus, a balance in the spectral resolution and the radiance sensitivity is required of instrumentation for measurements. The effects of spectral resolution on radiance and radiance sensitivity are presented in Figs. 2(b)–2(f), from the highest possible resolution of the model (, black lines) to the spectral resolution of AIRS (, colored lines). The results show that the AIRS resolution, unlike the model resolution, is adequate for spectral features, can maintain a moderate radiance level, and has good radiance sensitivity. 3.2.Radiance Sensitivity for ChangeAltitude has an important effect on the absorption linewidth through pressure broadening.15 Figure 3 shows the change produced in the measured radiance by a 1 ppmv increase in the concentration in each 1-km layer of the atmosphere. The measured radiance decreases with a 1-ppmv increase in the concentration because the transmittance decreases as the concentration increases. Furthermore, the vertical sensitivity calculated for a 1-ppmv increase in each 1-km layer is shown in Fig. 4 for the 13 AIRS channels used in the NOAA retrievals under the five different standard atmospheric models. The AIRS mid-troposphere is well mixed, because the channels used for retrieval are sensitive to altitudes of , which provide the strongest contributions to the measured radiance. The changes in radiance are mainly caused by the variations in atmospheric concentration at altitudes of 20 km or less. Fig. 3Jacobians for a 1-ppmv layer perturbation under five different standard atmospheric models: (a) tropical, (b) midlatitude summer, (c) midlatitude winter, (d) subarctic summer, and (e) subarctic winter. 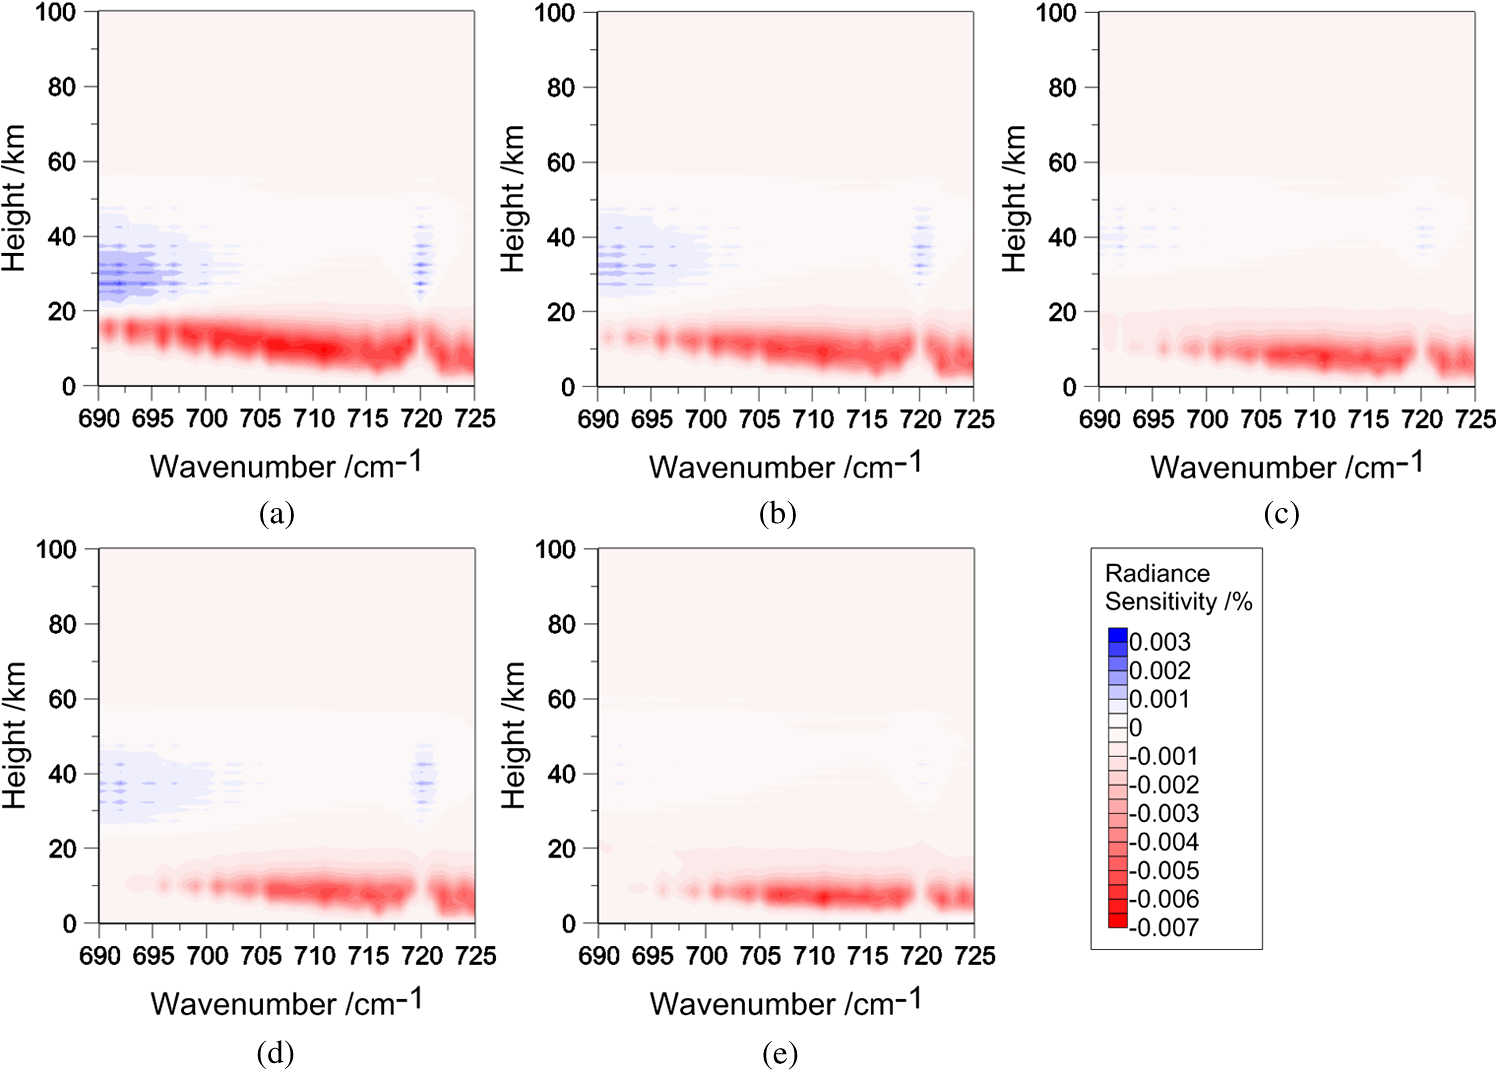 Fig. 4Jacobians for a 1-ppmv layer perturbation for the 13 AIRS channels used in the National Oceanic and Atmospheric Administration (NOAA) retrievals under five different standard atmospherics models: (a) tropical, (b) midlatitude summer, (c) midlatitude winter, (d) subarctic summer, and (e) subarctic winter.  Moreover, the AIRS weighting functions have a tail that extends into the stratosphere, especially in the polar regions, where the tropopause is lower. The stratospheric air is colder than that of the troposphere by an amount that varies with latitude.24–28 As can be observed in Fig. 4, an increase in latitude produces a negative change in radiance sensitivity. Additionally, the radiance sensitivity is greater in summer than in winter. Overall, greater radiance sensitivity leads to a more precise retrieval of the concentration data. The change in the measured radiance was also calculated for a 1-ppmv increase in the column for the 13 AIRS channels used in the NOAA retrievals under the five different standard atmospheric models. The results include the variance and sensitivity of the upwelling radiance at the top of the atmosphere, as shown in Table 2. The band at is particularly sensitive in all five standard atmospheric models, and the maximum value of the radiance sensitivity is 0.078%. Comparing the values of radiance sensitivity under the five standard atmospheric models, it can be seen that an increase in latitude corresponds to a decrease in radiance sensitivity, whereas the radiance sensitivity is greater in summer than in winter. Table 2Variations and sensitivities of measured radiance for a 1-ppmv CO2 change in five different standard atmospheres.
3.3.Temperature DependenceTemperature greatly affects the absorption coefficient in terms of line strength, line shape, and even line position. Thus, the amount of back-to-space radiance in the IR greatly depends on the atmospheric temperature, even though the dependence is much weaker than in the bands for temperature profile retrieval.15 The AIRS/AMSU/HSB instrument suite is able to measure atmospheric temperature profiles to an accuracy of 1 K for every 1-km layer in the troposphere and 1 K for every 4-km layer in the stratosphere up to an altitude of 40 km. In this study, a 1-K temperature deviation was added to each layer of the five standard atmospheric models. Such a deviation is likely for temperature profile retrieval errors when matching the observed radiances with computed radiances. Figure 5 shows the radiance changes in percent for the 13 AIRS channels used in the NOAA retrievals after the 1-K temperature error was introduced into the temperature profile under the five standard atmospheric models. The overall influence of the temperature retrieval error is , which is significantly smaller than the change due to a 1% change. Fig. 5Temperature Jacobians for a 1-K layer perturbation for the 13 AIRS channels used in the NOAA retrievals under five different standard atmospheric models: (a) tropical, (b) midlatitude summer, (c) midlatitude winter, (d) subarctic summer, and (e) subarctic winter.  The channels used for retrieval are sensitive to altitudes of , which provide the strongest contributions to the measured radiance. These altitudes are similar to those of the radiance sensitivity, resulting in a greater interference for concentration retrieval. The band is the most sensitive, but the change produced in the measured radiance by a temperature increase of 1 K is negligible above 40 km in the atmosphere. Furthermore, the tropical and subarctic regions have greater radiance sensitivity than the midlatitude areas, while the radiance sensitivity at each latitude is greater in winter than in summer because of the seasonal dependence, especially in the subarctic region. Figure 6 shows the variations in measured radiance caused by temperature errors (top curve) and the change in concentration (bottom curve) under the five standard atmospheric models. It can be observed that the change in the measured radiance is a function of the 1-K increase in each 1-km layer of the atmosphere. In the troposphere, the measured radiance is more sensitive to temperature changes. As observed in Fig. 6, the maximum sensitivity to a 1-K change in each 1-km layer of the atmosphere is approximately three times the sensitivity to a 1-ppmv change in . If the curves in Fig. 6 are integrated and compared with the column sensitivities (Table 2), a 1-K decrease in the atmospheric temperature over the entire profile is found to produce a change in measured radiance comparable with that produced by a 1% increase in the concentration (listed in Table 3 for all channels). Fig. 6Variations in radiance caused by measured temperature errors (top curve) and the change in concentration (bottom curve) under five different standard atmospheric models: (a) tropical, (b) midlatitude summer, (c) midlatitude winter, (d) subarctic summer, and (e) subarctic winter.  Table 3Uncertainty in CO2 retrieval caused by temperature, water vapor, and O3 errors under five different standard atmospheres.
In summary, an analysis of the sources of uncertainty in the proposed radiometer was performed. The analysis shows that the most important potential source of error is uncertainty in the temperature profile. The maximum sensitivity to temperature, at 3.82 ppmv, is found in the band. This value is at least 1-ppmv higher than those in other bands. Moreover, higher latitude leads to more serious temperature interference. The effect that temperature error has on the retrieval is less in summer than in winter at the same latitude. Therefore, a good knowledge of the atmospheric temperature profile is required as ancillary data in retrieval. 3.4.Water Vapor InterferenceWater vapor has only slight absorption in the band 690 to , which requires attention when channels are selected for retrieval. Fortunately, most of the water vapor line centers in this band are not aligned with the line centers. The calculated difference in sensitivity between atmospheres with and without water vapor is negligible for most lines. However, atmospheric water vapor can significantly modify air density, reinforcing the abovementioned requirement for dry-air surface pressure measurements. However, for some wet-summer areas, such as the tropics and midlatitudes, major interference from highly variable atmospheric water vapor is a great concern for this IR band. Figure 7 shows that the lowest layers of the atmosphere provide the strongest contributions to the measured radiance. The band is the most sensitive, and most of the change in radiance is contributed by the variation in the water vapor concentration of the atmosphere below 15 km. Fig. 7Water vapor Jacobians for a 20% layer perturbation for the 13 AIRS channels used in the NOAA retrievals under five different standard atmospheric models: (a) tropical, (b) midlatitude summer, (c) midlatitude winter, (d) subarctic summer, and (e) subarctic winter.  Although this spectral interval was chosen partly to reduce the interference of water vapor in the measured radiances, such interference remains a significant factor in the retrieval of concentrations. The proposed measurement of atmospheric water vapor has an accuracy of 20% every 2-km layers. Figure 8 shows the fractional change in the measured radiance as a function of a 20% relative humidity decrease in each 2-km layer of the atmosphere, with respect to a standard relative humidity profile. The fractional changes in the measured radiance are for the midlatitude winter and the subarctic region. Given this level of sensitivity to water vapor, the maximum errors for a measurement precision of 0.5% are , 2.63, 0.85, 1.36, and 0.12 ppmv for the tropics, midlatitude summer, midlatitude winter, subarctic summer, and subarctic winter, respectively (see Table 3). In relative terms, lower latitude areas have greater uncertainty than higher latitude areas, and summer has greater uncertainty than winter for a given latitude. Fig. 8Variations caused by water vapor errors from observation under five standard atmospheric models: (a) tropical (b) midlatitude summer, (c) midlatitude winter, (d) subarctic summer, and (e) subarctic winter.  For water vapor, the column sensitivity is greatly determined by seasonal dependence, which is mostly a result of higher densities because of the greater amounts of water vapor in the atmosphere. However, the uncertainty for concentration retrieval is generally in summer and in winter. 3.5.InterferenceInterference in the measured radiance due to is a significant factor in the process of retrieval. The radiance measured for the reflected IR wavelength results in a high sensitivity to change. Comparisons with radiosonde data have shown for the AIRS observations that such interference leads to errors as sizeable as in the column of the stratosphere and yields an accuracy of 20% to 70% for the troposphere. The product of the AIRS has a bias of to compared with that of the total ozone mapping spectrometer.29–31 The sensitivity of the measured radiance to the profile is presented in Fig. 9. Fig. 9Jacobians for a 10% layer perturbation for the 13 AIRS channels used in the NOAA retrieval under five different standard atmospheric models: (a) tropical, (b) midlatitude summer, (c) midlatitude winter, (d) subarctic summer, and (e) subarctic winter.  The channels used for retrieval are sensitive to stratospheric altitudes of to 30 km, which provide the strongest contributions to the measured radiance. These altitudes are much greater than those of the radiance sensitivity, but the measured radiance produces fractional change by a 10% decrease of in each 1-km layer of the atmosphere above 60 km. Tropical areas have greater radiance sensitivity than higher latitude areas, and the radiance sensitivity at each latitude is greater in winter than in summer because of the seasonal dependence, especially in the subarctic region. In these IR channels, the sensitivity of measured radiance exhibits a 0.016% change by variation of concentration (a reasonable level of variation in over the globe). Given this level of sensitivity, the maximum errors in concentration for measurements are , 2.20, 3.01, 1.98, and 3.17 ppmv, respectively (see Table 3). Another source of error is spectral interference from in the band. This interference has a minimal value of 1.69 ppmv in the tropics, and then increases to 3.17 ppmv when coupled with higher latitude areas and seasonal dependence. The value of the uncertainty is 1-ppmv higher in winter than in summer at the same latitude. In summary, the three factors of temperature, , and water vapor have great influences on the sensitivity of atmospheric retrieval from the AIRS observations. In particular, the most important factor in the tropics is water vapor, while temperature represents major interference for midlatitude and subarctic regions. Moreover, the maximum error in retrieval occurs for mid latitude regions under summer conditions. 4.ConclusionsThe global sensitivity of atmospheric retrieval from the AIRS observations was investigated to quantify the largest error source at the IR wavelengths for global and regional carbon-cycle studies. To fully resolve the line features and obtain maximum radiance sensitivity, the results were calculated using the LBLRTM and presented at spectral resolution , which is the typical linewidth of at standard temperature and pressure. The results show that temperature, , and water vapor are important factors, which have great influences on the sensitivity of atmospheric retrieval from the AIRS observations. Specifically, the water vapor is the most important factor in the tropics, whereas the temperature represents major interference for midlatitude and subarctic regions. Moreover, the maximum error caused by temperature, water vapor, and data in retrieval occurs for midlatitude regions under summer conditions. The findings are in good agreement with those from the ground-based validation of the AIRS products. Therefore, precise measurements of the water vapor profile, access to data, and good knowledge of the atmospheric temperature profile are important to reduce errors, especially in the retrieval for midlatitude regions. AcknowledgmentsThis project was supported by the National Basic Research Program of China (No. 2010CB951603) and the Shanghai Science and Technology Support Program—Special for Expo (No. 10DZ0581600). The computation was supported by the High Performance Computer Center of East China Normal University. ReferencesB. T. ToltonD. Plouffe,
“Sensitivity of radiometric measurements of the atmospheric column from space,”
Appl. Opt., 40
(9), 1305
–1313
(2001). http://dx.doi.org/10.1364/AO.40.001305 APOPAI 0003-6935 Google Scholar
C. CrevoisierA. ChedinN. A. Scott,
“AIRS channel selection for and other trace-gas retrievals,”
Q. J. Roy. Meteorl. Soc., 129
(593), 2719
–2740
(2003). http://dx.doi.org/10.1256/qj.02.180 QJRMAM 0035-9009 Google Scholar
F. CaylaP. Javelle,
“IASI instrument overview: advanced and next-generation satellite,”
Proc. SPIE, 2583 271
–281
(1995). http://dx.doi.org/10.1117/12.228572 PSISDG 0277-786X Google Scholar
M. Buchwitzet al.,
“Carbon monoxide, methane and carbon dioxide columns retrieved from SCIAMACHY by WFM-DOAS: Year 2003 initial data set,”
Atmos. Chem. Phys., 5
(12), 3313
–3329
(2005). http://dx.doi.org/10.5194/acp-5-3313-2005 ACPTCE 1680-7324 Google Scholar
A. Kuzeet al.,
“Thermal and near infrared sensor for carbon observation Fourier-transform spectrometer on the greenhouse gases observing satellite for greenhouse gases monitoring,”
Appl. Opt., 48
(35), 6716
–6733
(2009). http://dx.doi.org/10.1364/AO.48.006716 APOPAI 0003-6935 Google Scholar
D. Crispet al.,
“The orbiting carbon observatory (OCO) mission,”
Adv. Space Res., 34
(4), 700
–709
(2004). http://dx.doi.org/10.1016/j.asr.2003.08.062 ASRSDW 0273-1177 Google Scholar
M. T. Chahineet al.,
“Satellite remote sounding of mid-tropospheric ,”
Geophys. Res. Lett., 35 L17807
(2008). http://dx.doi.org/10.1029/2008GL035022 GPRLAJ 0094-8276 Google Scholar
M. Chahineet al.,
“On the determination of atmospheric minor gases by the method of vanishing partial derivatives with application to ,”
Geophys. Res. Lett., 32 L22803
(2005). http://dx.doi.org/10.1029/2005GL024165 GPRLAJ 0094-8276 Google Scholar
A. A. Alkhaledet al.,
“A global evaluation of the regional spatial variability of column integrated distributions,”
J. Geophys. Res.: Atmos., 113
(D20),
(2008). http://dx.doi.org/10.1029/2007JD009693 JGRDE3 0148-0227 Google Scholar
R. J. Engelenet al.,
“Global observations of the carbon budget: 1 Expected satellite capabilities for emission spectroscopy in the EOS and NPOESS eras,”
J. Geophys. Res., 106
(D17), 20055
–20068
(2001). http://dx.doi.org/10.1029/2001JD900223 JGREA2 0148-0227 Google Scholar
R. J. EngelenA. P. McNally,
“Estimating atmospheric from advanced infrared satellite radiances within an operational four-dimensional variational (4D-Var) data assimilation system: results and validation,”
J. Geophys. Res., 110
(18), D18305
(2005). http://dx.doi.org/10.1029/2005JD005982 JGREA2 0148-0227 Google Scholar
R. J. EngelenS. SerrarF. Chevallier,
“Four-dimensional data assimilation of atmospheric using AIRS observations,”
J. Geophys. Res., 114
(3), D03303
(2009). http://dx.doi.org/10.1029/2008JD010739 JGREA2 0148-0227 Google Scholar
E. S. Maddyet al.,
“ retrievals from the atmospheric infrared sounder: methodology and validation,”
J. Geophys. Res., 113
(11), D11301
(2008). http://dx.doi.org/10.1029/2007JD009402 JGREA2 0148-0227 Google Scholar
L. L. StrowS. E. Hannon,
“A 4-year zonal climatology of lower tropospheric derived from ocean-only atmospheric infrared sounder observations,”
J. Geophys. Res., 113
(18), D18302
(2008). http://dx.doi.org/10.1029/2007JD009713 JGREA2 0148-0227 Google Scholar
J. MaoS. R. Kawa,
“Sensitivity studies for space-based measurement of atmospheric total column carbon dioxide by reflected sunlight,”
Appl. Opt., 43
(4), 914
–927
(2004). http://dx.doi.org/10.1364/AO.43.000914 APOPAI 0003-6935 Google Scholar
I. AbenO. HasekampW. Hartmann,
“Uncertainties in the space-based measurements of columns due to scattering in the Earth’s atmosphere,”
J. Quant. Spectrosc. Radiat. Transfer, 104
(3), 450
–459
(2007). http://dx.doi.org/10.1016/j.jqsrt.2006.09.013 JQSRAE 0022-4073 Google Scholar
H. MatsuedaH. Y. InoueM. Ishii,
“Aircraft observation of carbon dioxide at 8–13 km altitude over the western Pacific from 1993 to 1999,”
Tellus, Ser. B, 54
(1), 1
–21
(2002). http://dx.doi.org/10.1034/j.1600-0889.2002.00304.x TSBMD7 0280-6509 Google Scholar
W. BaiX. ZhangP. Zhang,
“Temporal and spatial distribution of tropospheric over China based on satellite observations,”
Chin. Sci Bull., 55
(31), 3612
–3618
(2010). http://dx.doi.org/10.1007/s11434-010-4182-4 CSBUEF 1001-6538 Google Scholar
H. H. Aumannet al.,
“AIRS/AMSU/HSB on the aqua mission: design, science objectives, data products, and processing systems,”
IEEE Trans. Geosci. Remote Sens., 41
(2), 253
–264
(2003). http://dx.doi.org/10.1109/TGRS.2002.808356 IGRSD2 0196-2892 Google Scholar
E. T. Olsen, AIRS/AMSU/HSB Version 5 Data Release User Guide, Jet Propulsion Laboratory, California Institute of Technology, Pasadena, California
(2007). Google Scholar
S. A. Cloughet al.,
“Atmospheric radiative transfer modeling: a summary of the AER codes, Short Communication,”
J. Quant. Spectrosc. Radiat. Transfer, 91
(2), 233
–244
(2005). http://dx.doi.org/10.1016/j.jqsrt.2004.05.058 JQSRAE 0022-4073 Google Scholar
L. S. Rothmanaet al.,
“Rayleigh-scattering calculations for the terrestrial atmosphere,”
Appl. Opt., 34
(15), 2765
–2773
(1995). http://dx.doi.org/10.1364/AO.34.002765 APOPAI 0003-6935 Google Scholar
A. Bucholtz,
“The HITRAN 2008 molecular spectroscopic database,”
J. Quant. Spectrosc. Radiat. Transfer, 110
(9–11), 533
–572
(2009). http://dx.doi.org/10.1016/j.jqsrt.2009.02.013 JQSRAE 0022-4073 Google Scholar
E. T. Olsen, AIRS Version 5 Release Tropospheric CO2 Products, Jet Propulsion Laboratory, California Institute of Technology, Pasadena, California
(2009). Google Scholar
K. A. Boeringet al.,
“Stratospheric mean ages and transport rates from observations of carbon dioxide and nitrous oxide,”
Science, 274
(5291), 1340
–1343
(1996). http://dx.doi.org/10.1126/science.274.5291.1340 SCIEAS 0036-8075 Google Scholar
D. WaughT. Hall,
“Age of stratospheric air: theory, observations, and models,”
Rev. Geophys., 40
(4), 1
–26
(2002). http://dx.doi.org/10.1029/2000RG000101 REGEEP 8755-1209 Google Scholar
C. G. Morganet al.,
“Isotopic fractionation of nitrous oxide in the stratosphere: Comparison between model and observations,”
J. Geophys. Res., 109
(4), D04305
(2004). http://dx.doi.org/ 10.1029/2003JD003402 JGREA2 0148-0227 Google Scholar
R. L. Shiaet al.,
“ in the upper troposphere: influence of stratophere-troposphere exchange,”
Geophys. Res. Lett., 33
(1), L14814
(2006). http://dx.doi.org/10.1029/2006GL026141 GPRLAJ 0094-8276 Google Scholar
K. Bramstedtet al.,
“Comparison of total ozone from the satellite instruments GOME and TOMS with measurements from the dobson network 1996–2000,”
Atmos. Chem. Phys. Discuss., 3
(5), 1409
–1419
(2003). http://dx.doi.org/10.5194/acpd-2-1131-2002 1680-7367 Google Scholar
E. Fetzer, Validation of AIRS/AMSU/HSB Core Products for Data Release Version 3.0, Jet Propulsion Laboratory, California Institute of Technology, Pasadena, California
(2003). Google Scholar
G. Griecoet al.,
“IMG retrieval and comparison with TOMS/ADEOS columnar ozone: an analysis based on tropical soundings,”
J. Quant. Spectrosc. Radiat. Transfer, 95
(3), 331
–348
(2005). http://dx.doi.org/10.1016/j.jqsrt.2004.11.016 JQSRAE 0022-4073 Google Scholar
BiographyMandi Zhou received her PhD from East China Normal University in 2013. She received her BS and MS in information and computing science from China University of Geosciences in 2006 and 2009, respectively. Her research interests include hyperspectral remote sensing and image processing. Jiong Shu is currently a professor of climatology at the Key Laboratory of Geographic Information Science, East China Normal University. He received his MS and PhD from East China Normal University. He was an honor research fellow at the University of Liverpool, UK, in 1999, after which he was employed as a professor at the College of Resources and Environmental Science, East China Normal University, in 2000. His research interests include climate change and environmental remote sensing. Ci Song is a PhD candidate at East China Normal University. She received her BS from Henan Normal University in 2008 and MS in mathematics and applied mathematics from East China Normal University in 2011. Her research interests include differential equations and atmospheric remote sensing. Wei Gao is a Changjiang scholar lecturing professor of the College of Resources and Environmental Science, East China Normal University, and professor in the Department of Ecosystem Science and Sustainability, Colorado State University. He received his PhD from Purdue University and had his postdoctoral training at the National Center for Atmospheric Research. His research interests include atmospheric radiation, remote sensing applications, regional climate/ecosystem modeling, geographic information systems. He is a fellow of SPIE. |
|||||||||||||||||||||||||||||||||||||||||||||||||||||||||||||||||||||||||||||||||||||||||||||||||||||||||||||||||||||||||||||||||||||||||||||||||||||||||||||||||||||||||||||||||||||||||||||||||||||||||||||||||||||||||||||||||||||||||||||||||||||||||||||||||||||||||||||||||||||||||||||||||||||||||||||||||||||||||||||||||||||||||||||||||||||||||||||||||||||||||||||||||||||||||||||||||||||||||||||||||||||||||||||||||||||||||||||||||||||||||||||||||||||||||||||||||||||||||||||||||||||||||||||||||||||||||||||||||||||||||||||||||||


