|
|
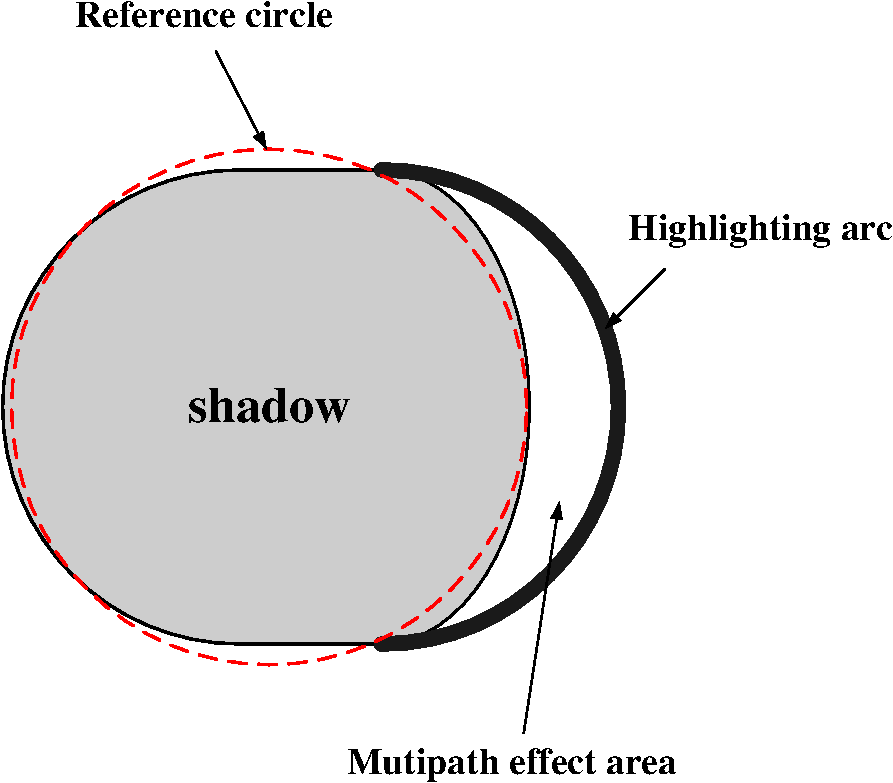
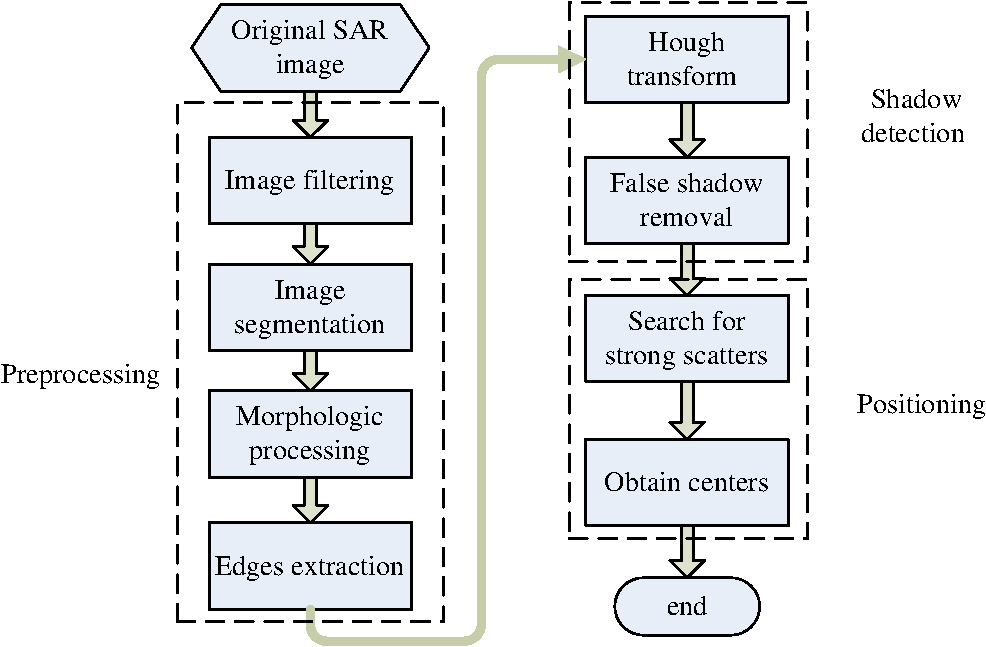
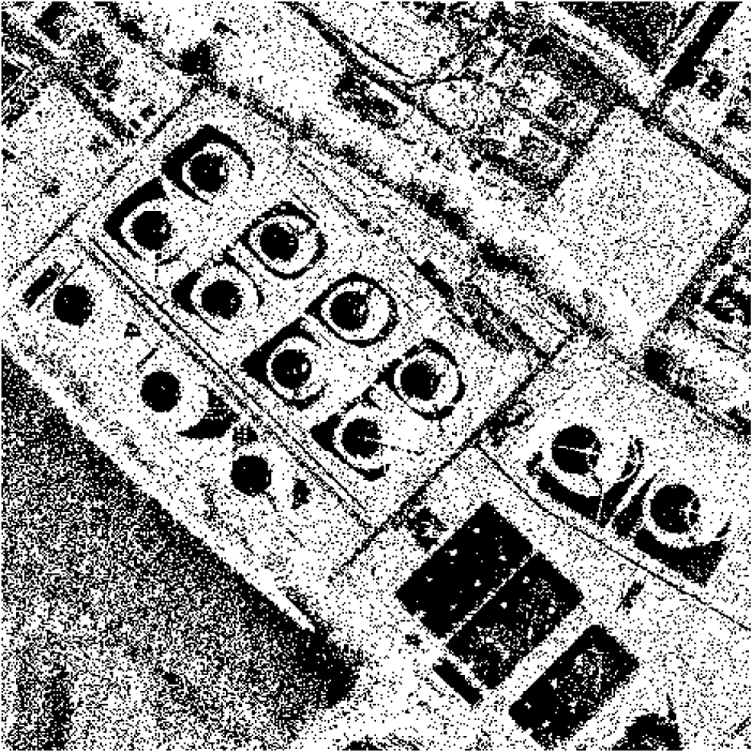
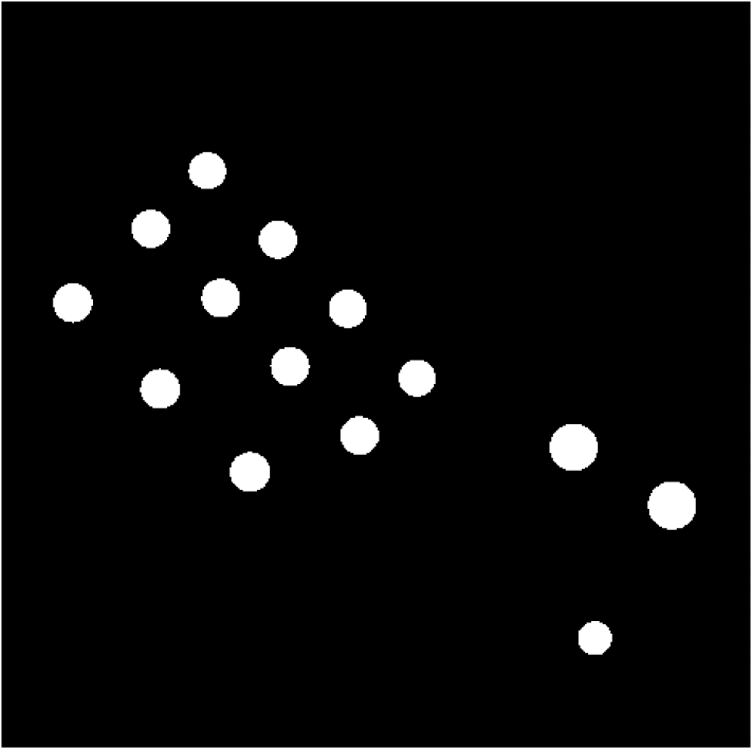
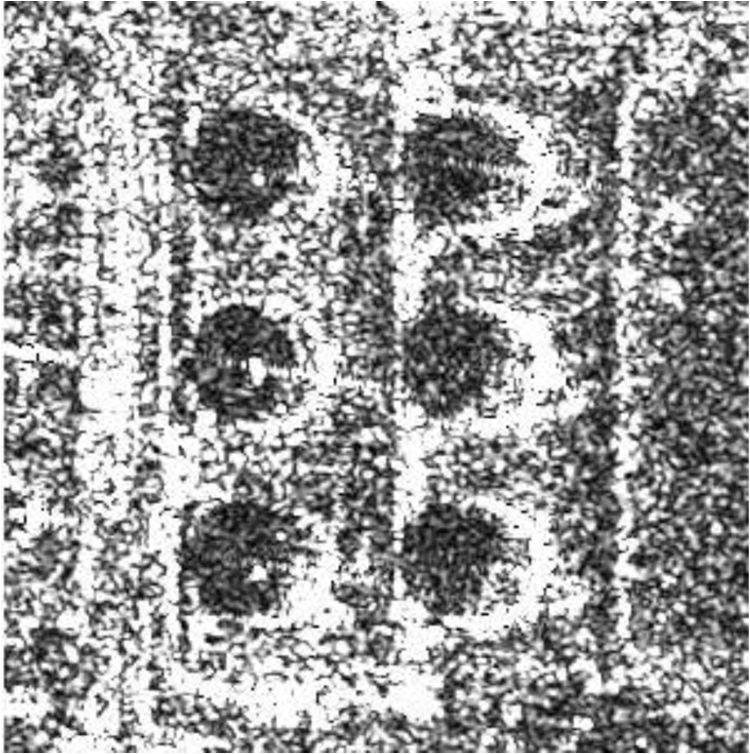
1.IntroductionOil tanks play an important role in both military and civilian aspects. Destruction of oil tanks could severely affect a military operation’s success. The flexibility of armies will be badly deteriorated once they are destroyed. Oil tanks contain large amounts of inflammable chemical liquids, so they should be put under surveillance. Therefore, oil tank detection is a topic of great significance in remote sensing supporting military operations. Methods of oil tank detection for optical images are all based on the fact that oil tanks appear as perfect circular areas in optical images. Hough transform1,2 is one of the classic methods of detecting circular targets or arcs. But it has some disadvantages, including heavy calculation, high occupation of memory, low running speed, and so on. The other methods are developed by taking advantage of the geometry features of the circle and cost less time and money. Ho and Chen3 and Yi and Pei-Jun4 proposed a fast circle detection method by using the geometric symmetry of the circles. Chen and Li5 presented an automatic recognition method to detect quasi-circular oil tanks by using the parameters of area, posture ratio, and rectangle tolerance. Those methods can only apply to targets that have a regular circle shape and cannot be suitable for targets with arc edges. Synthetic aperture radar (SAR), a microwave imaging sensor, can work in all day and all weather. It has been developed to one of the most popular sensors for remote sensing.6 But there are few documents available to address oil tanks detection in the SAR imagery. Guida et al.7 extracts the features of oil tanks in TerraSAR-X image. Zhang et al.8 analyzes the scattering characteristics of the tanks in SAR images and establishes the scattering model. The difficulty for oil tanks detection in SAR imagery may result from three aspects. First, false alarm will happen badly while using low-resolution SAR images. Second, it is difficult to find out complete circular shapes in SAR images. Third, it is hard to extract the tanks’ scattering characteristics in SAR imagery. In general, a highlighting arc caused by the double reflection exists exactly at the bottom of each cylinder tank in an SAR image. However, it is very difficult to detect those arcs directly. Additionally, each cylinder tank has a quasi-circular shadow area in SAR image, which is near the highlighting arc and is easy to be detected. This article proposes a new method to detect the oil tanks in SAR images with both the quasi-circular shadow and highlighting arcs features. The new method is implemented by three steps as follows. First, the original SAR image is preprocessed, including noise filtering, image segmentation and morphologic processing. A progressed method is proposed to quantize the SAR image for image segmentation. Second, the quasi-circular shadow areas of the tanks are detected with Hough transform. Third, strong scattering points in the highlighting arc are found around the shadow areas and the edges of the detected circles are shifted to the position of their corresponding strong scattering points. 2.Tank Scattering CharacteristicsA cylindrical tank is composed of a cylindrical wall and a top (see Fig. 1). In Fig. 1, denotes the diameter of the tank and represents the height. Usually, the diameter of the cylindrical tank is bigger than its height, and the ratio of diameter to height should be no . Since the tanks are perpendicular to the ground, shadows will appear on the ground according to Ref. 9. Ignoring the multipath effect, the formation of the shadow is illustrated in Fig. 2(a). In the figure, EF and DG are tangent lines of the side wall with the illumination direction. Assuming that radar signals come from the upper right with the incident angle , the shadow area will be at half of an ellipse as arc MNQ, the cylinder wall will form a rectangular shadow area as rectangle DEMQ and the bottom of the tank will be completely overlapped. The total shadow area of the tank is marked by the red dotted line in Fig. 2(a). Fig. 2Shadow area without multipath effect: (a) Formation of the shadow area; (b) shadow area with and .  With the geometric relationship shown in Fig. 2(a), we can know that Then With , , the shadow area is illustrated in Fig. 2(b), where represents the radius of the tank and . Shadow area will change when taking a multipath effect10 into account, which results from double reflection and multiple reflection. When the transmitted radar signals are reflected twice before finally reaching the receiver,11,12 double reflection occurred, as Fig. 3(a). If the ground is rough compared to the wavelength of the radar, the rays will reflect to the ground after reaching the surfaces of the cylinders and will scatter back to the radar. Both path [the dashed line in Fig. 3(a)] and [the dot-dashed line in Fig. 3(a)] are double reflection. Path represents the single reflection from the intersection of the bottom and the ground. When the distance of path , , and are equal, the echoes from , , and will fall in the same pixel in SAR images. The intensity of that pixel is larger than the others, so that a highlighting curve is formed as the semicircle DBE. According to Ref. 8, the intensity value of point will be maximum in the curve, thus a strong scatterer is formed. The highlighting curve caused by double reflection is marked with the red arc in a real SAR image shown in Fig. 3(b). Double reflection has no influence on the geometric features of shadows and the position of the highlighting curve formed by double reflection represents the real location of the tank in SAR image such as the semicircle DBE. Multiple reflection is much more complicated than the double reflection, and it has significant impact on the shadow areas. There are various types of multiple reflection. For example, a kind of triple reflection is shown in Fig. 4(a), where rays illuminated to the cylinder surfaces first reflect to the ground, then scatter back toward the wall and finally reflect to the receiver. Comparing Figs. 4(a) to 3(a), we can find that the distance of triple reflection is bigger than the distance of the double reflection. So, the SAR signals from multiple reflection will be mapped into the inner semicircle of DBE. Multiple reflection area is marked with the moon-shaped red curve in Fig. 4(b) for a real SAR image. With the multipath effect, the shadow shown in Fig. 2(b) will change to the gray area as shown in Fig. 5, where the dotted red circle is a reference circle and the moon-shaped white area represents the multipath effect region. On the right next to the white region, a highlighting arc caused by the double reflection is illustrated by the bold curve. As shown in Fig. 5, the shape of a shadow region looks like a circle and the radius of the reference circle looks similar to that of the tank. A real SAR image with a tank shadow marked with red curve is shown in Fig. 6. The shape of a tank shadow is nearly similar to a circle, which becomes a clue to detect the tank. Sometimes, a bright circular contour may appear near the shadow shown as the dotted blue circle in Fig. 6. The contour is caused by the circular top of the tank and may divide circular shadow into several parts.7 It will lead to an incorrect detection for the shadow when using the non-Hough transform methods. 3.Novel Detection MethodAccording to the discussion above, the highlighting arcs indicate the correct location of tanks, which is a good way to detect the tanks. However, it is very difficult to detect the highlighting arcs directly. Fortunately, the shadow area nearby the highlighting curve is easily detected. In this article, we propose to find the shadow first and then detect the strong scatterers in the highlighting arcs near the shadows. Section 2 shows that the shape of the shadow areas is not a complete circle. Besides, the shadow may be divided into several parts by the contour of the circular top. So, the best way to detect the oil tanks in the SAR images is Hough transform, which is used in this article. Based on the above analysis, a novel method to detect oil tanks in the SAR images is proposed in this article. The flowchart of the proposed method is shown in Fig. 7. First, preprocessing is applied on to prepare for the Hough transform, including filtering, image segmentation, morphologic processing, and edges extraction. It is significant for SAR images to apply filter processing because of the inherent speckle noise. Lee Filter13–15 is a good choice. The filtered image is segmented because the input of the Hough transform should be the edge of a binary image. There are a lot of black holes in the white areas and many white patches in the black areas on the segmented images. Those holes and patches have to be removed due to their impacts on the continuity of the edges. Then the edges in SAR image are extracted as the input of Hough transform. Second, shadow regions are detected with Hough transform as well as the false targets are removed. Third, the strong scatterers in the highlighting arcs are searched and the edges of the detected circles are shifted to the positions of its corresponding strong scatterers. 3.1.Preprocessing3.1.1.Image filteringSpeckle noise in SAR images decreases ability of the target detection, thus noise reduction is executed by image filtering at first. Lee Filter has a good performance on noise reduction because it can preserve the edges well while reducing the speckle noise effectively. Therefore, Lee Filter is applied in our experiments and its implementation can be found in Refs. 13 to 15. 3.1.2.Image segmentationQuantification is carried out first. Strong scatterers only occupy a small part of the SAR image cells, while their intensity values are very large. Assuming the maximum intensity value as 255 for quantization, the quantized values of the majority image cells will be very small and the quantized image will be particularly dark. For example, the gray level of majority cells in the quantized image of Fig. 8 are below 5 and that of a large amount of cells are even 0 [see Fig. 9(a)]. The traditional method is to take log or square root of the intensity to improve the quantification. However, it leads to a disorganized histogram [see Fig. 9(b)] and the threshold for segmentation cannot be provided correctly with the disorganized histogram. In this article, a new quantitative approach is proposed by setting an upper threshold because the number of the strong scatterers is small while their intensity values are very big. For each cell of the image, if its intensity value is bigger than the upper threshold, then set its quantized value to be 255 directly. The histogram with this new method is shown in Fig. 9(c). Fig. 9Histogram of the SAR image: (a) Directly quantized histogram, (b) histogram with the image method being taking a log, and (c) histogram using the quantized proposed in this paper.  Our purpose is to detect shadow regions of the tanks. The intensity of the cells is very low, so the first peak of the histogram appears because of those cells. The threshold is set up as the value of the valley point between the first peak and the second peak. Let , , and be the quantized SAR image, the binary image, and the threshold respectively, then 3.1.3.Morphologic processingThere are some black holes appearing in the white regions and white patches existing in the black regions in the binary image as shown in Fig. 10. These holes and patches will burden Hough transform and worsen the shadow detection. Morphology processing is a good idea to solve the problem by applying closing operation and other operations to fill holes in the binary images. After one time closing operation, including one time expansion operation and one time erosion operation, the amount of the spots decreases and the edges become more continuous. Of course, more times close operations can be executed to get better results. However, some holes are still residual in the image even after taking the closing operation. So, the threshold comparison method is applied to fill the residual holes. The calculation of the area threshold is processed based on the minimum radius of the tank. As for the black hole, it will be filled if the hole’s area is smaller than the threshold; but no action is taken if the area is no smaller than the threshold. As for the white patches, first they are inverted to black holes by inverting image gray, second the threshold method is applied to them, and last the image gray is inverted back. 3.1.4.Edge extractionThe edges of the image after morphologic process are extracted by comparing the gray level difference of the current point with its adjacent points. A pixel in the binary image will be decided to be an edge pixel if any pixel in its adjacent region has different grey value from the grey value of this pixel. Otherwise it will be decided to be an inner pixel. 3.2.Shadow Detection3.2.1.Hough transformHough transform is applied to detect quasi-circular curves or arcs. As for an arbitrary edge point on a circle with the center and radius , the following equation is presented where .Each edge point of the image can be mapped to the parameter space with and , where is the possible minimum value of the detected radius and is the maximum value. A peak will be picked up in the parameter space as long as a circular arc occurs in the image space. Let para_max be the maximum value of the parameter space and a coefficient. Then all the points whose value are bigger than are found in the parameter space, and all the circular arcs are detected by mapping these points back to the image space. It is well known that Hough transform process requires huge memory storage space. The image is divided into several small parts in case it crashes the computer. The overlap pixels are necessary for the adjacent image parts. 3.2.2.False shadow removalWhen a bright quasi-circular area exists in the image, its circular edge will also be detected and an error occurs. Meanwhile, determines detection performance: the bigger is, the lower the rate of false alarm and the higher the rate of leakage alert. should be small enough because the rate of leakage alert should be as low as possible for military purposes. It will lead to high false alarm rates during detection (see the bottom right of Fig. 11). Gray level can be used to identify some false targets. The gray value in the shadow area is very low, and those of the majority pixels in the shadow area are 0. Let Sum be the number of points whose value is 0, the area of the detected circle and the probability of 0 in the circle, then The detected circle will be marked as a false target and be excluded if . is the threshold. 3.3.Positioning3.3.1.Search for strong scatterersThe circular regions detected by Hough transform indicate the shadows of tanks in the original SAR image. The location of the shadow is not the correct position of the tank. The highlighting arc caused by the double-reflecting should be detected to position the oil tank. But it is very difficult to find the arcs in the SAR image directly. As shown in Fig. 5, the highlighting arcs are near the detected shadows. It helps us to find the arcs or the strong scatterers on them. In our article, only one scatterer in the highlighting arc needs to be found to detect the tanks by shifting the detected shadow to the scatterer. References 7 and 8 show that a strong scatterer exits actually, such as point B in Fig. 1. The strong scatterer, the center of the shadow, and the center of the tank’s bottom are nearly in a line parallel to the range direction such as in Fig. 5. Considering the detection error of the shadow’s center, a searching region needs to be established when looking for the strong scatterers. The searching region is an overlapped area of a ring and a fan. The center of the fan and the ring is located in the center of the shadow. The fan is symmetrical about the range direction and its angle is 60 deg as shown in Fig. 12. As for the ring, the radius of the outer circle is , and the radius of the inner one is , where is the radius of the circle detected by Hough transform. By finding the point with maximum strength value in the search window, we can obtain the strong scatterer corresponding to point B depicted in Fig. 1. 3.3.2.Obtain centersFigure 13 explains a method to find the center of the real bottom after detecting the shadows and the strong scatterer. In this figure, the dotted circle denotes the circle detected by Hough transform, with the center and the radius . The real circle indicates the real bottom of the tank. Point represents the strong scatterer. Assuming be the center of the oil tank, is located in the line with the distance between and shown in Fig. 13. After the real positions of the tanks are achieved, the heights of the tanks can be estimated as shown in Fig. 14. We have where is the incident angle, is the center of the oil tank, is the center of its circular shadow, and is the range between them.4.Implementation and ResultsComputer implementation of the proposed detection method is given by using a 1400 by 1400 pixels 0.5-m resolution TerraSAR-X image in Diego Garcia region shown in Fig. 8. The binary image of Fig. 8 is provided with Lee Filter and our proposed quantizer is shown in Fig. 10. Figure 9(a) shows the directly quantized histogram, Fig. 9(b) shows the histogram with the logarithm of Fig. 8, and Fig. 9(c) is the histogram by using the quantized method proposed in this article. The upper threshold here is 10 times that of the mean value of the image. The segmentation threshold can be obtained by searching for the first valley point. The value of the first valley point in Fig. 9(c) is 13. So the shadow areas have been separated from the background and the proposed quantization method is valid. The binary image as shown in Fig. 10 is processed using morphologic operator after passing median filter. After median filtering, the binary image is morphologically processed. The result is as shown in Fig. 15(a) after taking close operation twice. Set the window size of closing operation . Fig. 15Morphological processing: (a) Binary image after closing operation and (b) image after filling holes and removing patches.  There are still some residual holes and patches in Fig. 15(a). These holes and patches are filled or removed when their area is smaller than a threshold. Here, threshold value of area is assumed 300. The result is shown in Fig. 15(b). Extracted edge of the image is shown in Fig. 16. Then the circular outlines are detected by Hough transform, as shown in Fig. 17. The parameters are here: , , , , and . The circular outlines in Fig. 17 are filled with white gray, and the result is shown in Fig. 11. Apparently, a false alarm occurs which can be seen at the lower right bottom of the image. But a false alarm does not happen when the filter proposed in this article is applied with a given threshold value 0.8 as shown in Fig. 18. Find those points that have stronger scattering characteristics in the detected circles. The result is shown in Fig. 19, where each small red circle represents a strong scattererer with a deviation of nearly 20 pixels to its corresponding shadow area. The edge of the circle is shifted to its corresponding strong scattering point as is shown in Fig. 20. Green numbers represent the order number of the oil tanks. Since tanks 12 and 13 in Fig. 20 cannot be detected in optical images (see Fig. 21), the numbers are disordered for better comparison with the optical images. Parameters of the detected tanks are listed in Table 1. In this table, and are the row and column indexes of the tanks in the SAR image. Table 1Parameters of the tanks.
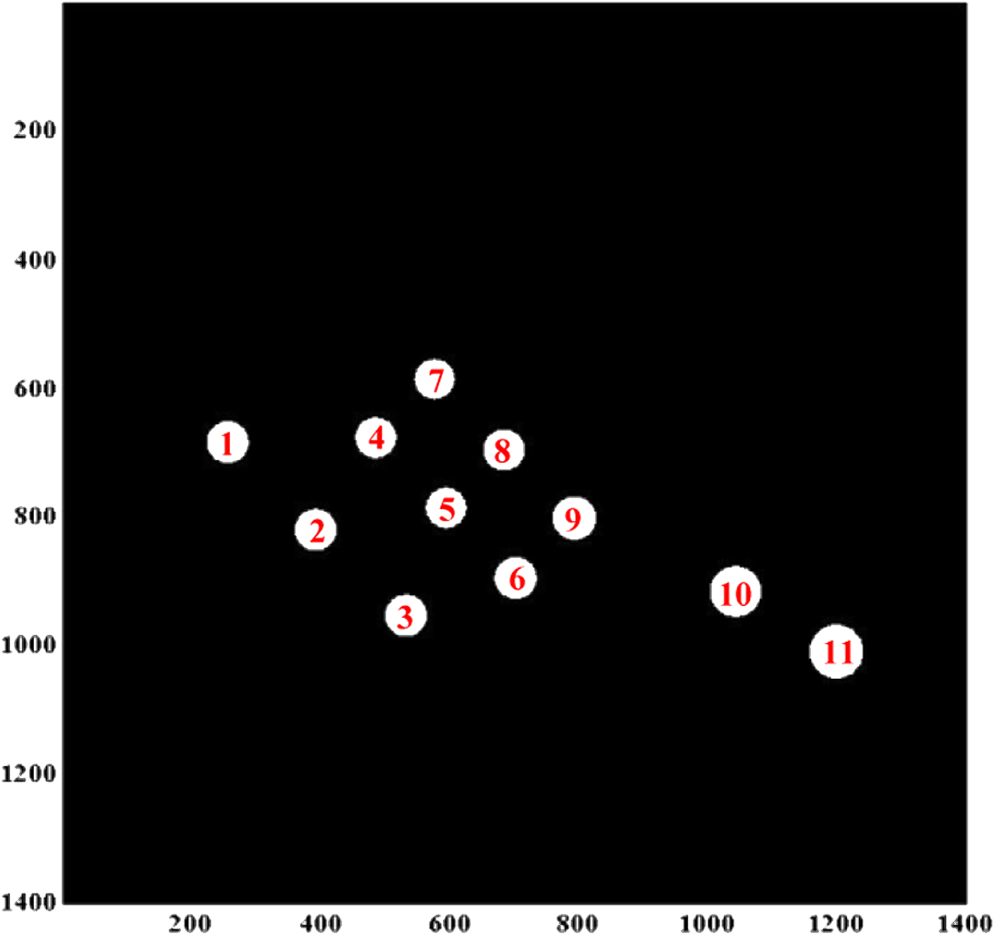
To validate the proposed method quantificationally, an optical image of the same field with the SAR image in Fig. 8 has been added. Oil tanks in the optical image have been detected and then we get the distance between every two oil tanks. The distance detected from the optical image is looked as a ruler to measure the locating precision of our tanks detection method for SAR image. Figure 22 shows a 1400 by 1400 pixels optical image with the resolution 0.6 m in Diego Garcia region from Google Earth. After filtering and filling, the detected results of oil tanks from Fig. 22 are shown in Fig. 21. Red numbers represent the order number of the oil tanks. Location parameters of the detected tanks are listed in Table 2. and are the row and column indexes of the tanks. Table 2Parameters of the tanks in optical image.
It is shown that the two dark oil tanks on the left top of Fig. 22 cannot be detected in the optical image while they are found in the SAR image. From the location parameters listed in Tables 1 and 2 and the resolution of the SAR image and optical image, the distance between every two oil tanks can be obtained. The distance comparison of oil tanks is listed in Table 3, where is the distance between the centers of tank and tank (). It is shown that the distance of oil tanks detected by SAR image are highly in accordance with that of optical image. The mean square error is 1.28 m. Thus our detection method for SAR image is valid. Table 3Distance comparison of oil tanks.
Another SAR image with oil tanks is also employed to show the validation of our proposed method in the article. Figure 23 shows a 300 by 300 pixels TerraSAR-X image with 0.5-m resolution in Tucson which is located in the southeast of Arizona, America. The detected result is shown in Fig. 24, and parameters of the detected tanks in SAR images are listed in Table 4. Table 4Parameters of the tanks in Tucson.
5.ConclusionThis article proposes a novel oil tanks detection method for use with the SAR imagery. Experimental results show the new method is effective and significantly decreases the false alarm. The most innovative ideas can be summarized as following:
AcknowledgmentsThis work is partly supported by Program for New Century Excellent Talents in University and the National Natural Science Foundation of China (Grant No. 61301187 and 61328103). The authors would like to thank German Aerospace Center for providing the TerraSAR-X data and reviewers for their hard work. ReferencesR. O. DudaP. E. Hart,
“Use of the Hough transformation to detect lines and curves in pictures,”
Commun. ACM, 15
(1), 11
–15
(1972). http://dx.doi.org/10.1145/361237.361242 CACMA2 0001-0782 Google Scholar
A. Yla-JaaskiN. Kiryati,
“Adaptive termination of voting in the probabilistic circular Hough transform,”
IEEE Trans. Pattern Anal. Mach. Intell., 16
(9), 911
–915
(1994). http://dx.doi.org/10.1109/34.310688 ITPIDJ 0162-8828 Google Scholar
C.-T. HoL.-H. Chen,
“A fast ellipse/circle detector using geometric symmetry,”
Pattern Recognit., 28
(1), 117
–124
(1995). http://dx.doi.org/10.1016/0031-3203(94)00077-Y PTNRA8 0031-3203 Google Scholar
W. YiW. Pei-Jun,
“A fast finding and fitting algorithm to detect circles,”
in Geosci. Remote Sens. Symp. Proc.,
1187
–1189
(1998). Google Scholar
A. ChenJ. Li,
“Automatic recognition method for quasi-circular oil depots in satellite remote sensing images,”
Opto-Electron. Eng., 33
(9), 96
–100
(2006). Google Scholar
K. El-Darymliet al.,
“Target detection in synthetic apertureradar imagery: a state-of-the-art survey,”
J. Appl. Remote Sens., 7
(1), 071598
(2013). http://dx.doi.org/10.1117/1.JRS.7.071598 1931-3195 Google Scholar
R. GuidaA. IodiceD. Riccio,
“Assessment of TerraSAR-X products with a new feature extraction application: monitoring of cylindrical tanks,”
IEEE Trans. Geosci. Remote Sens., 48
(2), 930
–938
(2010). http://dx.doi.org/10.1109/TGRS.2009.2029233 IGRSD2 0196-2892 Google Scholar
Y. Zhanget al.,
“A new algorithm for analyzing the SAR image of the cylindrical oil tank,”
J. Radars, 1
(2), 190
–195
(2012). Google Scholar
M. Eineder,
“Problems and solutions for InSAR digital elevation model generation of mountainous terrain,”
in Proc. FRINGE 2003 Workshop,
(2003). Google Scholar
D. B. AndréR. D. HillC. P. Moate,
“Multipath simulation and removal from SAR Imagery,”
Proc. SPIE, 6970 69700M
(2008). http://dx.doi.org/10.1117/12.776887 PSISDG 0277-786X Google Scholar
E. F. KnottJ. F. ShaefferM. T. Tuley, Radar Cross Section, 2nd ed.SciTech, Raleigh, North Carolina
(2004). Google Scholar
Y. Zhanget al.,
“Research on characteristics of cylinder tanks in SAR image,”
in 2011 IEEE CIE Int. Conf. Radar (Radar),
658
–661
(2011). Google Scholar
J. Lee,
“Digital image enhancement and noise filtering by using local statistics,”
Trans. Pattern Anal. Mach. Intell., PAM1-2
(2), 165
–168
(1980). http://dx.doi.org/10.1109/TPAMI.1980.4766994 ITPIDJ 0162-8828 Google Scholar
A. LopesR. TouziE. Nezry,
“Adaptive speckle filters and scene heterogeneity,”
IEEE Trans. Geosci. Remote Sens., 28
(6), 992
–1000
(1990). http://dx.doi.org/10.1109/36.62623 IGRSD2 0196-2892 Google Scholar
Y. YuS. T. Acton,
“Speckle reducing anisotropic diffusion,”
IEEE Trans. Image Process., 11
(11), 1260
–1270
(2002). http://dx.doi.org/10.1109/TIP.2002.804276 IIPRE4 1057-7149 Google Scholar
BiographyHuaping Xu received the BS degree in electronic engineering and PhD degree in communication and information system from Beihang University, Beijing, China, in 1998 and 2003, respectively. She has been an associate professor in school of electronic and information engineering Beihang University since 2006. Her current research is in SAR, SAR interferometry, and SAR image processing. Wei Chen received the BS degree in electronic and information engineering from Beihang University, Beijing, China, in 1998. He is currently working toward a master’s degree in electronic and information engineering, Beihang University, Beijing, China. His current research interests include SAR interferometry and SAR image processing. Bing Sun received the BS degree and PhD degree from Beihang University, respectively in 2003 and in 2008. He has been a postdoctor since 2008 and a lecturer in the School of Electronic and Information Engineering at Beihang University since 2010. His current activities are SAR signal processing and system design. |