|
|
1.IntroductionClassification of ground-cover types is an important application of polarimetric synthetic aperture radar (PolSAR).1 One difficulty in PolSAR image classification is the large number of highly overlapping pixels and the large amount of excess polarimetric information, which makes classification very challenging.2 Over two decades, many approaches have been proposed to classify PolSAR images. In 1989, VanZyl suggested that PolSAR data could be classified into four scattering mechanisms, a discovery that had a significant impact on subsequent classifications. Cloude and Pottier3 later proposed an unsupervised classification algorithm based on another target decomposition theory. Eigenanalysis of the coherency matrix provides the polarimetric scattering mechanisms with matrix-characterizing parameters, such as the polarimetric entropy and the average polarimetric scattering angle . Using the plane, all kinds of scattering mechanisms can be classified into eight basic zones to discriminate among surface scattering, volume diffusion, and double-bounce scattering. Besides these scattering-mechanism studies,4,5 several classification approaches based on mathematical tools have been proposed, such as Markov random field models,6 region-growing techniques,7 and neural-network techniques.8 However, these techniques have yielded inconsistent results because classification performance has varied depending on which particular normalization scheme was selected. In this study, a novel unsupervised classification model for PolSAR images based on the artificial immune system (AIS) has been developed in an effort to find a stable classifier. The AIS is a new method in the neural computation and evolutionary computation research field.9 It is designed to solve complex problems by exploring the biological immune system, obtaining its processing mechanisms, and developing appropriate engineering models.10 Unlike other evolutionary computation algorithms, the characteristics of the AIS, such as biological diversity, memory, tolerance, distributed parallel processing, and robustness, ensure a balance between exploration and exploitation.11 In recent studies, AISs have been applied to computer security, pattern recognition, machine learning, data mining, and function optimization.12 These studies have the common limitation of relying on training samples, which are treated as antibodies. One point of innovation in this study is the introduction of the AIS into the clustering problem by actualizing the antigens and antibodies without any training sample. On the other hand, to combine the AIS with the PolSAR unsupervised classification algorithm in a reasonable way, an improved initialization method based on the genetic algorithm (GA) and a novel mutation operation has been proposed. Experimental results showed that this novel method can obtain a quasioptimal solution quickly and is effective for PolSAR image classification. The rest of the paper is organized as follows. Necessary background information and fundamental knowledge are provided in Sec. 2. Details of the proposed unsupervised classification algorithm are described in Sec. 3. Section 4 describes the remote-sensing datasets used, together with experimental results and discussion. The conclusions are presented in Sec. 5. 2.Background2.1.Artificial Immune SystemsAIS, inspired by the human immune system, has the powerful information-processing capabilities of the immune system. The concept originated from observations of how the defense mechanism of natural immune systems protects against attacks by antigens. Molecules such as viruses, bacteria, and fungi that can be recognized by the AIS are known as antigens. When a foreign antigen enters the body, the immune system can distinguish “self” from “nonself” and provide an immune response to exclude the antigenicity of nonself substances.13 The AIS algorithm is derived by abstracting the mechanism of the biological immune system. Many concepts and operators of the AIS algorithm correspond to the concepts and mechanisms of the biological immune system. The AIS is a product of the combination of biological immunology and computer science.14 In 1957, clonal selection theory was proposed by Burnet and is described below. First, initialize the population, select the antigen and antibody randomly, calculate the affinity of all antibodies, and determine whether the termination criterion has been met; if it has, output the results, otherwise go to the next step. Second, select the -group antibodies that have the highest affinity with the antigen to generate a new set of antibodies and then perform the cloning operation on these selected antibodies. The result of this operation is a clonal selection set. Third, perform the mutation operation on the clone collection; individuals with good antigen binding experience and poor variation opportunity. Then calculate the affinity of each antigen and each antibody and reselect those antibodies that have the highest affinity with each antigen. Finally, replace the original antibodies with the lowest affinity with the new antibodies obtained from the reselection process so as to increase antibody diversity. The clonal selection algorithm (CSA) is applied in the AIS, which is based on clonal selection and affinity maturation principles.15 Every generation in this algorithm includes the initiation of a candidate solution and selection, cloning, mutation, and reselection operations, similar to the GA. The AIS based on the CSA can deal with a complex search space and has the advantages of inherent parallelism and the ability to avoid local minima.16 2.2.PolSAR Image Classifier2.2.1.decompositionPolarization is used to describe the wave characteristics of an observation point that changes over time; it is a common feature of various vector waves.17 According to the principles of fully polarimetric SAR measurement, the fully polarimetric SAR data make up the scattering matrix S. where is the scattering volume received horizontally and transmitted vertically. After decomposing the matrix based on the Pauli basis, the following vector can be obtained:3 where indicates a transposed matrix. Then the coherency matrix can be written as where * means the conjugate operation. Cloude et al.18 defined the polarimetric entropy and the scattering angle of surface features according to their characteristics and their scattering mechanism by decomposing the coherency matrix. and can be defined as follows:In Eq. (4), , , are the eigenvalues of the coherent matrix . The basic idea of classification takes into account the average scattering mechanism and the scattering process and provides a quantitative description using the average angle and the scattering entropy . Depending on the plane, eight basic regions can be defined representing different scattering mechanisms, as shown in Fig. 1.1 The scattering entropy is a measure of the randomness of scattering mechanisms. When , this suggests that the surface features have only one major scattering mechanism and that the dominant scattering matrix is the eigenvector corresponding to the largest eigenvalue. When , this indicates that the scattering targets are completely random and that their polarimetric information is 0. The value of the scattering angle , which characterizes the physical scattering mechanism, represents, to a certain extent, the average scattering mechanism of the surface features and corresponds to a scattering process, which varies from surface scattering () to body scattering () to even scattering ().17 2.2.2.Wishart distance measurementMeasuring the distance between a pixel and a cluster center is indispensable in a clustering problem. As clustering objects, pixels of the PolSAR image are expressed by the coherency matrix in this study. In 1999, Lee et al.19 proposed the Wishart distance based on the scattering mechanism. The distance between the coherent matrix of a pixel and the coherent matrix of the ’th class can be expressed as Eq. (6). where is the cluster center of the ’th class, which can be obtained by calculating the mean of the set of pixels belonging to the ’th class.3.Unsupervised Classification Method Based on AISIn the classification algorithm based on AIS, concepts such as antigen and antibody must be specific. Because each antibody should be one solution of the problem, it is defined as a vector whose length is equal to the number of classes, and each element of the vector records a coherency matrix of one class center. The antigens are defined as an array composed of all pixels. To estimate the similarity between antigens and antibodies, the Wishart distance is calculated as in Eq. (6). Table 1 shows the main terminologies and concepts in natural immune systems and in terms of PolSAR image classification. Table 1Comparison of concepts and terminologies in natural immune systems (NIS) and in an artificial immune system (AIS) for PolSAR image classification.
The experimental procedure for classification can be described as follows:
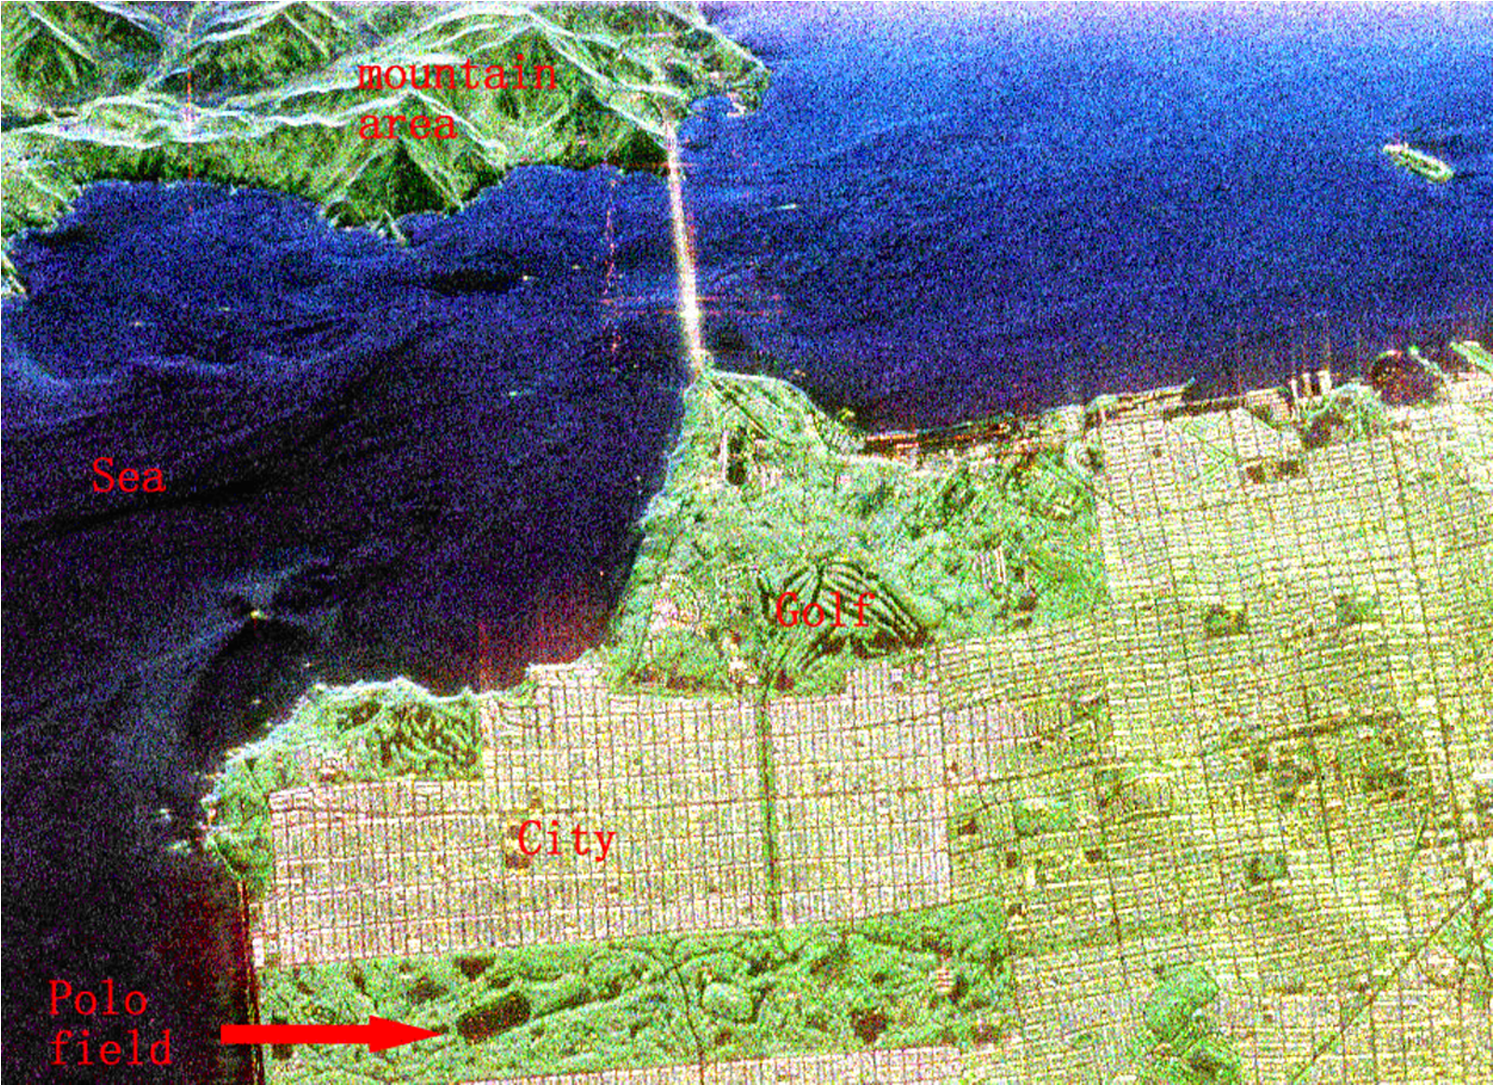
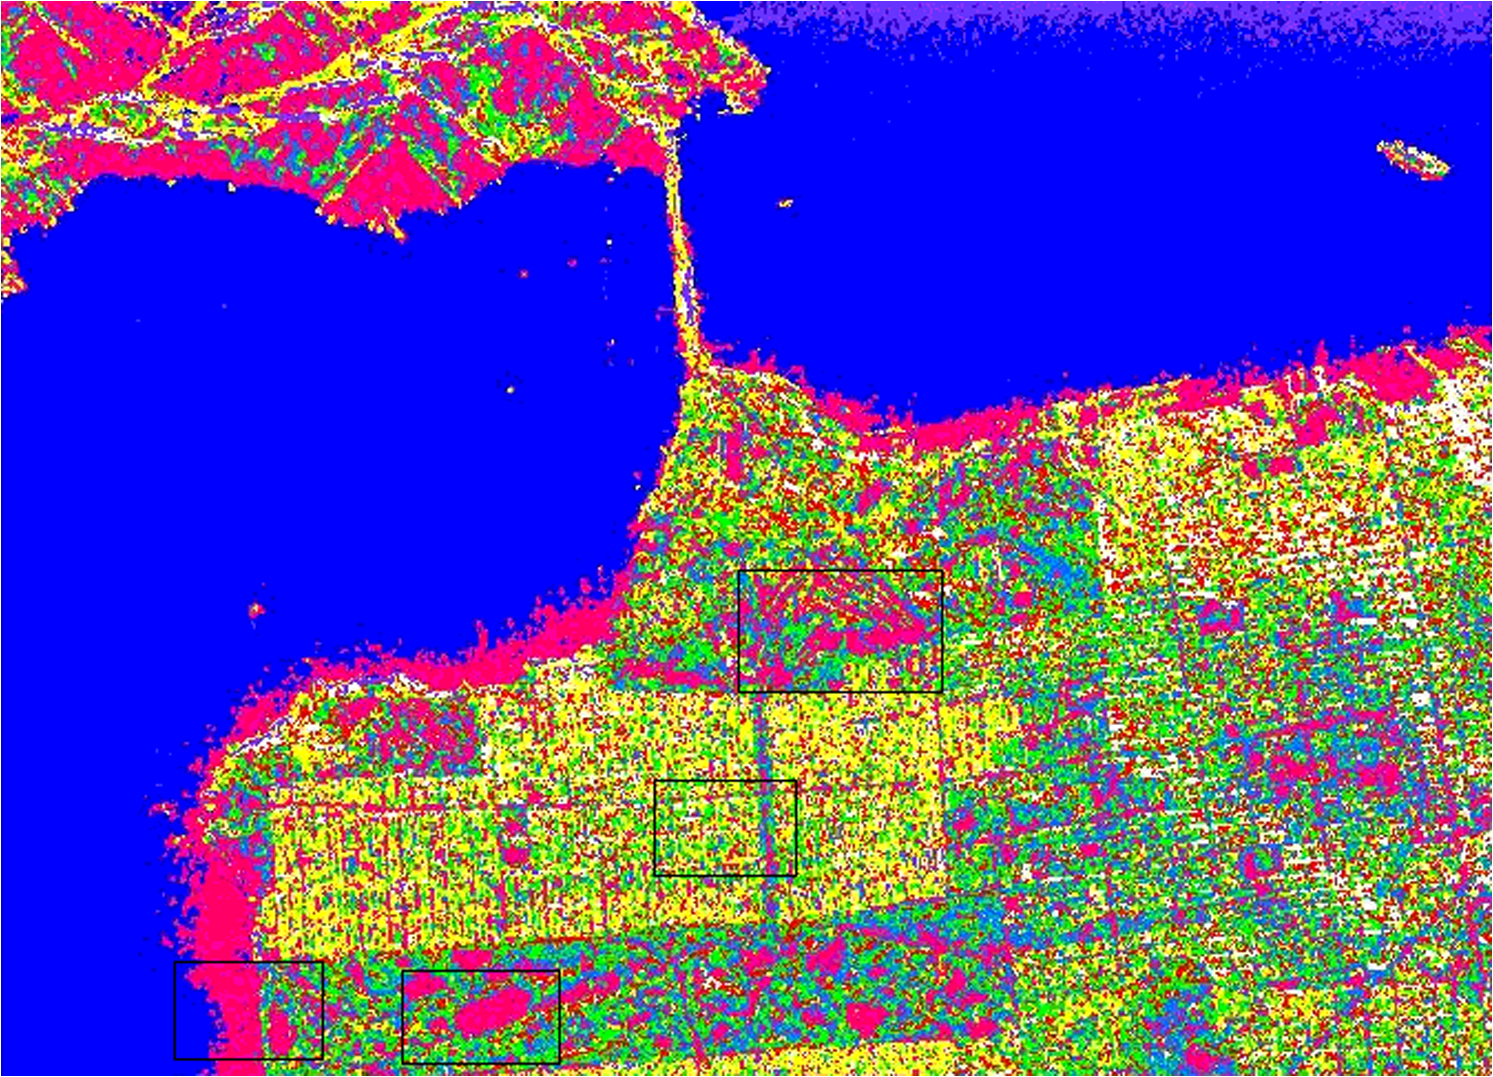
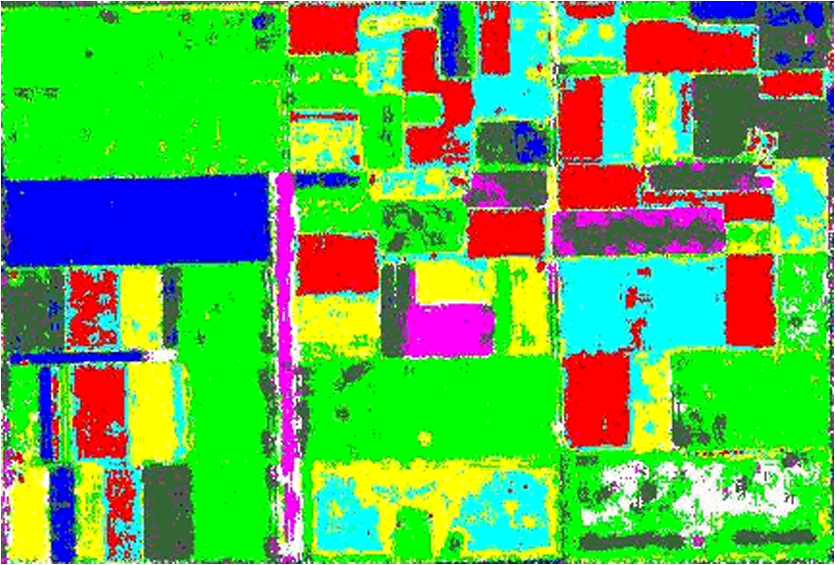
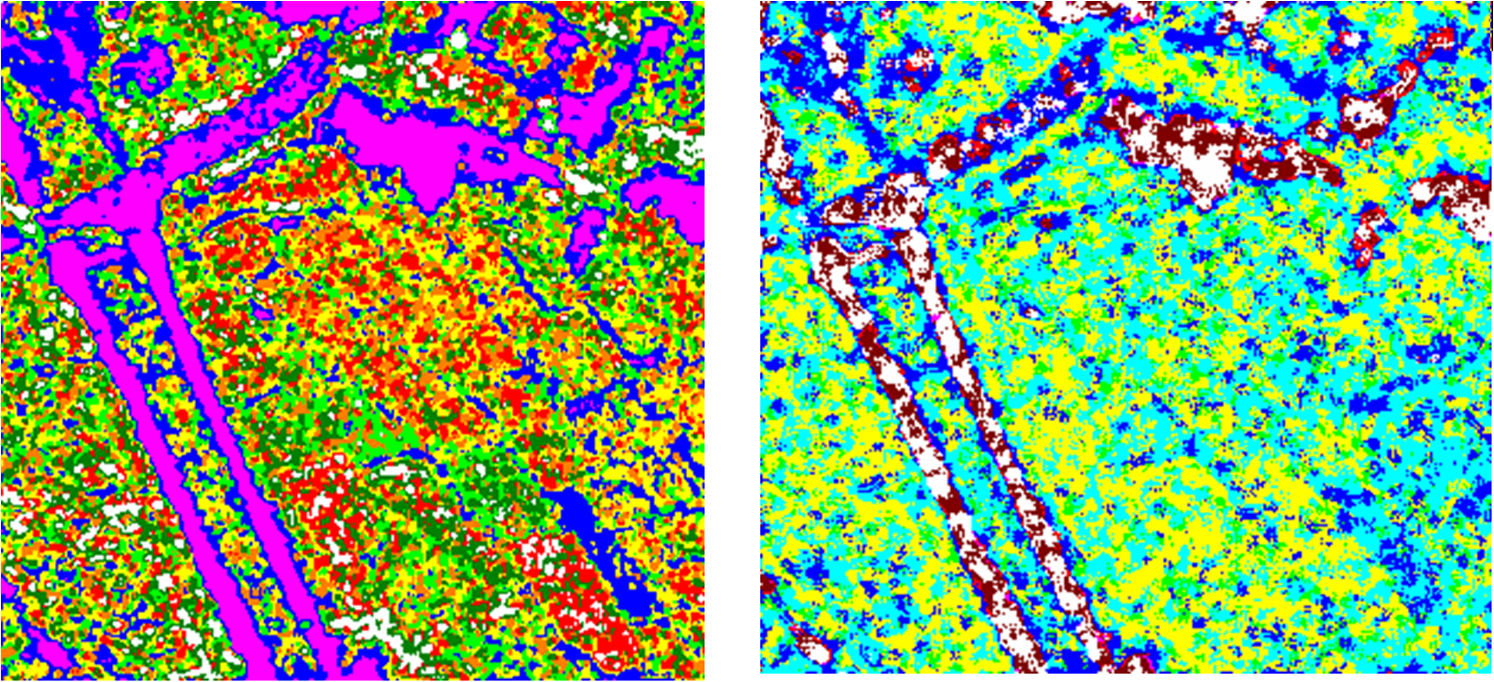
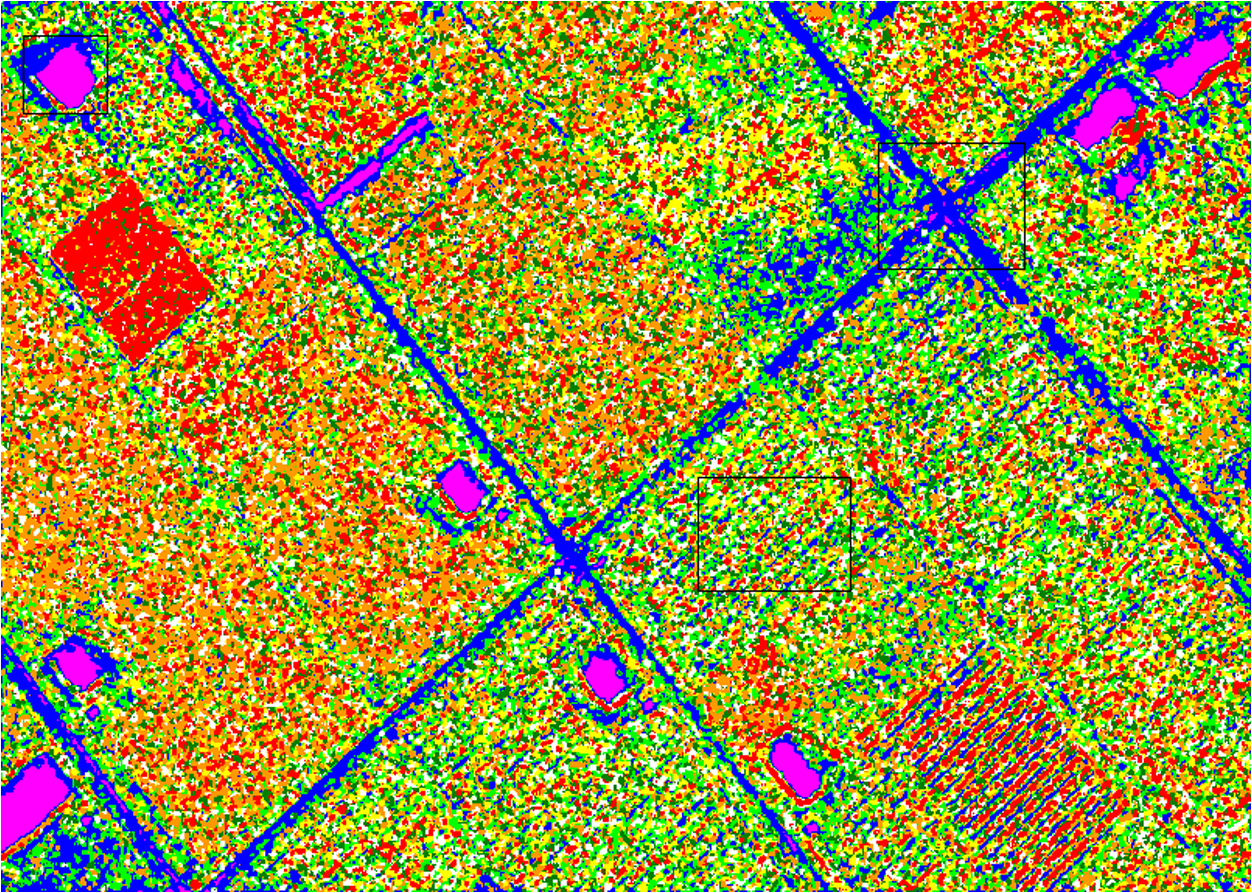
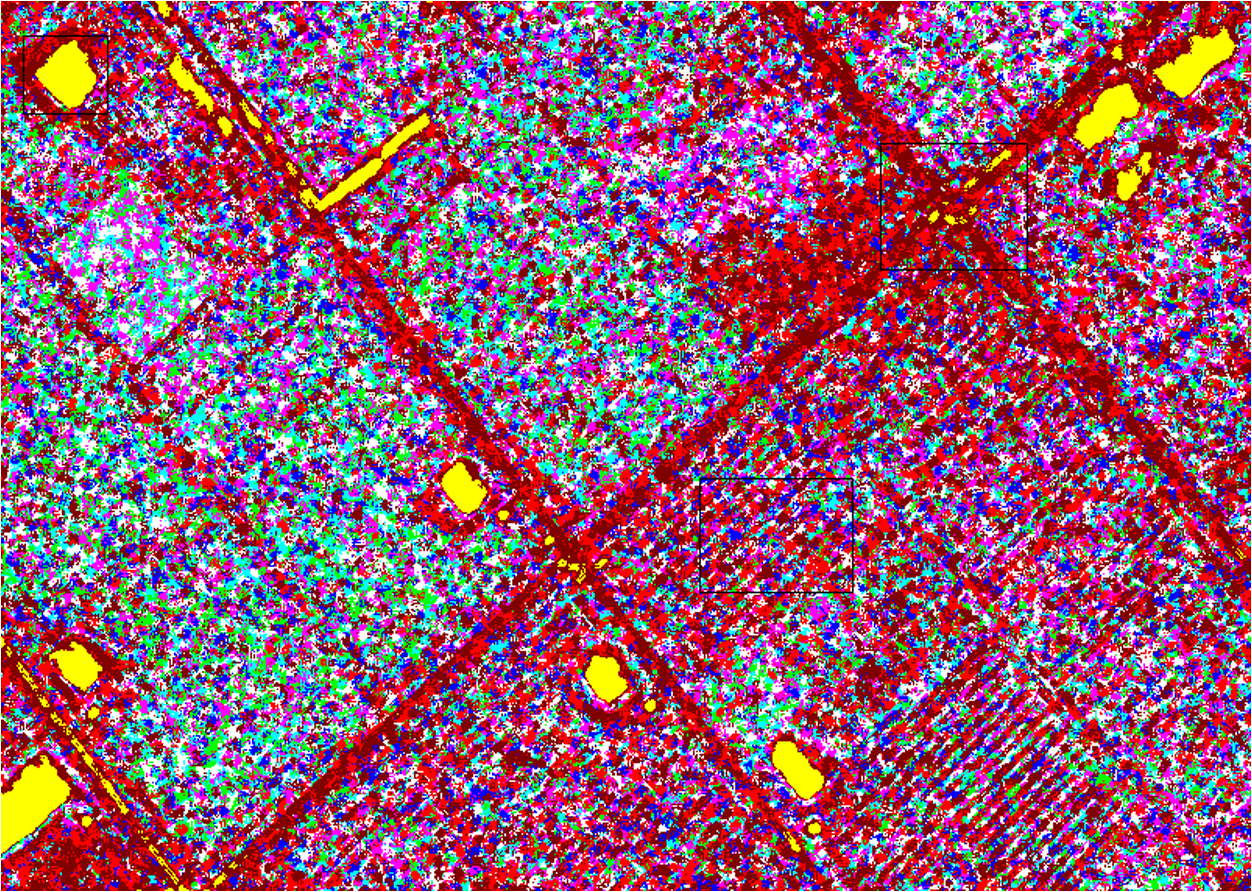
4.Experimental Results and AnalysisThree sets of PolSAR images have been investigated to test the AIS-based algorithm in this study. The first consists of full-polarimetric SAR data for San Francisco Bay, California, obtained from NASA-JPL AIRSAR in 1992. The size of the experimental data set is . The region includes urban areas, ocean, vegetation, the Golden Gate Bridge, and other targets. The second consists of L-band PolSAR data for the Flevoland region from the NASA/JPL Laboratory (Airborne) AIRSAR sensor in 1989, with an azimuth resolution of 12.10 m and a distance resolution of 6.6 m. The feature types in the experimental area are relatively simple; most are croplands of rectangular shape, including grassland, potatoes, alfalfa, wheat, soybeans, sugar beets, peas, and other target surface features. The size of the experimental data set is . The third consists of X-band full-polarimetric high-resolution SAR data for Lingshui Town in Hainan Province in 2010. The original size of this data set is . The region includes airport runways, urban areas, pools, and various kinds of croplands, such as red peppers, betel palms, mangoes, papayas, and rice paddies. Because the original image is too large for analysis, two subareas were selected for the experiments. The first experiments were performed with the first data set and with the AIS algorithm mutation probability set to 0.05. And the Fig. 2 shows the Pauli RGB image of the experiment area. Compared Fig. 3 with Fig. 4, it is clear that the classification of the ocean part with the CSA is better than with -Wishart classification method because the ocean contains only low-entropy and medium-entropy surface scattering, with the majority being low-entropy surface scattering. Although the -Wishart classification method can characterize the scattering mechanism of surface features,20,21 its classification of different surface features using the same scattering mechanism is not precise enough because there is not a one-to-one relationship between surface features and scattering mechanism. Both vegetation and urban areas contain both medium-entropy and multiple scattering components and, therefore, they were confused in the image results. As shown by the -Wishart classification results in Fig. 5(b), the same type of surface feature with a variety of scattering mechanisms may be classified falsely into multiple categories. For instance, vegetation in the golf course in Fig. 5(b) with even and multiple scattering is seriously misclassified. Overall, the result shows a serious lack of texture information, and outlines are not clear. By contrast, when using the CSA illustrated in Fig. 5(a), the classification results are greatly improved. A variety of surface features have been distinguished, the texture of vegetation appears clearer, sea levels are more apparent, and the classification of vegetation is better. From comparison of the four extracted parts, it can be seen that the polo field in Fig. 5(b) is not obvious, while the polo field in Fig. 5(a) is an oval-shaped region with a smooth outline. Most of the beach A is identified by medium-entropy surface scattering, which corresponds to the actual situation. The golf course in Fig. 5(a) is classified clearly, while the golf course in Fig. 5(b) is almost impossible to identify. Although vegetation and urban areas are seriously confused in Fig. 5(b), the texture of urban areas and roads in Fig. 5(b) is quite clear. Overall, the classification results of the CSA are better. To verify further the validity of the classification algorithm, the second set of PolSAR data was used for another set of experiments, and a quantitative analysis was performed using a confusion matrix. Figure 6 shows an RGB composite image of the region. The red, green, and blue components of the composite image were obtained using the three parameters , , and derived from the Pauli decomposition. The mutation probability in the AIS algorithm was set to 0.05. From visual observation of Fig. 7, the classification result of the image is quite smooth. Some areas were not distinguished, such as peas and sugar beets, while other types were misclassified, such as potatoes. However, the majority of the surface features, such as peas and sugar beets, can be identified in the CSA classification results shown in Fig. 8. Potatoes were also classified correctly, and the improvement is clear. To evaluate the classification accuracy of the CSA, Fig. 6(b) shows a reference image of the real surface features. Test samples from the image were selected randomly (Fig. 9), and confusion matrices were obtained for the -Wishart and CSA classifications. As can be seen from Table 2, the accuracy of the CSA is greater than that of the -Wishart method, both in terms of overall accuracy and the kappa coefficient. For some categories, such as rape and bare soil, the mapping accuracy and precision of the clonal selection method were . The -Wishart classification algorithm distinguished only four vegetation categories, misclassified peas and beets into the same category, divided potatoes into two categories, and made no distinction between grassland, rape, and other surface features, resulting in lower classification accuracy. The CSA achieved a better classification result. Table 2Clonal selection algorithm and H/α-Wishart algorithm confusion matrices.
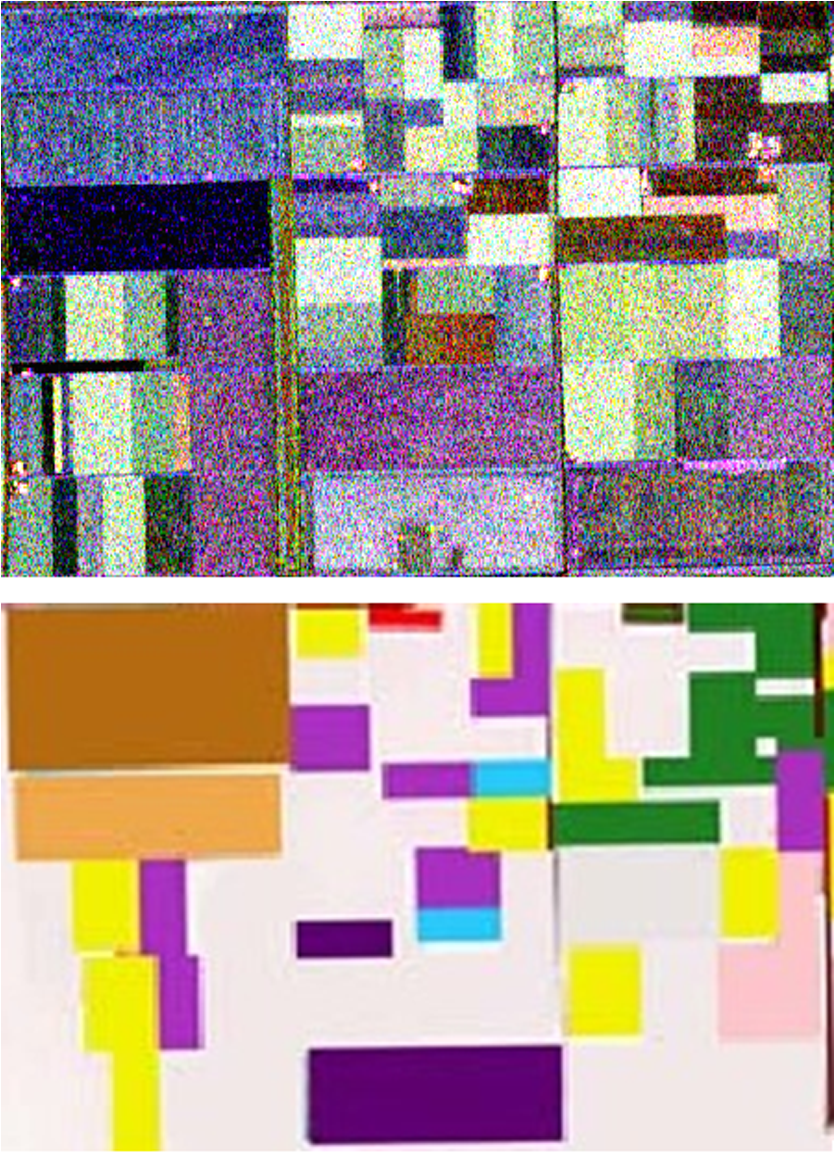
To verify that the CSA has stable performance, a set of experiments was performed using the third data set. The experiment image and the results are showed in Figs. 10 and 11. Because the experimental data are of high resolution in the farmland area, neither of the two algorithms exhibited good performance. The -Wishart classification result combined the road and the shadow of the trees into a single category. In the CSA result, although these two features could still not be separated distinctly, a further classification could be performed in this area. Because the pixels representing roads were further divided into two categories (brown and white) in the results of the AIS algorithm, it is apparent that the AIS algorithm revealed additional information in homogeneous regions and can explore polarimetric information to a greater extent. The first and second experiments have already proved that the CSA can improve the quality of classification results for classic PolSAR data. And the forth experiment are applied with the second subset of Lingshui image which contains mango trees, farmland, path in field and pools (showed in Fig. 12). Figure 15, which is extracted from Figs. 13 and 14, illustrates the improvement achieved using the CSA. For the pixels representing the pool in Figs. 15(a) and 15(b), the two algorithms achieve similar performance, but around the pool in Fig. 15(b), the bare soil has been classified into two categories in a reasonable way. This phenomenon can also be seen with the country road in Fig. 15(b). For the papaya field, the result in Fig. 15(a) shows more randomness and mass, but in Fig. 15(b), more texture information has been retrieved. Fig. 15Detailed comparison of classification results. (a) Country road, papaya field, pool. (b) Country road, papaya field, pool. 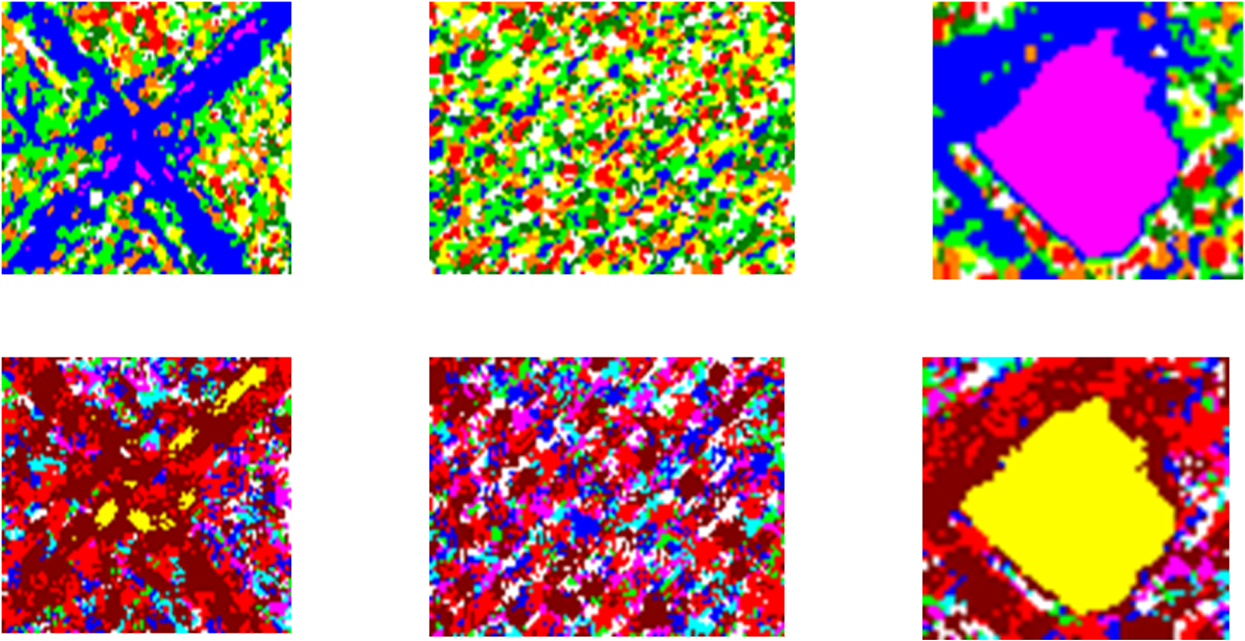 From the above discussion, it can be concluded that the CSA can achieve better classification results and exhibits stable performance on various kinds of data. This difference occurs because the -Wishart method can search only cluster centers according to a rigid rule. The classification results of the -Wishart algorithm are greatly affected by the initial classification, but the AIS is a kind of search strategy that is capable of global optimization. 5.ConclusionsTo increase classification precision, a new method has been proposed for PolSAR classification based on the CSA. By treating pixels as antigens and class center groups as antibodies, the novel algorithm takes advantage of global search and self-learning to obtain the global optimal solution quickly in clustering problems. Experimental results show that the proposed algorithm with an improved initialization method and a novel mutation operation is better than the -Wishart classification and is a more effective PolSAR classification algorithm than its competitors, with stable performance. AcknowledgmentsThis study is supported by two Chinese Foundation: 863 Key Project “Object Oriented Features of High Confidence SAR Interpretation System” and Fourth Project “Object Oriented SAR Images High Credible Interpretation Technique” (No. 2011AA120404) and Special Foundation of Geographical Condition Monitoring (No. B1288). ReferencesJ. S. Leeet al.,
“Unsupervised classification using polarimetric decomposition and the complex Wishart classifier,”
IEEE Trans. Geosci. Remote Sens., 37
(5), 2244
–2266
(1999). http://dx.doi.org/10.1109/36.789621 IGRSD2 0196-2892 Google Scholar
P. Lombardoet al.,
“Optimum model-based segmentation techniques for multifrequency polarimetric SAR images of urban areas,”
IEEE Trans. Geosci. Remote Sens., 41
(9), 1959
–1975
(2003). http://dx.doi.org/10.1109/TGRS.2003.814632 IGRSD2 0196-2892 Google Scholar
S. R. CloudeE. Pottier,
“An entropy based classification scheme for land applications of polarimetric SAR,”
IEEE Trans. Geosci. Remote Sens., 35
(1), 68
–78
(1997). http://dx.doi.org/10.1109/36.551935 IGRSD2 0196-2892 Google Scholar
S. Ning,
“Artificial immune optimization algorithm and applications,”
Harbin Institute of Technology, Harbin,
(2006). Google Scholar
Y. Zhonget al.,
“A supervised artificial immune classifier for remote-sensing imagery,”
IEEE Trans. Geosci. Remote Sens., 45
(12), 3957
–3966
(2007). http://dx.doi.org/10.1109/TGRS.2007.907739 IGRSD2 0196-2892 Google Scholar
Y. Yamaguchiet al.,
“Classification of terrain by implementing the correlation coefficient in the circular polarization basis using X-band POLSAR data,”
IEICE Trans. Commun., E91.B
(1), 297
–301
(2008). http://dx.doi.org/10.1093/ietcom/e91-b.1.297 ITRCEC 0916-8516 Google Scholar
E. PottierJ. S. Lee,
“Application of the H/A/alpha polarimetric decomposition theorem for unsupervised classification of fully polarimetric SAR data based on the Wishart distribution,”
in Proc. of Committee on Earth Observing Satellites SAR Workshop,
335
–340
(2000). Google Scholar
K. S. Chenet al.,
“Classification of multifrequency polarimetric SAR image using a dynamic learning neural network,”
IEEE Trans. Geosci. Remote Sens., 34
(3), 814
–820
(1996). http://dx.doi.org/10.1109/36.499786 IGRSD2 0196-2892 Google Scholar
J. H. Carter,
“The immune system as a model for pattern recognition and classifications,”
J. Am. Med. Inform. Assoc., 7
(1), 28
–41
(2000). http://dx.doi.org/10.1136/jamia.2000.0070028 1067-5027 Google Scholar
S. Kiranyazet al.,
“Collective network of binary classifier framework for polarimetric SAR image classification: an evolutionary approach,”
IEEE Trans. Geosci. Remote Sens., 42
(4), 1169
–1185
(2012). http://dx.doi.org/10.1109/TSMCB.2012.2187891 IGRSD2 0196-2892 Google Scholar
J. TimmisM. Neal,
“An artificial immune system for data analysis,”
Biosystems, 55
(1–3), 143
–150
(2000). http://dx.doi.org/10.1016/S0303-2647(99)00092-1 BSYMBO 0303-2647 Google Scholar
Y. Zhonget al.,
“An unsupervised artificial immune classifier for multi/hyperspectral remote sensing imagery,”
IEEE Trans. Geosci. Remote Sens., 44
(2), 420
–431
(2006). http://dx.doi.org/10.1109/TGRS.2005.861548 IGRSD2 0196-2892 Google Scholar
J. LichengD. Haifeng, The Computation Study and Distinguish of Immunity Optimization, The Science, Beijing
(2006). Google Scholar
Q. Xiao-Ning,
“Research and application of classification method based on artificial immune system,”
Hunan University, Changsha,
(2008). Google Scholar
Artificial Immune Systems and Their Application, Springer-Verlag, Berlin, Heidelberg
(1999). Google Scholar
J. J. VanZylH. A. ZebkerC. Elachi,
“Imaging radar polarization signatures: theory and observation,”
Radio Sci., 22
(4), 529
–534
(1987). http://dx.doi.org/10.1029/RS022i004p00529 RASCAD 0048-6604 Google Scholar
W. ChaoH. Zhang, The Image Procession of Polarimetric Synthetic Aperture Radar, The Science, Beijing
(2008). Google Scholar
S. R. CloudeK. P. Papathanassiou,
“Polarimetric SAR interferometry,”
IEEE Trans. Geosci. Remote Sens., 36
(5), 1551
–1565
(1998). http://dx.doi.org/10.1109/36.718859 IGRSD2 0196-2892 Google Scholar
P. YuA. K. QinD. A. Clausi,
“Unsupervised polarimetric SAR image segmentation and classification using region growing with edge penalty,”
IEEE Trans. Geosci. Remote Sens., 50
(4), 1302
–1317
(2012). http://dx.doi.org/10.1109/TGRS.2011.2164085 IGRSD2 0196-2892 Google Scholar
J. S. LeeM. R. Grunes,
“Classification of multi-look polarimetric SAR imagery based on complex Wishart distribution,”
Int. J. Remote Sens., 15
(11), 2299
–2311
(1994). http://dx.doi.org/10.1080/01431169408954244 IJSEDK 0143-1161 Google Scholar
J. S. LeeM. R. GrunesE. Pottier,
“Quantitative comparison of classification capability: fully polarimetric versus dual and single-polarization SAR,”
IEEE Trans. Geosci. Remote Sens., 39
(11), 2343
–2351
(2001). http://dx.doi.org/10.1109/36.964970 IGRSD2 0196-2892 Google Scholar
BiographyYu Jie is a professor in the College of Resource Environment and Tourism and the State Key Laboratory Incubation Base of Urban Environmental Processes and Digital Simulation at Capital Normal University. She is engaged in teaching and research about geographic information systems (GIS) and remote sensing. Her main research interests are in remotely sensed imagery processing and application of GIS. Wang Gang received his MS degree in information engineering from Wuhan University, China, in 2011. Now he works in remote-sensing image processing at the Institute of Surveying and Mapping, Qingdao. Zhu Teng received his BS degree in soft engineering from Wuhan University, China, in 2010. And now he is studying remote-sensing image processing, artificial intelligence, and pattern recognition for the PhD in the School of Remote Sensing and Information Engineering, Wuhan University, China. Li Xiaojuan is a professor in the College of Resource Environment and Tourism and the Beijing Key Laboratory of Resource Environment and Geographic Information System at Capital Normal University. She is engaged in teaching and research about resource and environment information systems and environmental remote sensing. |