|
|
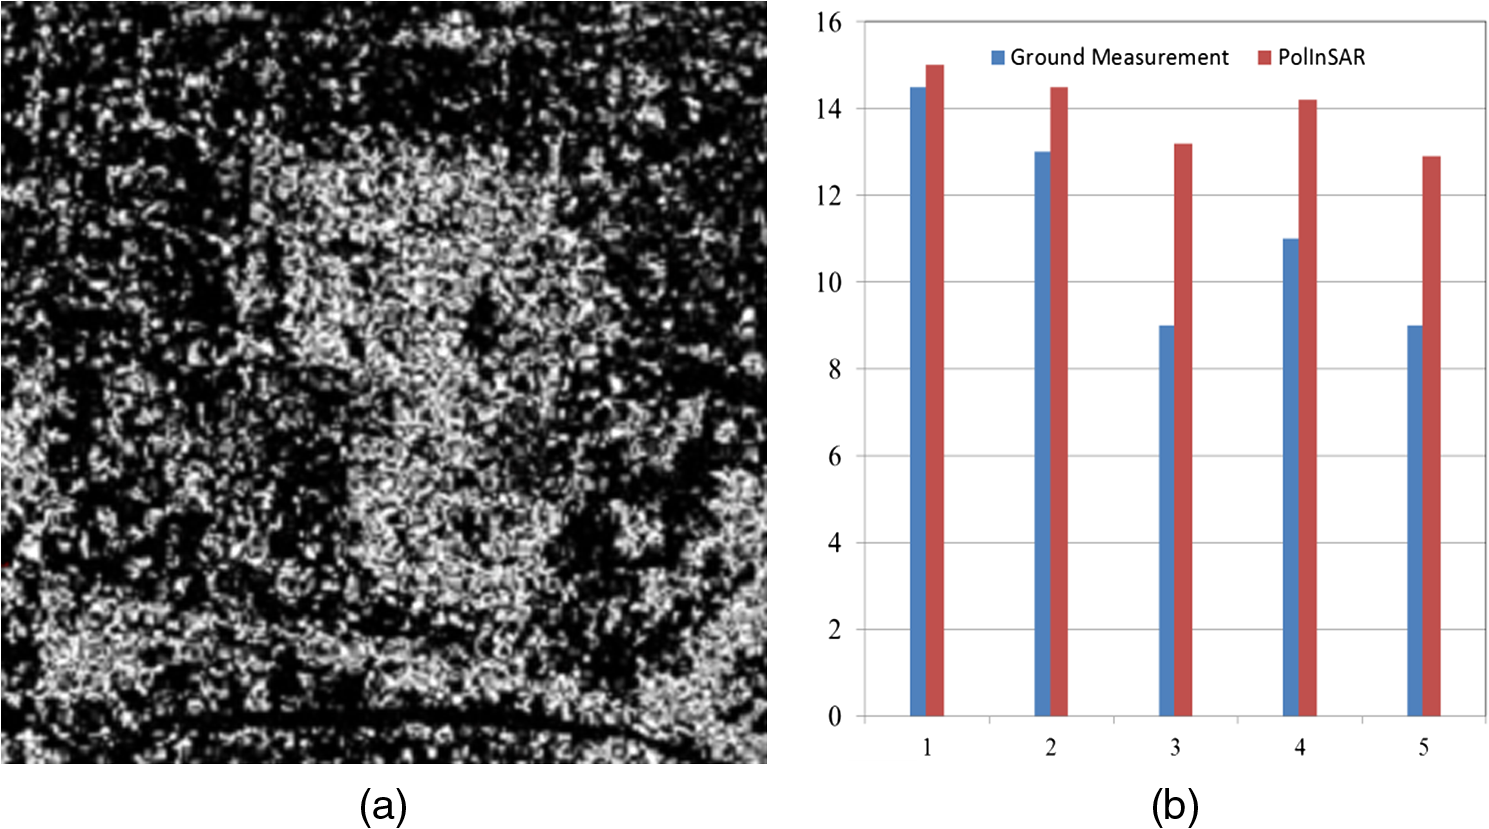
1.IntroductionGlobal environmental change (GEC) is a combination of large-scale biological, geomorphological, and physical changes on the Earth’s surface as a result of human activities and natural processes. GEC has manifested itself in different ways, such as global warming, ozone depletion, acid rain, desertification, and biodiversity reduction. The United Nations Intergovernmental Panel on Climatic Change pointed out that global warming is undoubted, and warming will continue. GEC is significantly impacting society, has attracted considerable attention from various countries, and has become a major topic for researchers. In November 2007, officials and researchers from 73 countries and 46 international organizations participated in the Group on Earth Observations Ministerial Summit held in Cape Town, South Africa, and released the “Cape Town Declaration.” It recognized that nations are facing major environmental, social, and economic challenges as a consequence of global change; the continued operation of terrestrial, oceanic, airborne, and space-based observation networks is critical for informed decision making; GEC has unique spatial and temporal evolutionary characteristics, and studying GEC requires a variety of theories and techniques because of its complexity. Earth observation is one of the most promising techniques and has advantages in monitoring the atmosphere, oceans, land, etc., in comparison to conventional methods, not only because of its operational, large-scale monitoring capability, but also due to its ability to quickly and dynamically monitor extreme environmental events. Synthetic aperture radar (SAR) is a commonly used class of sensors for Earth observation, with all-weather, day-night imaging capability. SAR has become one of the most sophisticated tools available for land use or land cover mapping, change detection for urban areas, and impacts of human activities related to environmental change. RADARSAT-2 is Canada’s newest commercial SAR satellite. The SAR sensor on RADARSAT-2 has been designed with significant, powerful technical advancements, which include high-resolution imaging, flexibility in selection of polarization, left- and right-looking imaging options, and more precise measurements of spacecraft position and attitude. Together, these have the powerful capabilities RADARSAT-2 has for contributing to GEC research. Some sensitive factors or indicators of GEC can be observed with Earth observation technology. We divided those factors into two types: influenced factors and driving factors. The influenced factors include sensitive factors, such as temperature, humidity, glacial retreat, and biomass reduction. One of the common driving factors is the impact of urbanization on the urban environment and regional ecological conditions. We have seen factors such as megacities adversely alter the global environment. Utilizing Earth observation techniques, we have studied sensitive factors related to GEC. In this paper, we present some results from documenting and extracting these sensitive factors from SAR data, including flood inundation areas, tree height, alluvial fan surface extent, and impervious urban surfaces, and, thus, demonstrate the utility of RADARSAT-2 data in GEC monitoring. SAR images have been widely used to study indicators of GEC. Utilizing L-band JERS-1 SAR imagery, Hess et al. mapped the extent of wetland inundation in the central Amazon region.1 Kasischke et al. studied the effects of seasonal hydrologic patterns in southern Florida’s wetlands on European Remote Sensing SAR backscatter images and found that the correlation between changes in SAR backscatter and water depth indicate the potential for using spaceborne SAR systems for monitoring variations in wetland flooding.2 Shen used an object-oriented method to process multipolarized ENVISAT/ASAR data to detect the extent of inundation. The C-band ENVISAT/ASAR has a wavelength similar to that of RADARSAT-2.3 Since microwaves can penetrate the forest canopy and the return signal contains valuable information of the forest structure,4 many airborne and spaceborne SAR systems are acquiring a large amount of full-polarization SAR images. By utilizing polarimetric synthetic aperture radar interferometry (PolInSAR), we can map global forest height with a high spatial resolution.4,5 Recently, Caicoya et al. estimated the biomass stock by applying allometric equations.6 Alluvial fans in arid and semiarid regions provide an important record of neotectonics and paleoclimate change, revealing the evolutionary characteristics of the regional paleoenvironment.7–11 For example, by studying the surfaces of alluvial fan units, information about weathering, age, and past climatic conditions, all of which affect surface morphology, can be determined12 and are an indicator of paleoclimate and paleoenvironment change. SAR can play an important role in mapping alluvial fan surfaces.13–15 In this paper, using the Shule River alluvial fan as an example, we have provided detailed parameters of its geomorphological features and mapped the alluvial fan surfaces using full-polarization RADARSAT-2 data, demonstrating its ability to document the characteristics of alluvial fan surfaces. Impervious surfaces are usually defined as the entirety of surfaces through which water cannot pass, including roads, buildings, parking lots, railroads, squares, sidewalks, or other urban infrastructure.16 Impervious surface coverage has become a key environmental indicator in assessing urbanization’s impacts on urban environmental and ecological conditions. Those related environmental issues, as well as the increased concern about the environment due to rapid global urbanization, have triggered a surge of research interest in studies of impervious surfaces. Recently, optical imagery has been widely used to estimate the urban impervious surface areas, but it has some limitations, including problems with mixed-pixels17 and building shadows18 as SAR images are very sensitive to buildings. Stilla used SAR data to extract urban roads.19 However, due to the low information content of individual SAR images, single-band SAR data do not provide highly accurate estimates of impervious surface areas. To overcome this, Jiang et al. used information from two SAR images, including InSAR, to differentiate man-made targets (e.g., buildings) from natural targets (e.g., bare soil).20 Polarimetric SAR (PolSAR) can provide more useful information at spatial and temporal levels for distinguishing different land features. One of the specific objectives of this investigation is to explore the potential to extract impervious surfaces in dense urban areas from RADARSAT-2 full PolSAR data. 2.Methodologies2.1.Flood Inundation Area ExtractionThere are several advantages of using RADARSAT-2 in flood monitoring: (1) a left- and right-looking sensor, (2) short revisit time, (3) multi-image mode, and (4) multipolarization. The selective look direction is particularly effective in flood management.21 In particular, the polarimetric mode is very useful in monitoring the vegetated areas.22 These features also make it well suited for rapid disaster response, monitoring, mitigation, and evaluation. Flooded areas appear dark in SAR images due to specular reflection.3 After preprocessing, including geometric correction, we classified the images to extract the inundated areas using temporal data acquired during the flood. For the image filtering, we used an enhanced frost filter with a window size of , which can reduce noise and also preserve detailed information. Combined with human interpretation, the highly efficient decision tree method was applied to rapidly extract the inundated areas. The resulting images were then imported to ArcGIS to extract the inundated area changes. The processing flow chart used is shown in Fig. 1. 2.2.PolInSAR Tree Height ExtractionPolInSAR is a rapidly evolving technique and has been applied in many fields, such as forest height inversion and topographic mapping.23–25 However, for a diverse and complex land surface, it is very difficult to precisely ascribe backscattering characteristics. In order to simplify the scattering model, some assumptions are necessary for PolInSAR applications. At the same time, the errors of incidence angle, slant range, and baseline length will also affect the accuracy of PolInSAR. The critical element is how to accurately estimate the locations of the effective scattering phase centers,26 which depend on the system parameters, such as wavelength and polarization, as well as the physical and geometrical parameters of the scatterers. Five different scattering mechanisms of PolInSAR occur when microwaves pass through the forest above ground level.27 The random volume over ground (RVoG) model provides an equation to describe the relationship between volume coherence and the parameters of the forest, such as height and extinction.4 For a given forest and interferometric configuration, a forest with high extinction and tall trees may have the same volume coherence as a forest with lower extinction and shorter trees, which is the height and extinction ambiguity. Therefore, the PolInSAR technique is not appropriate for parameter inversion of these two kinds of forest. In the RVoG model, the volume coherence increases proportionately with the volume height but inversely to the extinction. However, some studies have demonstrated the low dependence of height inversion on the mean extinction coefficient.28 Additionally, for high extinction, the variation of vegetation height will also have no obvious effect on the volume coherence for the small penetration depth of the radar waves. In this study, we used two scenes of fully polarimetric data acquired by RADARSAT-2 over Tiantan Park in Beijing to estimate forest height. 2.3.Alluvial Fan Surface MappingMany geomorphological features related to the alluvial fan units of different ages can be extracted from SAR images, especially PolSAR images. These features’ parameters can be used to differentiate between different alluvial fan units. Three steps were adopted for this study.
Cloude decomposition expresses the target scattering vector in terms of five parameters under a reciprocity assumption, i.e., Some key parameters, such as scattering type parameter alpha (), coherency entropy (H), anisotropy (A), target orientation angle (), and target phase angle (, ) have been introduced from the eigenvalue decomposition of the Hermitian target coherency matrixes. H is a global measure of the distribution of components in the scattering process and can be used to indicate the complexity and randomness of scattering types. A high alpha in the intact region indicates that only one dominant scattering type occurs there. Alpha shows the scattering type of observed targets. Recent studies have shown that the Cloude alpha scattering type ambiguities may occur for certain scatterers.30 Touzi et al. proposed a roll-invariant target decomposition method to solve this problem.31 Some roll-invariant parameters can be extracted by using this method, such as symmetric scattering type and its phase , among others. In this paper, RADARSAT-2 fine mode PolSAR data were acquired over the Shule River alluvial fan and the temporal-spatial distribution of the fans were studied. 2.4.Support Vector Machine-Based Impervious Urban Surface ExtractionRecently, urban impervious surfaces were mostly estimated from optical imagery. However, there have been some open problems, including
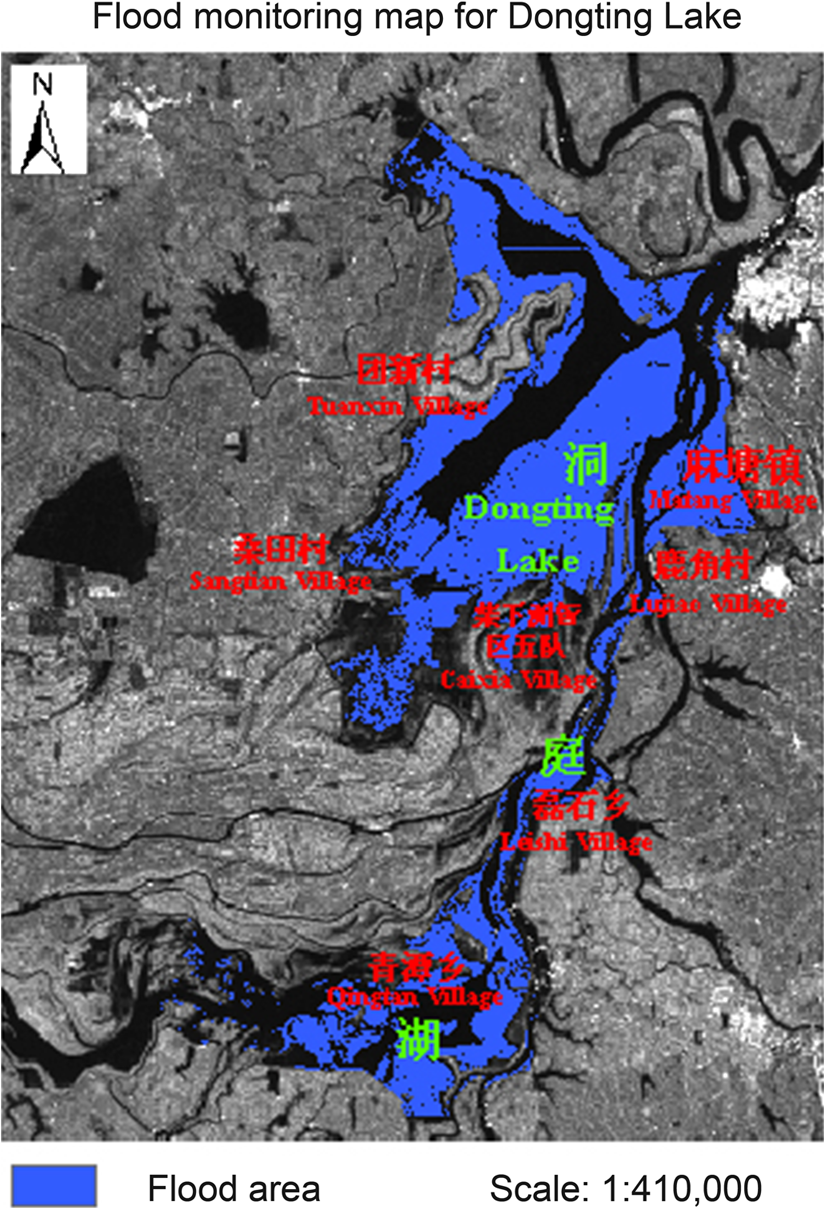
To resolve these limitations, RADARSAT-2 full PolSAR data (C-band) were used to investigate the potential of extracting urban impervious surfaces in dense urban areas. In our research, a robust algorithm, a support vector machine (SVM), was used for estimating impervious surfaces. SVMs have been used for image classification32–35 and impervious surface estimation36,37 in remote sensing studies in recent years. Because too many PolSAR-identified features will result in data redundancy and reduce classification accuracy, the optimization of features is an important step for extracting impervious surfaces from PolSAR data. The various polarimetric features were selected through a stepwise process. Different classification accuracies were derived when different PolSAR features were put into the SVM classifier. While reducing the classification accuracy, the features with an adverse effect on classification were removed, and when improving the classification accuracy, the features with a positive effect on classification were retained. Then, the PolSAR features that improved the classification accuracy were further statistically analyzed using the sample points of seven land use types. After statistical analysis of these features, the final polarimetric features were optimally selected for estimating the impervious surfaces. Figure 2 shows a detailed flow chart of the optimized feature selection process for PolSAR processing. 3.Results and Analysis3.1.Flood Disaster Monitoring and Evaluation with RADARSAT-2 ImageryChina often suffers from disasters caused by floods, with huge losses every year. The regions around Dongting Lake and Poyang Lake are the two most seriously flood-prone areas in China. Dongting Lake, one of the largest and shallowest lakes in China, is a flood basin of the Yangtze River in northeastern Hunan Province. Poyang Lake is also a flood basin of the Yangtze in northern Jiangxi Province. On June 21, 2010, the eastern bank of the Fuhe River (the upstream of Poyang Lake) collapsed in Fuzhou City, Jiangxi Province. One hundred thousand people were under the threat of flooding. Center for Earth Observation and Digital Earth (CEODE), Chinese Academy of Sciences scientists developed emergency satellite observation plans to monitor dynamic changes and evaluate disaster losses using RADARSAT-2 imagery during the cloudy and rainy weather. In this paper, fine, ultrafine, and ScanSAR narrow mode RADARSAT-2 data were used for flood monitoring due to their large areal extent and the polarization information provided by these three modes of data. The RADARSAT-2 images covering the Changkai embankment and the city of Fuzhou were acquired on June 24, 26, and 27, 2010, and the images covering the submerged area around Dongting Lake were acquired on June 27 and July 2, 2010. The data are summarized in Table 1. Table 1The RADARSAT-2 images used for flood monitoring.
Only the SAR all-weather, day and night imaging capability made this dynamic flood monitoring possible. Due to the specular reflection of radar waves from water, the inundated area can be easily identified. After classifying the RADARSAT-2 images using a decision tree method, the inundated areas were extracted and then converted to vector format in ArcGIS. Figures 3Fig. 4Fig. 5 to 6 show the inundated area. By comparing the images from June 24 and 27 (Figs. 3 and 4), one can see that the flood area had decreased noticeably, but remained at some . The flooded area between June 27 and July 2 (Figs. 5 and 6) around Dongting Lake increased by . After extracting the inundated land, we incorporated population information and land use data, and were able to evaluate the impact of the flood on human life and property. The land cover layer was overlain on the inundation layer to define the intersection between these two layers. The inundation statistics were generated from the intersection layer. Table 2 shows the statistics of the inundated area, grouped by land cover type, for the city of Linchuan District and Dongxiang County, which are the two districts of Fuzhou City that were inundated. The statistics show that the paddy fields in the plain suffered the most severe flooding, with an area up to 77.49 and for Linchuan and Dongxiang County, respectively. Table 3 shows the population affected by the flood, with 214,500 people and 51,500 families affected. From these statistics, we classified this disaster as severe. Table 2Flooded area by land cover type for Linchuan District and Dongxiang County of Fuzhou City.
Table 3Affected population for Linchuan District and Dongxiang County of Fuzhou City.
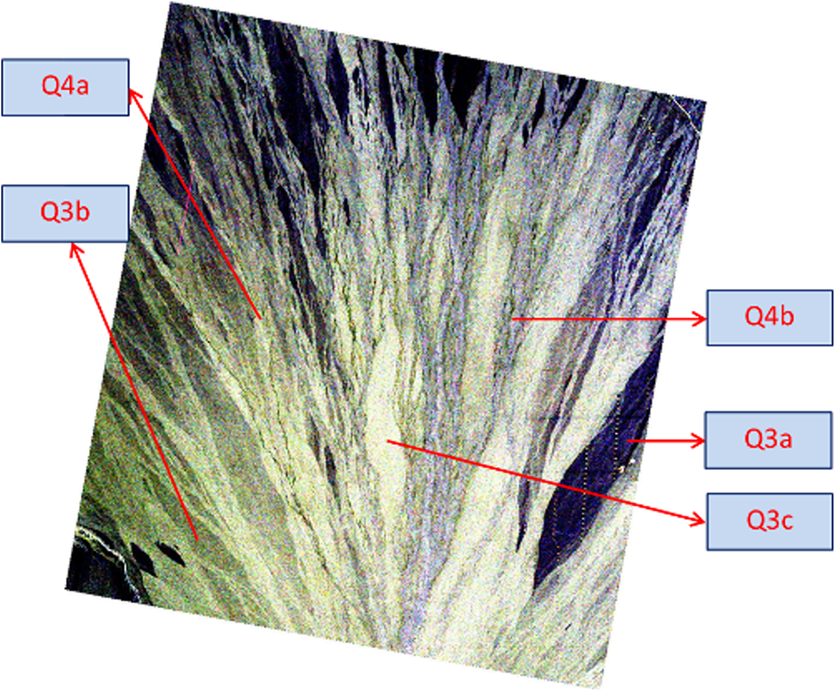
Due to the GEC, extreme weather events occur more frequently and are more disastrous.38 Flood disasters, as one of the most severe, can be an indication of GEC. On June 21, 2010, rare heavy rains caused an extraordinary flood in Fuhe River, resulting in the collapse of the right bank. Using RADARSAT-2 data, we monitored the flood continuously. 3.2.Estimation of Forest Height with PolInSARForests respond significantly to environmental change. These changes may include increased , global warming, and associated precipitation changes. Another category of change is habitat and population fragmentation. Forests are important sources and sinks of carbon, which is a predominant factor in GEC. For homogeneous forests, the mean extinction coefficient can be retrieved based on some known tree heights, and this coefficient can characterize other regions of the forest. Then in the three-stage inversion process,39 the known mean extinction coefficient can be used to estimate the forest height. Meanwhile, the look-up table (LUT) is simplified to one dimension (Fig. 7). For temporal decorrelation, some volume coherent points are outside the two-dimensional LUT, and the nearest point with zero extinction coefficients in the LUT will be searched for forest height inversion [Fig. 7(a)]. However, in the one-dimensional LUT, we can search the volume coherence based on the minimum phase difference, which can partly reduce the effect of decorrelation [Fig. 7(b)]. The performance of this approach is demonstrated using fully polarimetric data acquired by RADARSAT-2 over Tiantan Park in Beijing. There are sparse cypress trees in this park, and despite the relatively short wavelength, the radar signal can still penetrate the forest layer. The results indicate that the PolInSAR overestimates the tree height and the RADARSAT-2 is still a potential data for the PolInSAR applications (Fig. 8) in large area tree height quick mapping. 3.3.Spatiotemporal Distribution of the Shule River Alluvial FanThere are many alluvial fans in the northern foot of Qilian Mountain, located in northwestern China. The largest one is the Shule River alluvial fan. Covering an area of , it is part of the super alluvial fan in the front of the mountains (Fig. 9). Its scale and location make it an ideal study area for remote sensing alluvial fan research. RADARSAT-2 fine mode PolSAR data acquired for the Shule River alluvial fan over the location is shown in the red rectangle in Fig. 9. The Pauli basis RGB image is shown in Fig. 10, where red, green, and blue represent HH-VV, 2HV, and HH+VV, respectively. Combined with the covering and cutting features of alluvial fan surfaces derived from SAR data and field survey data, it is generally considered that about five alluvial fan units from the Quaternary period are exposed in the study area. Three formed in the Late Pleistocene, Q3a, Q3b, and Q3c, respectively, as shown in Fig. 10, while the other two alluvial fan units formed in the Holocene, Q4a, and Q4b. Research results of an analysis of the relationship between the characteristic parameters and the alluvial fan units demonstrate that the following polarimetric parameters are sensitive to alluvial fan units of different ages: backscattering coefficients with HH, HV, and VV polarization states; the coherency entropy (H), and the anisotropy (A), derived using Cloude’s decomposition method. These are shown in Figs. 11(a) and 11(b). These parameters follow an increasing trend with increasing age in the Holocene period and then decrease quickly with increasing exposure time in the Late Pleistocene, while the highest value occurs in the alluvial fan unit, which was probably formed near the end of Late Pleistocene (Q3c). Fig. 11(a) Plot of backscattering coefficients for each alluvial fan unit. (b) Plot of H and A for each alluvial fan unit. (c) Spatial distribution of the Shule River alluvial fan.  Based on these characteristic parameters, the maximum likelihood classification method can be used to map the spatial distribution of the different alluvial fan units. The result is shown in Fig. 11(c) and indicates that the alluvial fan units can be effectively delimited using SAR imagery. Alluvial fans in arid and semiarid regions provide an important record of neotectonics and climate change, which reveal the spatiotemporal evolution of the regional environment. SAR remote sensing, which is sensitive to geomorphological features, plays an important role in mapping alluvial fan surfaces. 3.4.Impervious SurfacesIn our work, a total of 45 PolSAR features were extracted from RADARSAT-2 full polarimetric data (HH/HV/VH/VV) by the PolSARpro and the software developed by the authors. A case study of a dense urban area (Beijing, China, Fig. 12) was conducted by applying an SVM algorithm to RADARSAT-2 full PolSAR data. Two sample sites were selected to demonstrate this potential of SAR data. One site is in Beijing’s Olympic Park [Fig. 13(c)]; the other is in Beijing’s Imperial Palace [Fig. 13(d)]. The final polarimetric features are selected through a stepwise process (Fig. 1) listed in Table 4. Fig. 13Impervious surface maps derived from RADARSAT-2 data using the support vector machine (SVM) method in four selected sample sites corresponding to the four areas [(a), (b), (c), and (d)] in the figure. (a) Railroad estimation. (b) Asphalt road extraction. (c) and (d) Extraction of impervious surfaces covered by tree crowns. 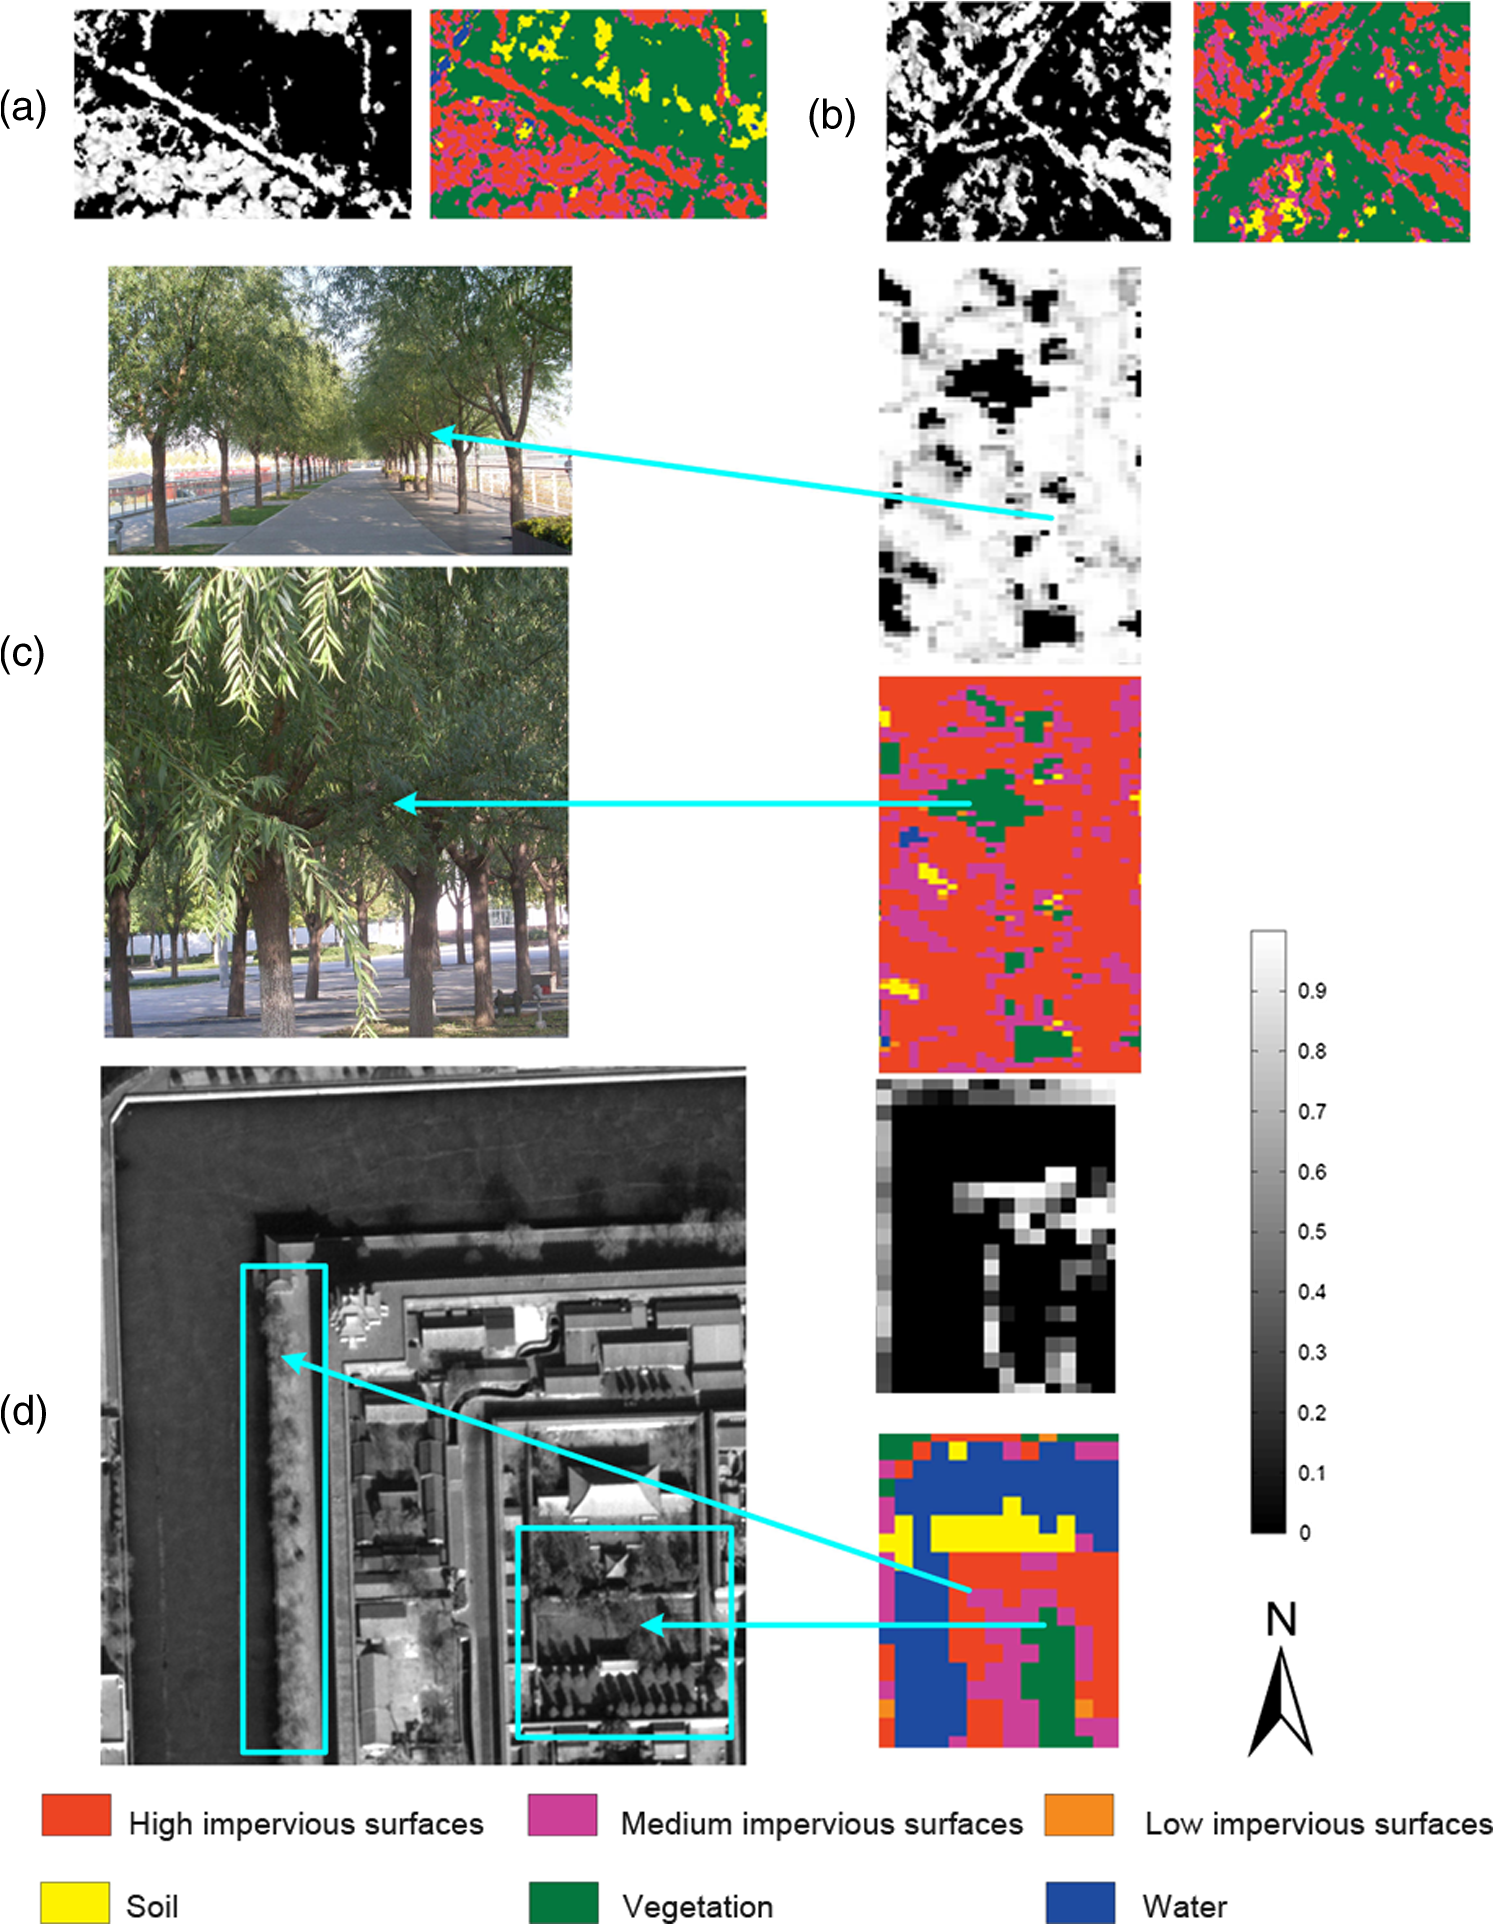 Table 4The final polarimetric features selected for classification through a stepwise process.
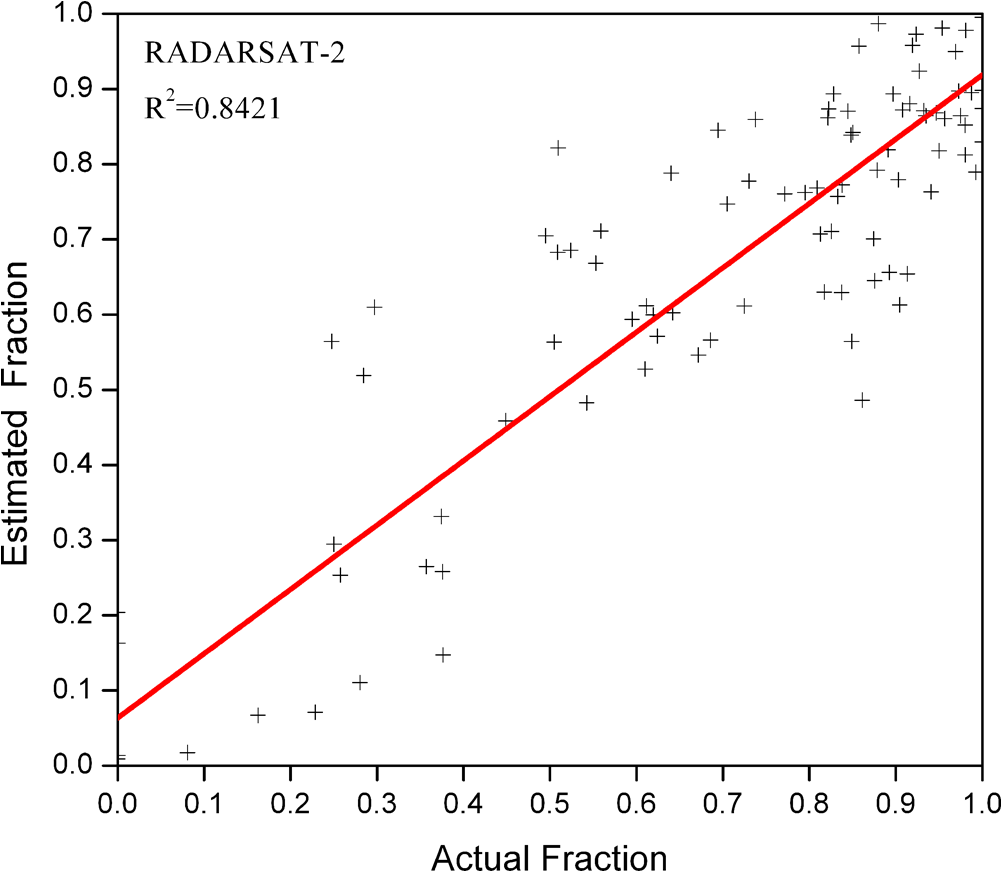
Figure 12 shows the impervious surfaces extracted from the RADARSAT-2 full PolSAR data, using the SVM method, in Beijing. In Fig. 12, the right image shows the percent impervious surfaces (PIS) with values ranging from 0 to 1, while the left image shows the percent impervious surfaces reclassified into six categories: high PIS (with values ), medium PIS (with values between 0.5 and 0.9), low PIS (with values ), bare soil, vegetation (forest and crop), and water. Figure 13 shows impervious surface maps derived from RADARSAT-2 data using the SVM method in four selected sample sites corresponding to the four areas [(a), (b), (c), and (d)] in Fig. 12. In Fig. 13, sample sites (a) and (b) highlight estimated railroads and asphalt roads, respectively, while sites (c) and (d) represent the extraction of impervious surfaces covered by tree crowns. Figures 12 and 13 indicate the following: In the PIS classification image, some crop classes were misclassified to bare soil in the image derived from RADARSAT-2 data (Fig. 13). That is a result of RADARSAT-2 PolSAR (C-band) having better canopy penetration as, on March 8, 2009, the main crop in the study area was small, short winter wheat, and C-band penetrates the wheat stalks and identifies bare soil. In a selected sample area [Fig. 13(a)], because of stronger backscatter in the SAR image, the railroads can be extracted from the full PolSAR data. In Fig. 13(c), the two left photos were taken on the ground, and in Fig. 13(d), the left image is a WorldView image (acquired on February 11, 2009) with a spatial resolution of 0.5 m. The right maps in Figs. 13(c) and 13(d) are urban impervious surface maps derived from RADARSAT-2 data using the SVM method. The impervious surfaces covered by tree crowns can be easily extracted from the RADARSAT-2 PolSAR data in sparse tree areas, while, because of the limited penetration, it is difficult for PolSAR data to extract the impervious surfaces covered by tree crowns in dense tree areas. Therefore, PolSAR imagery has enormous potential for extracting impervious surfaces covered by tree crowns in wooded areas, especially where there is sparse cover. For RADARSAT-2 data, as a significant part of urban impervious surfaces, the entire road area (such as asphalt roads and railroads) might be either occluded or covered by layover from adjacent buildings or trees. Hence, roads in an along-track orientation sometimes cannot be seen at all in dense urban scenes. In summary, urban roads derived from RADARSAT-2 data are basically fully extracted; nonetheless, some gaps are visible in a number of roads [Fig. 13(b)]. Intrinsic characteristics of SAR imagery, i.e., layover and shadow effects, become a severe problem for extracting impervious surfaces, especially in dense urban areas. In our research, those characteristics were not considered. To assess the accuracy of impervious surface estimation, a total of 100 sites of were randomly sampled. For each sample, the impervious surfaces were digitized on corresponding high-quality WorldView images with a spatial resolution of 0.5 m. Finally, three statistical indicators—root mean square error (RMSE), mean absolute error (MAE), and the coefficient of determination ()—were used to evaluate the accuracy of the impervious surfaces percentage (ISP) estimation. The results summarized in Table 5 show that RADARSAT-2 imagery allows for high accurate estimation. RADARSAT-2 yields results with an RMSE of 13.27%, an MAE of 9.98%, and an of 0.8421. Figure 14 shows the scatter plots of the accuracy assessment. This result also indicates that RADARSAT-2 has enormous potential for extracting impervious surfaces. Table 5Accuracy assessment of ISP estimation results.
Monitoring and managing the urban environment is an increasingly important issue across a range of disciplines. The environmental impacts of urbanization are mostly from different impervious surfaces. In recent years, impervious surfaces have become an important indicator in assessing urban ecological conditions because they are related to many environmental problems, such as water quality, stream health, the urban heat island effects, etc. Therefore, impervious surface-related environmental issues, as well as increased concerns about rapid urbanization worldwide, have resulted in a surge of research interest in impervious surfaces. 4.ConclusionsGEC is an important challenge facing mankind and a priority for governments and international research organizations around the world. Now, a number of recently developed techniques, including various remote sensing techniques, are being used in studying GEC. Remote sensing techniques have special advantages in GEC studies over large areas requiring frequent, repetitive coverage. This paper draws attention to the application of advanced RARDATSAT-2 SAR data in studying GEC sensitive factors. We only demonstrated four GEC factors in this paper, including flood monitoring, tree height inversion, alluvial fan monitoring, and urban impervious surface extraction, but a number of other GEC factors, such as glaciers and snow cover, could be monitored by RADARSAT-2 as well. From the examples above, we can see that the full polarization, left- and right-looking capabilities of RADARSAT-2 provide powerful capacity for monitoring sensitive factors of GEC. AcknowledgmentsThis research is supported by the Basic Research Program of China (973 Program No. 2009CB723906), and the Natural Science Foundation of China (61132006, 41120114001). The authors would like to thank China Earth Observation Capacity Building Centre (CBCEO) initiated by Earth Sciences Sector, Natural Resources Canada, and Chinese Academy of Sciences; thanks to our contact person, Dr. Frederick Campbell, for his full support of the project; our thanks to the project manager of Canada Centre for Remote Sensing (CCRS), Dr. Brian Brisco, for his help with the ancillary data for the sites of interest. We would like to thank the CCRS and MDA for their data support. ReferencesL. L. Hesset al.,
“Dual-season mapping of wetland inundation and vegetation for the central Amazon basin,”
Remote Sens. Environ., 87
(4), 404
–428
(2003). http://dx.doi.org/10.1016/j.rse.2003.04.001 RSEEA7 0034-4257 Google Scholar
E. S. Kasischkeet al.,
“Effects of seasonal hydrologic patterns in south Florida wetlands on radar backscatter measured from ERS-2 SAR imagery,”
Remote Sens. Environ., 88
(4), 423
–441
(2003). http://dx.doi.org/10.1016/j.rse.2003.08.016 RSEEA7 0034-4257 Google Scholar
G. ShenH. GuoJ. Liao,
“Object oriented method for detection of inundation extent using multi-polarized synthetic aperture radar image,”
J. Appl. Remote Sens., 2
(1), 23512
(2008). http://dx.doi.org/10.1117/1.2911669 1931-3195 Google Scholar
R. N. TreuhaftP. R. Siqueira,
“The vertical structure of vegetated land surfaces from interferometric and polarimetric radar,”
Radio Sci., 35
(1), 141
–177
(2000). http://dx.doi.org/10.1029/1999RS900108 RASCAD 0048-6604 Google Scholar
T. MetteK. PapathanassiouI. Hajnsek,
“Biomass estimation from polarimetric SAR interferometry over heterogeneous forest terrain,”
in Proc. IEEE Int. Geoscience and Remote Sensing Symp.,
511
–514
(2004). Google Scholar
A. T. Caicoyaet al.,
“Biomass estimation as a function of vertical forest structure and forest height. Potential and limitations for radar remote sensing,”
in Proc. of 8th European Conf. on Synthetic Aperture Radar,
901
–904
(2010). Google Scholar
W. B. Bull,
“The alluvial fan environment,”
Prog. Phys. Geogr., 1
(2), 222
–270
(1977). http://dx.doi.org/10.1177/030913337700100202 PPGEEC 0309-1333 Google Scholar
W. B. Bull, Geomorphic Responses to Climatic Change, Oxford University Press, New York
(1991). Google Scholar
P. W. Birkeland, Soils and Geomorphology, Oxford University Press, New York
(1999). Google Scholar
K. K. Nicholset al.,
“Dates and rates of arid region geomorphic processes,”
GSA Today, 16
(8), 4
–11
(2006). http://dx.doi.org/10.1130/GSAT01608.1 1052-5173 Google Scholar
R. I. Dorn,
“The role of climatic change in alluvial fan development,”
Geomorphology of Desert Environments, 723
–742 2nd ed.Springer Science+Business Media B.V., Netherlands
(2009). Google Scholar
K. S. Kierein-Young,
“The integration of optical and radar data to characterise mineralogy and morphology of surfaces in Death Valley, California, USA,”
Int. J. Remote Sens., 18
(7), 1517
–1541
(1997). http://dx.doi.org/10.1080/014311697218250 IJSEDK 0143-1161 Google Scholar
T. G. FarrO. A. Chadwick,
“Geomorphic processes and remote sensing signatures of alluvial fans in the Kun Lun Mountains, China,”
J. Geophys. Res., 101
(E10), 23091
–23100
(1996). http://dx.doi.org/10.1029/96JE01603 JGREA2 0148-0227 Google Scholar
O. Crouviet al.,
“Quantitative mapping of arid alluvial fan surfaces using field spectrometer and hyperspectral remote sensing,”
Remote Sens. Environ., 104
(1), 103
–117
(2006). http://dx.doi.org/10.1016/j.rse.2006.05.004 RSEEA7 0034-4257 Google Scholar
K. L. FrankelJ. F. Dolan,
“Characterizing arid region alluvial fan surface roughness with airborne laser swath mapping digital topographic data,”
J. Geophys. Res., 112
(F2), F02025
(2007). http://dx.doi.org/10.1029/2006JF000644 JGREA2 0148-0227 Google Scholar
C. L. ArnoldC. J. Gibbons,
“Impervious surface coverage: the emergence of a key environmental indicator,”
J. Am. Plann. Assoc., 62
(2), 243
–258
(1996). http://dx.doi.org/10.1080/01944369608975688 JAPAD9 0194-4363 Google Scholar
Q. WengX. HuD. Lu,
“Extracting impervious surfaces from medium spatial resolution multispectral and hyperspectral imagery: a comparison,”
Int. J. Remote Sens., 29
(11), 3209
–3232
(2008). http://dx.doi.org/10.1080/01431160701469024 IJSEDK 0143-1161 Google Scholar
D. LuQ. Weng,
“Extraction of urban impervious surfaces from an IKONOS image,”
Int. J. Remote Sens., 30
(5), 1297
–1311
(2009). http://dx.doi.org/10.1080/01431160802508985 IJSEDK 0143-1161 Google Scholar
U. Stillaet al.,
“Road extraction from SAR imagery,”
Remote Sensing of Impervious Surfaces, 179
–214 CRC Press, Boca Raton, FL
(2008). Google Scholar
L. Jianget al.,
“Synergistic use of optical and InSAR data for urban impervious surface mapping: a case study in Hong Kong,”
Int. J. Remote Sens., 30
(11), 2781
–2796
(2009). http://dx.doi.org/10.1080/01431160802555838 IJSEDK 0143-1161 Google Scholar
J. J. Van der Sanden,
“Anticipated applications potential of RADARSAT-2 data,”
Can. J. Remote Sens., 30
(3), 369
–379
(2004). http://dx.doi.org/10.5589/m04-001 CJRSDP 0703-8992 Google Scholar
B. Briscoet al.,
“SAR polarimetric change detection for flooded vegetation,”
Int. J. Digital Earth, 6
(2), 103
–114
(2013). http://dx.doi.org/10.1080/17538947.2011.608813 1753-8947 Google Scholar
L. C. Graham,
“Synthetic interferometric radar for topographic mapping,”
Proc. IEEE, 62
(6), 763
–768
(1974). http://dx.doi.org/10.1109/PROC.1974.9516 IEEPAD 0018-9219 Google Scholar
F. Garestieret al.,
“Forest height inversion using high-resolution P-band Pol-InSAR data,”
IEEE Trans. Geosci. Remote Sens., 46
(11), 3544
–3559
(2008). http://dx.doi.org/10.1109/TGRS.2008.922032 IGRSD2 0196-2892 Google Scholar
B. Merceret al.,
“Forest height and ground topography at L-band from an experimental single-pass airborne Pol-InSAR system,”
in Proc. of 4th Int. Workshop on Science and Applications of SAR Polarimetry and Polarimetric Interferometry,
16
(2009). Google Scholar
J. PraksM. HallikainenX. Yu,
“Studies of phase center and extinction coefficient of boreal forest using X- and L-band polarimetric interferometry combined with lidar measurements,”
in Proc. of 4th Int. Workshop on Science and Applications of SAR Polarimetry and Polarimetric Interferometry,
65
(2009). Google Scholar
R. N. Treuhaftet al.,
“Vegetation characteristics and underlying topography from interferometric data,”
Radio Sci., 31
(6), 1449
–1495
(1996). http://dx.doi.org/10.1029/96RS01763 RASCAD 0048-6604 Google Scholar
F. Garestieret al.,
“Pine forest height inversion using single-pass X-band PolInSAR data,”
IEEE Trans. Geosci. Remote Sens., 46
(1), 59
–68
(2008). http://dx.doi.org/10.1109/TGRS.2007.907602 IGRSD2 0196-2892 Google Scholar
S. R. CloudeE. Pottier,
“A review of target decomposition theorems in radar polarimetry,”
IEEE Trans. Geosci. Remote Sens., 34
(2), 498
–518
(1996). http://dx.doi.org/10.1109/36.485127 IGRSD2 0196-2892 Google Scholar
D. G. CorrA. F. Rodrigues,
“Alternative basis matrices for polarimetric decomposition,”
in Proc. of 4th European Conf. on Synthetic Aperture Radar,
597
–600
(2002). Google Scholar
R. Touzi,
“Target scattering decomposition in terms of roll-invariant target parameters,”
IEEE Trans. Geosci. Remote Sens., 45
(1), 73
–84
(2007). http://dx.doi.org/10.1109/TGRS.2006.886176 IGRSD2 0196-2892 Google Scholar
C. HuangL. S. DavisJ. R. G. Townshend,
“An assessment of support vector machines for land cover classification,”
Int. J. Remote Sens., 23
(4), 725
–749
(2002). http://dx.doi.org/10.1080/01431160110040323 IJSEDK 0143-1161 Google Scholar
G. ZhuD. G. Blumberg,
“Classification using ASTER data and SVM algorithms,”
Remote Sens. Environ., 80
(2), 233
–240
(2002). http://dx.doi.org/10.1016/S0034-4257(01)00305-4 RSEEA7 0034-4257 Google Scholar
G. M. FoodyA. Mathur,
“A relative evaluation of multiclass image classification by support vector machines,”
IEEE Trans. Geosci. Remote Sens., 42
(6), 1335
–1343
(2004). http://dx.doi.org/10.1109/TGRS.2004.827257 IGRSD2 0196-2892 Google Scholar
M. PalP. M. Mather,
“Support vector machines for classification in remote sensing,”
Int. J. Remote Sens., 26
(5), 1007
–1011
(2005). http://dx.doi.org/10.1080/01431160512331314083 IJSEDK 0143-1161 Google Scholar
T. Eschet al.,
“Large-area assessment of impervious surface based on integrated analysis of single-date Landsat-7 images and geospatial vector data,”
Remote Sens. Environ., 113
(8), 1678
–1690
(2009). http://dx.doi.org/10.1016/j.rse.2009.03.012 RSEEA7 0034-4257 Google Scholar
Z. C. Sunet al.,
“Estimating urban impervious surfaces from Landsat-5 TM imagery using multi-layer perceptron neural network and support vector machine,”
J. Appl. Remote Sens., 5 053501
(2011). http://dx.doi.org/10.1117/1.3539767 1931-3195 Google Scholar
H. E. HuppertR. S. J. Sparks,
“Extreme natural hazards: population growth, globalization and environmental change,”
Philos. Trans. R. Soc. Lond. A: Math. Phys. Eng. Sci., 364
(1845), 1875
–1888
(2006). http://dx.doi.org/10.1098/rsta.2006.1803 PTRMAD 1364-503X Google Scholar
S. R. CloudeK. P. Papathanassiou,
“Three-stage inversion process for polarimetric SAR interferometry,”
IEE Proc. Radar Sonar Navig., 150
(3), 125
–134
(2003). http://dx.doi.org/10.1049/ip-rsn:20030449 1350-2395 Google Scholar
BiographyHuadong Guo graduated from the Geology Department at Nanjing University in 1977 and received his MSc degree from the Graduate University of the Chinese Academy of Science (CAS) in 1981. He is a guest professor at eight universities in China and has written more than 200 publications, including 16 books. Current research includes radar remote sensing, applications of Earth observing technologies to global change, and Digital Earth. Guang Liu received his BS and MS in physics from TsingHua University of China in 1999 and 2002, respectively, and received his PhD degree from the Institute of Remote Sensing Applications of the CAS in 2008. He worked in the MGP, TU Delft, from 2006 to 2007 as a visiting researcher. He is an associate professor of Institute of Remote Sensing and Digital Earth, CAS. His work is focused on the study of feasibility and potential applications of synthetic aperture radar (SAR) image time series analysis. Jingjuan Liao received her BS and MS degrees in geosciences from Nanjing University, respectively, in 1987 and 1990, and her PhD degree in geophysics from the Institute of Geophysics, CAS, in 1993. Since 1993, she worked on radar data for vegetation discrimination and classification, biomass estimation, and related radar backscatter modeling. Her current research interests are focused on microwave remote sensing for surface parameters estimation and on the integration of remote sensing observations in wetlands and lakes. Xinwu Li is a professor of the Institute of Remote Sensing and Digital Earth, CAS. He received an SAR remote sensing PhD degree from the Institute of Remote Sensing Application, CAS. He is an author of more than 30 journal papers. His current research interests include polarimetric and interferometric SAR remote sensing. Lu Zhang is an associate professor at Key Laboratory of Digital Earth Science, Institute of Remote Sensing and Digital Earth, CAS. He received his PhD degree in SAR remote sensing from the Institute of Remote Sensing Application, CAS, in 2008. He is the author of more than 30 journal papers for SAR remote sensing. His current research interests include information extraction and physical parameter estimation using polarimetric SAR images. Guozhuang Shen is an assistant professor in the Institute of Remote Sensing and Digital Earth, CAS, after receiving PhD from Institute of Remote Sensing Applications, CAS. Now, he mainly does research on flood inundation information extraction and wetland ecosystems. Wenxue Fu is an associate professor at Key Laboratory of Digital Earth Science, Institute of Remote Sensing and Digital Earth, CAS. He received his PhD degree from Nanjing University in 2008. His current research interests include information extraction and physical parameter estimation using polarimetric SAR images. Zhongchang Sun is a research assistant in the Institute of Remote Sensing and Digital Earth, CAS. He received his SAR remote sensing PhD degree from the Center for Earth Observation and Digital Earth, CAS. His current research interests include urban environmental remote sensing and polarimetric SAR remote sensing. |
|||||||||||||||||||||||||||||||||||||||||||||||||||||||||||||||||||||||||||||||||||||||||||||||||||||||||||||||||||||||||||||||||||||||||||||||||||