|
|
1.IntroductionThe Russian wheat aphid (RWA: Diuraphis noxia) is one of the economically important insect pests of wheat (Triticum aestivum L.) and barley (Hordeum vulgare L.) around the world.1,2 While feeding, the RWA injects toxin into plants manifesting into a variety of stress symptoms. These symptoms are expressed as white, reddish-purple, or yellow longitudinal streaks on leaves and stems and rolling and stunting of either stems or leaves.1 Stunting in heavily infested plants leads to reductions in plant and stem height, leaf area, root development, chlorophyll concentration, grain mass, and vegetative biomass.1,3,4 Plant stress due to the RWA is a combination of developmental, biochemical, physiological, and morphological responses. Plant growth stages, time and duration of feeding, nutritional status of the host plants, aphid abundance, and other environmental factors all can affect plant responses to RWA feeding.5 The RWA infestations in wheat usually are not uniform, but rather occur in clusters referred to as “hot spots” based on assessment of visible damage symptoms by the naked eye. Applying pesticides to only the infested patches would reduce RWA control costs. These hot spots could be spatially recognized within fields and site specific insect management plans could be implemented to hot spots only. Although the RWA is widely distributed around the world, its economic impact on small grains has been assessed only in Ethiopia, South Africa, Canada, and the United States (US).3,4 Studies indicate that economic injury levels due to RWA feeding in small grains vary within a given region or among regions.3,4 In favorable conditions, RWA infestation can result in heavy damage to wheat and barley in a short period of time.3 Wheat yield losses due to RWA infestation were estimated to be 37% in the Canadian Prairies,6 between 35% and 60% in South African wheat fields and between 41% and 79% in barley fields in Ethiopia.3 In the United States (US), the RWA reduced wheat grain yield up to 82.9% and vegetative biomass up to 76.5% in Texas and Oklahoma Panhandles.3 Remote sensing has become increasingly an essential tool for monitoring and quantifying crop stress due to biotic and abiotic factors using a wide range of data sets.7,8 A large number of investigators9–11 have discussed the superiority of hyperspectral imaging sensors (also known imaging spectrometry) such as Airborne Imaging Spectroradiometer for Applications (AISA; Specim Inc., Oulu, Finland) over multispectral instruments such as Landsat Thematic Mapper. The former systems collect spectral information in continuous, narrow spectral channels, while the latter ones record spectral reflectance at a few wide, noncontinuous wavelengths separated by spectral segments where no measurements are taken. The hyperspectral system was designed to separate the surface optical properties into tens of bands with spectral resolution or smaller through the visible, near infrared (NIR), and mid-infrared regions of the electromagnetic spectrum (usually 400 to 2500 nm). These narrow and continuous bands provide ample spectral information to identify and distinguish between spectrally similar but unique surface materials.11–13 Consequently, hyperspectral imagery provides the potential for more detailed and accurate spectral information than multispectral images. Hyperspectral data have been applied to a wide range of agricultural crops, such as detecting crop stress and disease.14 Hyperspectral sensors can capture reflectance features of plant pigments and chemical compounds in plants, including lignin, cellulose, nitrogen, chlorophyll, carotenoids, and water.15 Another important characteristic of remotely sensed imagery for quantifying plant stress is the pixel size that represents the smallest area identifiable in the imagery. Higher spatial resolution imagery often contains detailed intraspecies spectral variability than lower resolution imagery, when stress occurs in small patches than the pixel size. For example, in cases where RWA hot spots in size could not be reliably detected using an image with 1-m pixel size due to hot spots being mixed with uninfested wheat within a pixel or among pixels. Timing, location, spectral, and spatial resolutions are all important for detecting stress over time and space. Several researchers argued that high-spatial resolution-based remote sensing is a better method to detect and quantify the impact of plant pathogens and insect infestations in vegetation compared with visual techniques because a vegetative unit can be repeatedly, objectively, and nondestructively examined in a fast, robust, accurate, and inexpensive way.16–19 Despite a wide range of space borne, airborne, and ground-based instruments have been widely investigated for identification and mapping insect infestation and disease occurrence in crops around the world20,21 and frequent infestations of RWA in the US and other countries, the application of very narrow banded (very high-spectral resolution) and high-spatial resolution hyperspectral imagery to RWA infestation at the commercial scale (e.g., field level) is not well studied. Ability to utilize these methods to discriminate and separate RWA infestation from uninfested areas within a field would improve monitoring population dynamics, understanding pest ecology, and developing long- and short-term site-specific management practices for RWA. Our primary objective was to evaluate the use of very narrow banded (average about 2.25 nm in the visible, 3.5 nm in the NIR regions, and 2.9 nm in the visible and NIR wavelengths) 1-m spatial resolution hyperspectral data and the constrained energy minimization (CEM) method for detecting and discriminating RWA feeding damage (RWA hot spots hereafter). The secondary objectives of our study were to (1) examine the spectral properties of RWA hot spots, uninfested wheat (control wheat hereafter), and mixed bare ground. Our study presents a unique application of hyperspectral data in terms of relative value of seasonal images for management application, high spatial and spectral resolution of hyperspectral data, and classification method presented for RWA hot spot detection. Our study initiates to fill an important gap in the application of hyperspectral imagery for detecting and discriminating RWA hot spots. Since the hyperspectral remote detection of RWA hot spots has not been well documented, our study presents the first application of hyperspectral data for discriminating RWA hot spots. 2.Materials and Methods2.1.Site DescriptionLocal RWA infestations in Baca County, Colorado, and Cimarron County, Oklahoma, were identified on April 19 and May 15, 2005. We selected three fields where RWA hot spots were distinctive for the study. Two of the fields (field 1 and 2 hereafter) were near city of Campo, Colorado (37° 13′ 16.61″, 26′ 05.19″ with an altitude for field 1 and 37° 08′ 52.12″, 41′ 15.71″ with an altitude for field 2) and the third field (field 3 hereafter) was near Boise City, Oklahoma (36° 40′ 20.09″, 25′ 19.394″ with an altitude ) (Fig. 1). Zadoks22 wheat growth stages were about 37 in fields 1 and 2 and 60 in field 3. 2.2.Imagery AcquisitionAn image collection flight was conducted over the study fields on April 21 in fields 1 and 2 and May 18, 2005, in field 3. An AISA mounted in a Cessna 172 airplane was used to acquire the images. The AISA is a hyperspectral pushbroom type airborne imaging spectrometer. It had a spectral resolution of 505 to 900 nm with bands ranging from 0.7 to 9.4 nm. Under typical conditions in the Cessna 172 airplane, the AISA can acquire between 20 and 60 bands at a spatial resolution between 1 and 4 m per pixel at 1000 and 4000 m flying heights from the ground elevation, respectively. It captures 384 pixels across each track with a 22.7-deg field of view. Resolution along each track for a single image is limited by a disk space of 2 GB. Downwelling irradiance was measured simultaneously via a fiber optic sensor mounted on the roof of the airplane. The downwelling irradiance was used to calibrate the image. Navigation data for georectification was collected by an onboard Boeing C-MIGITS II integrated inertial navigation system/global positioning system (INS/GPS; Systron Donner Inertial Division, Concord, California). Radiometric and geometric corrections were done using Caligeo image preprocessing software version 1.7 (Specim Inc., Oulu, Finland) using sensor specific calibration data. The images were atmospherically corrected using fast line-of-sight atmospheric analysis of spectral hypercubes in Environment for Visualizing Images software (ENVI; Exelis Visual Information Solutions, Boulder, Colorado). Image spatial resolution was 1 m with a flight height of about 1000 m. Each image consisted of 50 bands ranging from 509 to 885 nm. 2.3.Imagery ClassificationIn each field, 15 RWA hot spots with feeding damage visually estimated to be were identified and point coordinates of each hot spot were collected with a field computer equipped with a GPS receiver. The RWA feeding symptoms that were were not counted as hot spots in this study because at this low level of damage (e.g., with only a few small lesions on leaves and no rolling and stunting of either stems or leaves) it was difficult to identify stress. The 1-m image allowed clear visual identification of RWA hot spots that exhibited damage symptoms. We overlaid GPS point coordinates of the RWA hot spots on the images to insure one-to-one matching with visually identified locations in order to extract training samples for classification. Training samples were manually extracted from the imagery, consisted of 15 polygons (each of which had 15 pixels) from only RWA hot spots at locations identified both on the ground and on the image. At the same time, 15 undamaged control areas (each of which had 15 pixels) and 225 pixels of soil mixed with sparse wheat and dry plant materials (mixed bare ground hereafter) were visually located in fields 1 to 3 to collect spectral signatures (Fig. 2). Spectral reflectance for RWA hot spots, control wheat, and mixed bare ground collected from fields 1 to 3 was tested for statistical significance using paired -tests at in Microsoft Excel (Table 1). The paired -test analysis was based on the spectral data corresponding to the spectral profile presented in Fig. 2 for infested, uninfested, and mixed bare ground in fields 1 to 3. Fields 1 and 2 were sampled on April 21 to 23, 2005, and field 3 was sampled on May 18, 2005. Fig. 2Mean reflectance spectra of Russian wheat aphid (RWA) infested wheat (mean of 225 training pixels/training polygons), uninfested wheat (mean of 225 pixels), and mixed bare ground (mean of 225 pixels) for fields 1 (a), 2 (b) and 3 (c). Fields were located in Baca County, Colorado (fields 1 and 2 sampled on 21 to 23 April, 2005), and Cimarron County, Oklahoma (field 3 sampled on May 18, 2005). Paired -test results of these spectra presented in Table 1.  Table 1Paired t-test comparison of the mean reflectance spectra of Russian wheat aphid (RWA) infested (mean of 225 training pixels), uninfested wheat (mean of 225 pixels), and mixed bare ground (mean of 255 pixels) for fields 1 to 3 (data obtained from Fig. 2). Fields were located in Baca County, Colorado (fields 1 and 2 sampled on April 21 to 23, 2005), and Cimarron County, Oklahoma (field 3 sampled on May 18, 2005).
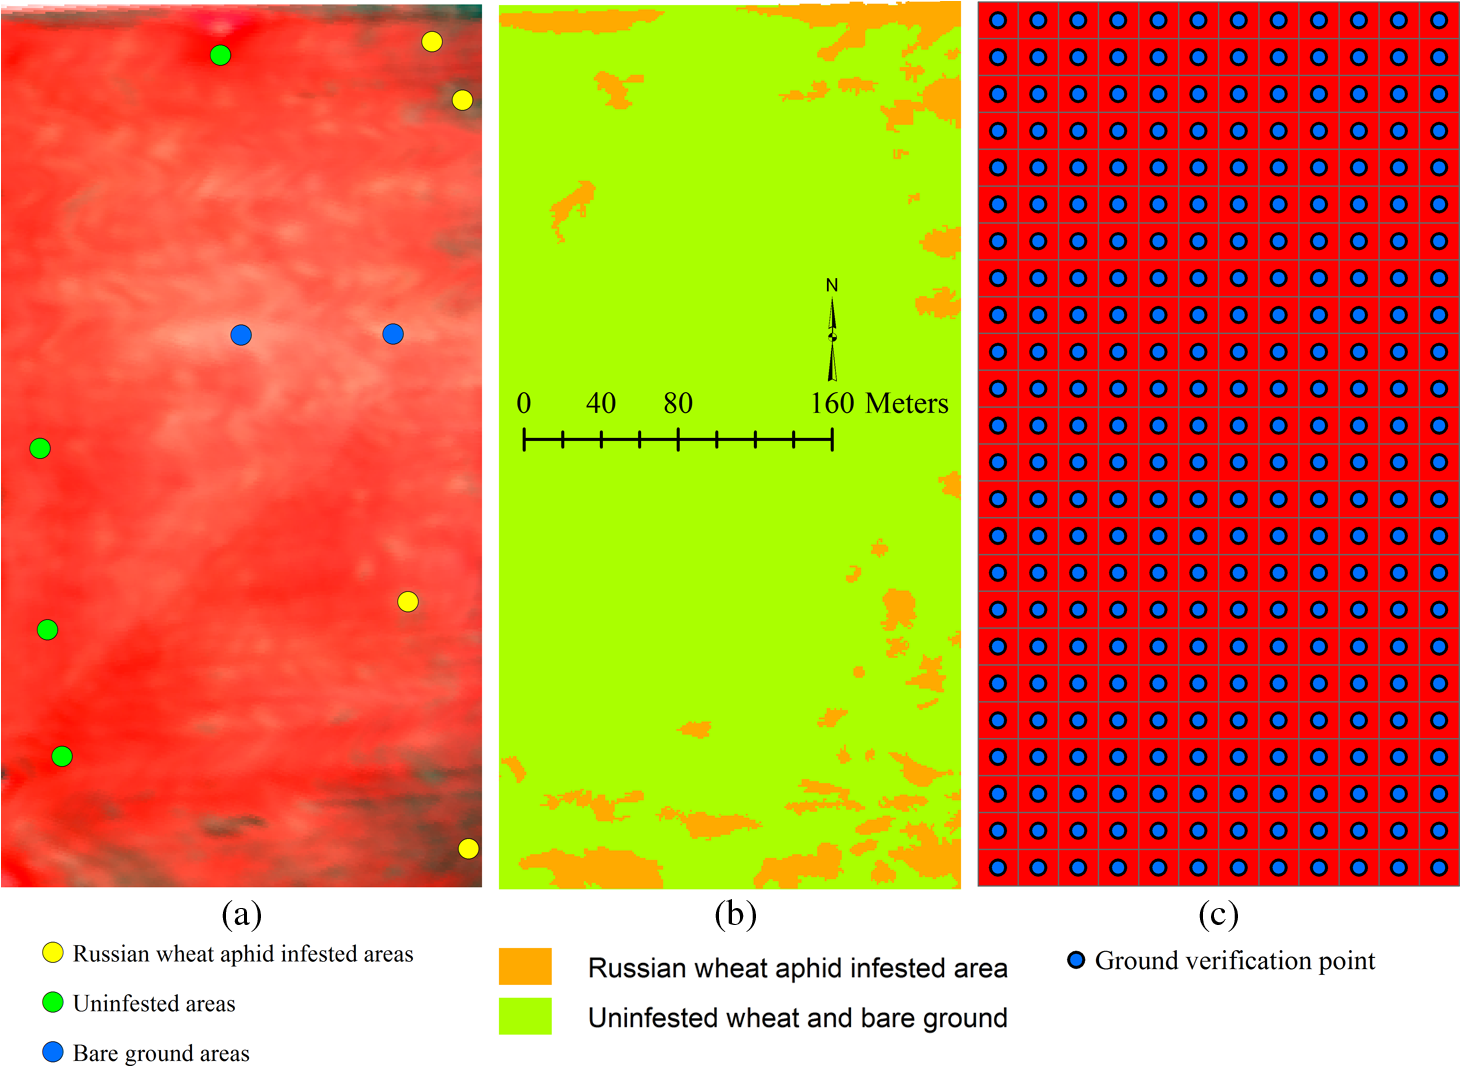
The image classification was performed for only RWA hot spots but not for uninfested wheat or mixed bare ground using the CEM classifier in ENVI (Figs. 3Fig. 4–5). The CEM method was developed for distinguishing subpixel abundance of image materials. Subpixel or soft classification techniques retain more information from mixed spectra within pixels. Since reflectance of a pixel is frequently consisted of more than one image element, spectral unmixing can be used to decompose the mixed spectra in order to identify subpixel fractions of each image component.23 Hence, the CEM relies on the endmember representing pure spectra of target object to be used in the classification procedure. The CEM is a nonlinear signal processing method that constructs a finite impulse response filter to perform matched filtering of an image. The technique minimizes the total energy in the image sequence while the response of the operator to the signature of interest is constrained to a desired constant level. The CEM enhances the response of a target signature, while suppressing the response of unknown or undesired background signatures and noise.24 The CEM method requires prior knowledge of a target endmember but it does not require that all image endmembers be defined.24 Therefore, rather than a target endmember, the reflectance spectra of different materials do not have to be identified either from pure pixels in an image or ground-collected endmember using a field spectroradiometer. The CEM generates a gray-scale fractional abundance image representing estimated relative degree of match to a target endmember. Thus, the CEM appears to be a good technique for identifying the fractional abundance of single-target material, such as RWA hot spots in our study. Fig. 3Color infrared hyperspectral imagery acquired over field 1 located in Baka County, Colorado, on April 21, 2005 (a), classified image using the constrained energy minimization (CEM) classifier (b), and sampling design for ground verification (c).  2.4.Accuracy AssessmentThe classification of remotely sensed imagery is a process of assigning variables into discrete categories of useful information. However, errors of classification occur because of mixed pixels, similar spectra of different materials, positional errors, and human errors.25 The most effective way to represent classification accuracy is via an error matrix.26 Therefore, the accuracy assessment for the classification was made by constructing an error matrix for each classified image, which compares on a group by group basis, the relationship between known actual (reference) categories as verified on the ground and corresponding classified categories. An error matrix is a square, with the number of columns and rows being equal to the numbers of categories whose classification accuracy is being evaluated.26 Error matrices for each classification map were generated by comparing the classified classes with the ground verification data. There is no single set standard for selection of the image and ground areas for comparison.25–27 Because a pixel in an image has an arbitrary location on the ground, and because positional errors of maps and GPS receivers become significant with small pixel sizes, areas based on geographic information system polygons are used frequently.26 Using individual pixels is appropriate if a per-pixel classification is assessed for accuracy, which avoids problems caused by generating “homogeneous” polygons on a landscape.28 It has been shown that pixel positional error results in conservative bias of the accuracy assessment;29 therefore, the unavoidable positional error introduced into this assessment would result in lower or conservative estimates of mapping accuracy.25 In addition to the accuracy assessment for the classified maps and individual land cover classes, the kappa coefficient was calculated. The kappa statistic is a measure of agreement or accuracy between the remote sensing–derived classification map and the ground verification data as indicated by (a) the major diagonal and (b) the chance agreement, which is indicated by row and column totals estimates. The kappa values range from 0 to 1, with values representing strong agreement between the classified map and ground truth, values between 0.40 and 0.80 indicate moderate agreement, and values representing poor agreement.30 2.5.Field ValidationFor the accuracy assessment, 560, 253, and 560 points with about 20-m equal spacing over the study fields 1 to 3 were generated using the “create fishnet” function in ArcMap, (ESRI, Inc. Redlands, California), respectively (Figs. 3Fig. 4–5). The training samples were not included in ground-truthing points. The ground-truthing points were exported to a field computer equipped with the Farm Works software package (CTN Data Service, Hamilton, Indiana) and a GPS receiver and were navigated on the ground for field verification. At each verification point within a 1-m radius area, presence of RWA or its feeding symptoms (leaf yellowing, chlorotic spots, and necrotic lesions) and absence of RWA were assessed. Error matrices for each classification map were generated by comparing the classified classes with the ground classes at these points. Error matrices to evaluate the classification accuracy were calculated and included overall accuracy, producer’s accuracy (percentage of reference pixels correctly classified), and user’s accuracy (percentage of pixels classified on the map which actually represent that group on the ground) and kappa coefficient. 3.ResultsMean reflectance spectra measured from RWA hot spots, control wheat, and mixed bare ground in fields 1 to 3 are presented in Fig. 2. Paired -test comparison of the mean reflectance spectra of training samples for the same land cover types shown in Fig. 2 are presented in Table 1. As expected, the spectral characteristics of the wheat canopies were markedly affected by RWA feeding in fields 1 to 3. The reflectance of RWA hot spots in the NIR region was significantly lower in contrast to significant increase in the visible spectrum due to RWA feeding. Control wheat canopies always captured significantly more or reflected significantly less light than the RWA hot spots in the range from 509 nm to the red edge shoulder around 730 nm. Beyond 730 nm, NIR reflectance from control wheat was significantly higher when compared with RWA hot spots. Mixed bare ground had significantly higher reflectance within the visible range of the spectrum and had significantly lower reflectance beyond the red edge shoulder (730 nm) when compared with both RWA hot spots and control wheat. The color infrared and classified maps of fields 1 to 3 for RWA hot spots are illustrated in Figs. 3Fig. 4–5. The CEM classifier produced result that was more similar to a pixel-based classification rather than a fractional abundance for RWA hot spots. This most likely occurred due to image with 1-m pixel size and training pixels with varying degree of RWA feeding damage that were extracted directly from image data in this study. Classifying an image with larger pixel size (e.g., 30 m) using ideal pure endmember spectra from spectral library or database may yield fractional abundance map. The error matrices that compare ground verification data with classified data for fields 1 to 3 are contained in Table 2. Overall mapping accuracies were 90%, 90%, and 93%, with a kappa value of 0.68, 0.70, and 0.77 for fields 1 to 3, respectively. About 27% of the control or mixed bare ground was included into RWA hot spots, whereas about 25% of RWA hot spots were misclassified as control or mixed bare ground by the classification method performed in field 1. In field 2, of RWA hot spots were excluded from the infested areas, whereas about 26% of control or mixed bare ground was included in RWA hot spots. About 18% of the control or mixed bare ground was included into RWA hot spots, whereas about 20% of RWA hot spots were misclassified as control or mixed bare ground by the classification method performed in field 3. Table 2Confusion matrices for fields 1 to 3 generated from the ground verification and classified data for RWA hot spots. Fields were located in Baca County, Colorado (fields 1 and 2 sampled on April 21 to 23, 2005) and Cimarron County, Oklahoma (field 3 sampled on May 18, 2005).
4.DiscussionThe presence of a disease, insect feeding, or deficiency in growth limiting factors leads to change in chemical-pigment concentrations, leaf area, and cell structure of the affected plant tissues. A significant increase in percent reflectance values from infested-wheat canopies in the visible region provided evidence that RWA feeding degraded the photosynthetic pigments and changed the leaf structure in wheat canopies. Since leaf structure has a strong influence on leaf spectral properties,31 the change in leaf structure because of RWA feeding resulted in optical differences between RWA-infested and uninfested wheat. The RWA feeding causes a reduction in chlorophyll a and b and carotenoids in infested plants. Apparently, the reduction in pigment concentrations, in addition to change in leaf structure, induced by RWA feeding created differences in visible light reflectance between infested and uninfested wheat. Symptoms from RWA infestation, in addition to leaf senescence, are often related to the decrease in NIR reflectance. In the present study, lower reflectance in the NIR region from infested wheat indicates that the RWA feeding reduced green leaf area by rolling and stunting and increased lesion formation. Spectral characteristics of uninfested and infested wheat by RWA found in this study are similar to the results found by previous studies.31,32–35 Spectral characteristics of field been (Vicia faba) leaf infected by Botrytis fabae,32 wheat infested by sunn pest (Eurygaster integriceps)33 and greenbug (Schizaphis graminum)31,34–35 showed similar patterns in reflectance from infested infected and health plants. Reflectance from infested-infected plants was lower in the NIR and higher in the visible spectrum than uninfected-uninfested plants studied.31–35 The method employed in this study distinguished infested wheat from uninfested wheat and mixed bare ground, but would not be able to easily separate other symptoms in wheat, especially greenbug feeding damage, when they co-occur with RWA infestation. However, none of these other wheat stresses due to biotic stressors were found during our detailed ground-level survey of fields studied. To test the utility of high spectral and spatial resolution hyperspectral data for remote detection and mapping of RWA infestation in wheat, the CEM subpixel mapping method was employed for the image classification. The accuracy assessments for RWA hot spots confirmed overall accuracies between 90% and 93%. This indicates that the method used in this study can be used for field level monitoring of RWA infestations during the growing seasons. High values of overall, producer’s, and user’s accuracies illustrate that healthy wheat and RWA-damaged wheat were detectable at the commercial field-scale with high spatial and spectral resolution hyperspectral images. In similar studies of other species, an overall accuracy of 80% for remote detection of yellow rust in winter wheat was found using the 1-m airborne hyperspectral imagery.36 The overall accuracies of 65.9% and 88.6% for winter wheat infected by leaf rust and powdery mildew using an airborne hyperspectral image with a spatial resolution of 4 m and a satellite image with a spatial resolution of 2.4 m were reported, respectively.37 Healthy and diseased wheat infected by yellow rust were discriminated with a success rate of 96% using spectral images collected with a spectrograph in a field study.38 The areas where sugarcane was infected by orange rust from disease free areas were distinguished using Hyperion imagery with 30 m by 30-m spatial resolution that can be used to detect orange rust disease in sugarcane.39 There is no set standard for classification accuracy as to what level of accuracy is adequate for remote detection of insect infestations and disease occurrence in wheat. The acceptable level of mapping accuracy depends on the project-based choice that differs based on the needs of the end users and utilization of the classification results.25,26 An accuracy target of 85% was recommended by Foody40 and an overall accuracy target of 85% with no individual class accuracy was suggested by Thomlinson et al.41 for vegetation mapping. Results from the image classifications for three fields indicated that the overall, producer’s, and user’s accuracies were all above these “recommended” guidelines. We achieved these high accuracies because we used a suitable classification algorithm, very narrow-banded hyperspectral imagery with 1-m spatial resolution, and a ground verification method that extended to the entire study area for RWA infestation. The image classification method had higher producer’s accuracies than user’s accuracies for fields 1 and 2 but producer’s accuracy was lower than user’s accuracy for field 3. Producer’s accuracy may be more important than user’s accuracy for detecting and controlling RWA infestation because undetected or omission (false negative) of RWA hot spots within a field is the factor that most likely hampers control efforts. One of the most likely utilizations of these accuracies would be to monitor wheat fields for RWA infestation over time and space. The consistent and repeatable classification methodology and the level of accuracies accomplished in this study would facilitate an accurate and efficient geographic information system (GIS)-based RWA management strategy. The ability to easily and repeatedly monitor wheat fields during the growing season, at low cost, is perhaps the greatest advantage of this approach for quantifying RWA infestations. It is more beneficial for the wheat producers to have RWA infestation information as early as possible. The image classifications for fields 1 and 2 had sufficient accuracies to enable a manager to make decisions regarding plans for treating this aphid pest. Classification and mapping of RWA hot spots on mid-spring images when the wheat is in the late jointing stage in this region of the US is important because the wheat crop has time to recover from RWA feeding damage during the rest of the growing season if RWA treatments are implemented early. However, this management practice may not be suitable for field 3 because wheat was in the late heading and flowering stage at which wheat crop might not have enough time to recover. The high dimensionality of hyperspectral data with narrow continuous bands and spectral resolution allowed identification and separation of RWA hot spots from the surrounding uninfested areas in commercial wheat fields. Many researchers argued the advantages of hyperspectral data over broadband multispectral data.15,30,42 Hyperspectral data have been very effective for detecting and mapping insect infestation and disease occurrence in field crops. Hyperspectral sensors with many narrow bands can capture a range of absorption features including biochemical constitutes, such as lignin, cellulose, chlorophylls, carotenes, water, and nitrogen. As biochemical concentrations vary in plants or leaves, absorption or reflectance spectra change as well.15 Our study provided an application of very narrow-banded hyperspectral imagery and a classification method to discriminate and map RWA hot spots in winter wheat that were sufficiently accurate to be used in a commercial field-level situation and could potentially facilitate management decisions regarding RWA treatment. Although our study detected RWA feeding damage in winter wheat in the Southern Great Plains of the US, this technology using high-resolution hyperspectral imagery and the CEM classification method could be applied with little or no modification to similar insect-infested small grain crops elsewhere in the world. 5.ConclusionsWidespread or localized infestations by RWA in winter wheat occur almost every year in the Great Plains of the US. These infestations by RWA result in significant yield loss and costs to control the pest. Precise and timely remote detection of RWA infestation in wheat is needed to facilitate control methods using precision agriculture and decrease economic losses caused by this pest. This study indicated that low to severe levels of RWA infestation in winter wheat could be detected accurately using high spectral and spatial resolution hyperspectral imagery and the CEM classification. High levels of accuracy were achieved using hyperspectral imagery with 1-m spatial resolution. Detection was accomplished early enough in the growing season to facilitate decisions regarding RWA treatment with pesticides, and was accurate enough to facilitate use of GIS-based precision farming pesticide application to infested patches only in fields 1 and 2. Such a practice for RWA management increases insecticide application efficiency and wheat yield and decreases the potential for environmental pollution. AcknowledgmentsOur special thanks to Robert Bowling and Roxanne Bowling for their help and beneficial discussion. We are thankful to Johnny Bible, Robert Villarreal, David Jones, Joy Newton, Sabina Mirik, Daniel Jiminez, and Timothy Johnson for technical assistance. This study was funded by the USDA-ARS Areawide Pest Management Program. Project Number: 500-44-012-00. ReferencesW. R. Cooper, J. W. Dillwith and G. J. Puterka,
“Salivary proteins of Russian wheat aphid (Hemiptera: Aphididae),”
Environ. Entomol., 39
(1), 223
–231
(2010). http://dx.doi.org/10.1603/EN09079 EVETBX Google Scholar
T. L. Randolph et al.,
“Plant responses to seven russian wheat aphid (hemiptera: Aphididae) biotypes found in the United States,”
J. Econ. Entomol., 102
(5), 1954
–1959
(2009). http://dx.doi.org/10.1603/029.102.0528 JEENAI 0022-0493 Google Scholar
M. Mirik et al.,
“Grain and vegetative biomass reduction by the Russian wheat aphid in winter wheat,”
Southwest. Entomol., 34
(2), 131
–157
(2009). http://dx.doi.org/10.3958/059.034.0203 SENTDD 0147-1724 Google Scholar
M. Mirik et al.,
“Reflectance characteristics of Russian wheat aphid (Hemiptera: Aphididae) stress and abundance in winter wheat,”
Comput. Electron. Agric., 57
(2), 123
–134
(2007). http://dx.doi.org/10.1016/j.compag.2007.03.002 CEAGE6 0168-1699 Google Scholar
M. Mirik et al.,
“Spectral vegetation indices selected for quantifying Russian wheat aphid (Diuraphis noxia) feeding damage in wheat (Triticum aestivum L.),”
Precis. Agric., 13
(4), 501
–516
(2012). http://dx.doi.org/10.1007/s11119-012-9264-7 1385-2256 Google Scholar
R. A. Butts et al.,
“Effect of fall infestations of Russian wheat aphid (Homoptera: Aphididae) on winter wheat yield and quality on the Canadian prairies,”
J. Econ. Entomol., 90
(4), 1005
–1009
(1997). JEENAI 0022-0493 Google Scholar
G. F. Backoulou et al.,
“Spatially discriminating Russian wheat aphid induced plant stress from other wheat stressing factors,”
Comput. Electron. Agric., 78
(2), 123
–129
(2011). http://dx.doi.org/10.1016/j.compag.2011.06.005 CEAGE6 0168-1699 Google Scholar
A. M. H. Elmetwalli et al.,
“Detecting and distinguishing moisture- and salinity-induced stress in wheat and maize through in situ spectroradiometry measurements,”
Remote Sens. Lett., 3
(4), 363
–372
(2012). http://dx.doi.org/10.1080/01431161.2011.599346 IGRSBY 1545-598X Google Scholar
K. Mansour, O. Mutanga and T. Everson,
“Remote sensing based indicators of vegetation species for assessing rangeland degradation: opportunities and challenges,”
Af. J. Agric. Res., 7
(22), 3261
–3270
(2012). http://dx.doi.org/10.5897/AJAR11.2316 Google Scholar
T. Mewes, J. Franke and G. Menz,
“Spectral requirements on airborne hyperspectral remote sensing data for wheat disease detection,”
Precis. Agric., 12
(6), 795
–812
(2011). http://dx.doi.org/10.1007/s11119-011-9222-9 1385-2256 Google Scholar
M. Mirik et al.,
“Spectral sensing of aphid (Hemiptera: Aphididae) density using field spectrometry and radiometry,”
Turk. J. Agric. For., 30
(6), 421
–428
(2006). TJAFEL 1300-011X Google Scholar
M. Mirik et al.,
“Hyperspectral one-meter-resolution remote sensing in Yellowstone National Park, Wyoming: II. Biomass,”
Rangeland Ecol. Manage., 58
(5), 459
–465
(2005). http://dx.doi.org/10.2111/04-18.1 1550-7424 Google Scholar
M. Mirik et al.,
“Hyperspectral one-meter-resolution remote sensing in Yellowstone National Park, Wyoming: I. Forage nutritional values,”
Rangeland Ecol. Manage., 58
(5), 452
–458
(2005). http://dx.doi.org/10.2111/04-17.1 1550-7424 Google Scholar
P. S. Thenkabail, Hyperspectral Remote Sensing of Vegetation, Toylar and Francis, New York
(2011). Google Scholar
K. S. He et al.,
“Benefits of hyperspectral remote sensing for tracking plant invasions,”
Divers. Distrib., 17
(3), 381
–392
(2011). http://dx.doi.org/10.1111/j.1472-4642.2011.00761.x 1366-9516 Google Scholar
D. Cammarano et al.,
“Use of the Canopy Chlorophyl Content Index (CCCI) for remote estimation of wheat nitrogen content in rainfed environments,”
Agron. J., 103
(6), 1597
–1603
(2011). http://dx.doi.org/10.2134/agronj2011.0124 AGJOAT 0002-1962 Google Scholar
Q. Cheng and X. Wu,
“Mapping paddy rice yield in Zhejiang Province using MODIS spectral index,”
Turk. J. Agric. For., 35
(6), 579
–589
(2011). http://dx.doi.org/10.3906/tar-1003-826 TJAFEL 1300-011X Google Scholar
S. Elsayed, B. Mistele and U. Schmidhalter,
“Can changes in leaf water potential be assessed spectrally?,”
Funct. Plant Biol., 38
(6), 523
–533
(2011). http://dx.doi.org/10.1071/FP11021 FPBUCP 1445-4408 Google Scholar
J. I. N. L. Zhao et al.,
“A comparative study on monitoring leaf-scale wheat aphids using pushbroom imaging and non-imaging ASD field spectrometers,”
Int. J. Agric. Biol., 14
(1), 136
–140
(2012). http://dx.doi.org/11–520/HKZ/2012/14–1–136–140 IJABAK 1560-8530 Google Scholar
E. M. Abdel-Rahman et al.,
“Potential of spectroscopic data sets for sugarcane thrips (Fulmekiola serrata Kobus) damage detection,”
Int. J. Remote Sens., 31
(15), 4199
–4216
(2010). http://dx.doi.org/10.1080/01431160903241981 IJSEDK 0143-1161 Google Scholar
I. Herrmann et al.,
“Spectral monitoring of two-spotted spider mite damage to pepper leaves,”
Remote Sens. Lett., 3
(4), 277
–283
(2012). http://dx.doi.org/10.1080/01431161.2011.576709 IGRSBY 1545-598X Google Scholar
J. C. Zadoks, T. T. Chang and C. F. Konzak,
“A decimal code for the growth stages of cereals,”
Weed Res., 14
(6), 415
–421
(1974). http://dx.doi.org/10.1111/wre.1974.14 WEREAT 1365-3180 Google Scholar
B. Somers et al.,
“Endmember variability in spectral mixture analysis: a review,”
Remote Sens. Environ., 115
(7), 1603
–1616
(2011). http://dx.doi.org/10.1016/j.rse.2011.03.003 IGRSBY 1545-598X Google Scholar
T. Bucha and H.-J. Stibig,
“Analysis of MODIS imagery for detection of clear cuts in the boreal forest in north-west Russia,”
Remote Sens. Environ., 112
(5), 2416
–2429
(2008). http://dx.doi.org/10.1016/j.rse.2007.11.008 IGRSBY 1545-598X Google Scholar
A. E. Parker Williams and E. R. Hunt,
“Accuracy assessment for detection of leafy spurge with hyperspectral imagery,”
J. Range Manage., 57
(1), 106
–112
(2004). http://dx.doi.org/10.2111/1551-5028(2004)057[0106:AAFDOL]2.0.CO;2 JRMGAQ 0022-409X Google Scholar
R. G. Congalton and K. Green, Assessing the Accuracy of Remotely Sensed Data: Principles and Practices, Lewis Publishers, Boca Raton, Florida
(2009). Google Scholar
Y. Ke and L. J. Quackenbush,
“A review of methods for automatic individual tree-crown detection and delineation from passive remote sensing,”
Int. J. Remote Sens., 32
(17), 4725
–4747
(2011). http://dx.doi.org/10.1080/01431161.2010.494184 IJSEDK 0143-1161 Google Scholar
L. L. F. Janssen and F. J. M. van der Wel,
“Accuracy assessment of satellite derived land-cover data: A review,”
Photogramm. Eng. Remmote Sens., 60
(4), 419
–426
(1994). PGMEA9 0099-1112 Google Scholar
D. L. Verbyla and T. O. Hammond,
“Conservative bias in classification accuracy assessment due to pixel- by-pixel comparison of classified images with reference grids,”
Int. J. Remote Sens., 16
(3), 581
–587
(1995). http://dx.doi.org/10.1080/01431169508954424 IJSEDK 0143-1161 Google Scholar
S. Narumalani et al.,
“Detecting and mapping four invasive species along the floodplain of North Platte River, Nebraska,”
Weed Technol., 23
(1), 99
–107
(2009). WETEE9 Google Scholar
W. E. Riedell and T. M. Blackmer,
“Leaf reflectance spectra of cereal aphid-damaged wheat,”
Crop Sci., 39
(6), 1835
–1840
(1999). http://dx.doi.org/10.2135/cropsci1999.3961835x CRPSAY Google Scholar
T. J. Malthus and A. C. Madeira,
“High resolution spectroradiometry: spectral reflectance of field bean leaves infected by Botrytis fabae,”
Remote Sens. Environ., 45
(1), 107
–116
(1993). http://dx.doi.org/10.1016/0034-4257(93)90086-D IGRSBY 1545-598X Google Scholar
H. Genc et al.,
“Vegetation indices as indicators of damage by the sunn pest (Hemiptera: Scutelleridae) to field grown wheat,”
Afr. J. Biotechnol., 7
(2), 173
–180
(2008). AJBFAH 1684-5315 Google Scholar
M. Mirik et al.,
“Hyperspectral spectrometry as a means to differentiate uninfested and infested winter wheat by greenbug (Hemiptera: Aphididae),”
J. Econ. Entomol., 99
(5), 1682
–1690
(2006). http://dx.doi.org/10.1603/0022-0493-99.5.1682 JEENAI 0022-0493 Google Scholar
M. Mirik et al.,
“Using digital image analysis and spectral reflectance data to quantify damage by greenbug (Hemiptera: Aphididae) in winter wheat,”
Comput. Electron. Agric., 51
(1), 86
–98
(2006). http://dx.doi.org/10.1016/j.compag.2005.11.004 CEAGE6 0168-1699 Google Scholar
J. Zhang et al.,
“Development, evaluation and application of a spectral knowledge base to detect yellow rust in winter wheat,”
Precis. Agric., 12
(5), 716
–731
(2011). http://dx.doi.org/10.1007/s11119-010-9214-1 1385-2256 Google Scholar
J. Franke and G. Menz,
“Multi-temporal wheat disease detection by multi-spectral remote sensing,”
Precis. Agric., 8
(3), 161
–172
(2007). http://dx.doi.org/10.1007/s11119-007-9036-y 1385-2256 Google Scholar
C. Bravo et al.,
“Early disease detection in wheat fields using spectral reflectance,”
Biosyst. Eng., 84
(2), 137
–145
(2003). http://dx.doi.org/10.1016/S1537-5110(02)00269-6 BEINBJ 1537-5110 Google Scholar
A. Apan et al.,
“Detecting sugarcane ‘orange rust’ disease using EO-1 Hyperion hyperspectral imagery,”
Int. J. Remote Sens., 25
(2), 489
–498
(2004). http://dx.doi.org/10.1080/01431160310001618031 IJSEDK 0143-1161 Google Scholar
G. M. Foody,
“Status of land cover classification accuracy assessment,”
Remote Sens. Environ., 80
(1), 185
–201
(2002). http://dx.doi.org/10.1016/S0034-4257(01)00295-4 IGRSBY 1545-598X Google Scholar
J. R. Thomlinson, P. V. Bolstad and W. B. Cohen,
“Coordinating methodologies for scaling landcover classifications from site-specific to global: Steps toward validating global map products,”
Remote Sens. Environ., 70
(1), 16
–28
(1999). http://dx.doi.org/10.1016/S0034-4257(99)00055-3 IGRSBY 1545-598X Google Scholar
M. Mirik et al.,
“Remote detection of a noxious weed (musk thistle: Carduus nutans) using airborne hyperspectral imagery and the support vector machine classifier,”
Remote Sens., 5
(2), 612
–630
(2013). http://dx.doi.org/10.3390/rs5020612 RSEND3 2072-4292 Google Scholar
BiographyMustafa Mirik is an associate research scientist with Texas A&M AgriLife Research at Vernon, Texas. His research involves in the use of geospatial sciences and technologies for natural recourse assessment and management. He received a BS degree in forest engineering from Istanbul University, Turkey, in 1992, an MS degree in natural resource ecology and management from Oklahoma State University in 1997, and a PhD in natural resource sciences from North Dakota State University in 2001. R. James Ansley is a professor of rangeland ecology at the Texas A&M AgriLife Research Center in Vernon, Texas. His areas of interest are rangeland shrub ecology, bioenergy, fire ecology, and range plant ecophysiology. His current research focus is to quantify the ecological impact of woody plant encroachment in semi-arid grasslands. He also teaches Intro to Biology as an adjunct instructor at Vernon College. Karl Steddom is an instructor of biology and agriculture at Kilgore College, Kilgore, Texas. He received his BS from California State Polytechnic University, Pomona, and his PhD from University of California, Riverside. Charles M. Rush is a senior regents fellow and professor of plant pathology at the Texas A&M AgriLife Research Center-Amarillo, Texas. He received his BS degree from University of Texas Permian Basin in 1974 and MS and PhD degrees from Texas A&M University in 1976 and 1981, respectively. He directs the research program in plant pathology including ecology, epidemiology, and management of economically important plant diseases, with emphasis on wheat, sorghum, and sugar beet. Gerald J. Michels is a professor of entomology at the Texas A&M AgriLife Research Center in Amarillo, Texas. He received his BS, MS, and PhD degrees from the University of Wyoming in 1975, 1977, and 1980, respectively. He conducts research on grain pests, plant disease, biodiversity, and noxious weed control. Fekede Workneh is a senior research scientist at the Texas A&M AgriLife Research Center in Amarillo, Texas. He received his BS degree from Addis Ababa University, Ethiopia, and MS and PhD degrees from University of California, Davis. He conducts research on the ecology and epidemiology of plant diseases. Song Cui is an assistant professor of agronomy at Middle Tennessee State University. He received his BS degree from Lanzhou University, China, and a PhD degree from Texas Tech University. His research interests are integrating advanced data science techniques such as machine learning and data mining into traditional agronomic studies. He is also interested in forage production systems. Norman Elliott received his PhD in entomology from Michigan State University in 1985. He is currently a research leader for the USDA-ARS Plant Science Research Laboratory, Stillwater, Oklahoma. He conducts research on the classical and conservation biological control of insect pests of cereals and the ecology and management of pest and beneficial insects in agricultural landscapes. He applies remote sensing technologies and GIS in insect ecological and pest management research. |
|||||||||||||||||||||||||||||||||||||||||||||||||||||||||||||||||||||||||||||||||||||||||||||||||||||||||||||||||||||||||||||||||||||||||||||||||||||||||||||||||||||||||||||||||||||||||||||||||||||||||||||||||||||||||