|
|
1.IntroductionOne of the most intriguing and challenging questions in Mars science is undoubtedly whether life currently exists on Mars. It has long been recognized that high-precision measurements of methane () volume mixing ratio (VMR) and its spatial and temporal distributions in the Martian atmosphere will provide invaluable insight to this question. Recently, in situ measurements by the Mars Science Laboratory (MSL) have resulted in an upper limit of 1300 parts per trillion by volume (pptv),1 whereas previous measurements using terrestrial telescopes and an instrument in Mars orbit reported significantly higher values of 10,000 pptv or more.2–4 These results are not necessarily contradictory, due to the possibility of spatial and temporal variability of the trace gas concentration.5,6 Thus, more measurements will be required to gain clarity. The case of methane on Mars illustrates that, in general, high-precision and high-accuracy measurements of trace gases in planetary atmospheres are a powerful scientific tool. Thus, miniaturized, highly sensitive instruments providing these data are required to optimize the limited resources available on planetary missions. Here, we present a conceptual design for a miniaturized, high-resolution spectrometer to view the sun through the Martian atmosphere to measure the midinfrared absorption of atmospheric , water (), and carbon dioxide (). Using such solar occultation measurements, high-precision VMRs of and can be retrieved. Even though we concentrate on in this study, the instrument concept can be applied to other trace gases, provided suitable spectral absorption features are available. The desired instrument has to have several key properties. First, it requires high spectral resolution to unambiguously separate the absorption lines of the different molecular species. Second, it requires a high signal-to-noise ratio for relatively weak absorption features. Third, it needs to be able to account for multiple scattering by aerosols in the Martian atmosphere, which results in an effective increase in path length through the atmosphere and therefore could result in systematic uncertainties in the VMR retrievals. Finally, it has to be compact and robust to be a suitable candidate for a planetary mission. Considering these requirements, a spatial heterodyne spectroscopy (SHS) instrument,7 measuring high spectral resolution atmospheric transmittance by directly viewing the sun through the atmosphere, is well suited for this measurement challenge. It allows very high spectral resolution within a compact package and it requires no moving spectrometer parts. Accounting for multiple scattering is achieved by simultaneously measuring , the dominant Martian atmospheric molecule, at virtually the same wavelength, which provides an air mass along the same effective absorption path length through the atmosphere. Thus, the simultaneous measurement allows for an accurate methane VMR determination. In the following section, we first describe the science and measurement requirements that drive this concept design. In Sec. 3, we discuss the bandpass selection, and in Sec. 4, we show the key design aspects of the miniaturized Mars methane monitor (MMMM) concept. The performance estimates for the instrument are given in Sec. 5 followed by a brief summary. In this concept study, we targeted the deployment of the instrument on the surface of Mars; however, a similar instrument can be operated from a Mars balloon, aircraft, or even from orbit. 2.Science RequirementAny future mission will have science requirements defining the precision and accuracy of the VMR measurements and the time that is available to make the measurement. These science requirements will drive the size, weight, power, and data rate of the selected instrument. To anticipate such requirements for upcoming missions, we consider the previous measurements that report a range of VMRs between an upper limit of 1300 pptv all the way to several ten thousands of pptv as discussed above. In addition, we consider the capabilities of the tunable laser spectrometer on MSL which was designed for a precision of 300 pptv assuming a 15 min integration time, and which, with the help of sample analysis at Mars, is expected to perform down to a few parts per trillion.6 The observations to date suggest that measurement durations of one sol (24.6 h) or less should be sufficient. However, when considering instrumental properties like detector dark noise, thermal drifts, etc., shorter integration times are desirable for individual measurements. Individual measurements can subsequently be averaged to increase the measurement precision at the expense of the temporal resolution. Using the SHS instrument concept, which uses an imaging electro-optic detector such as a charge-coupled device, we estimate that an integration time on the order of minutes is desirable. Considering the above, we concluded that a precision requirement of 100 pptv, combined with an integration time of 1 min is a realistic requirement for a future mission. 3.Bandpass SelectionThe spectral region between 3200 and 3240 nm is well suited for this measurement because it contains molecular absorption lines of , , and as shown in Fig. 1. The simultaneous measurement of all the three atmospheric components is highly desirable for this instrument concept. and are of scientific interest and the measurement can be used to infer accurate VMRs in the presence of single and multiple scattering by atmospheric aerosols. The wavelength region between about 3230 and 3232 nm is most suitable for this measurement, primarily because it contains the strongest methane lines resulting in the highest measurement sensitivity. Fig. 1Line strengths of , , and .8 The highlighted region contains absorption features of all three species, which enables the simultaneous measurement. A suitable instrument passband includes a roughly 2-nm wide interval containing the strongest lines toward the right (long wavelength) edge of the highlighted region above.  Using the selected spectral interval, we calculate the expected signal at the instrument, viewing the sun from the planet’s surface. The calculations use a field-of-view of pointed at the sun. Important model characteristics are given in Table 1. Table 1Radiative transfer model characteristics.
In particular, we model three quantities: (1) direct flux: solar flux transmitted through the atmosphere; (2) diffuse downward flux: scattered sunlight moving downward onto the planetary surface; and (3) near sun radiance: diffuse radiance from the direction near the sun [], which is dominated by the forward scattering aerosols. The sum of the three components represents the expected signal. The radiative transfer calculations represent different aerosol optical depths (ODs) and solar zenith angles. Figure 2 shows a typical set of results. Figure 2(a) shows that for clear sky (aerosol ) and a solar zenith angle of 10 deg, the spectral power density is dominated by direct sunlight. Figure 2(b) illustrates the result for a solar zenith angle of 65 deg, which shows a factor of 2.25 reduction of the overall signal, but stronger absorption, due to the longer absorption path, as is illustrated in the scaled (dashed) trace. Figures 2(c) and 2(d) show, for a solar zenith angle of 10 deg, the decrease in total signal for increasing OD caused by an increased atmospheric aerosol concentration. Fig. 2Radiative transfer calculation results for a telescope on the Martian surface with a square field-of-view pointed at the sun. The panels (a), (c), and (d) show the total spectral power density and the direct and diffuse components for a solar zenith angle of 10 deg and different aerosol optical depths (ODs). Panel (b) shows the result for a clear sky () and for a solar zenith angle of 65 deg with the signal scaled (dashed) for comparison of the relative absorption shown in panel (a). 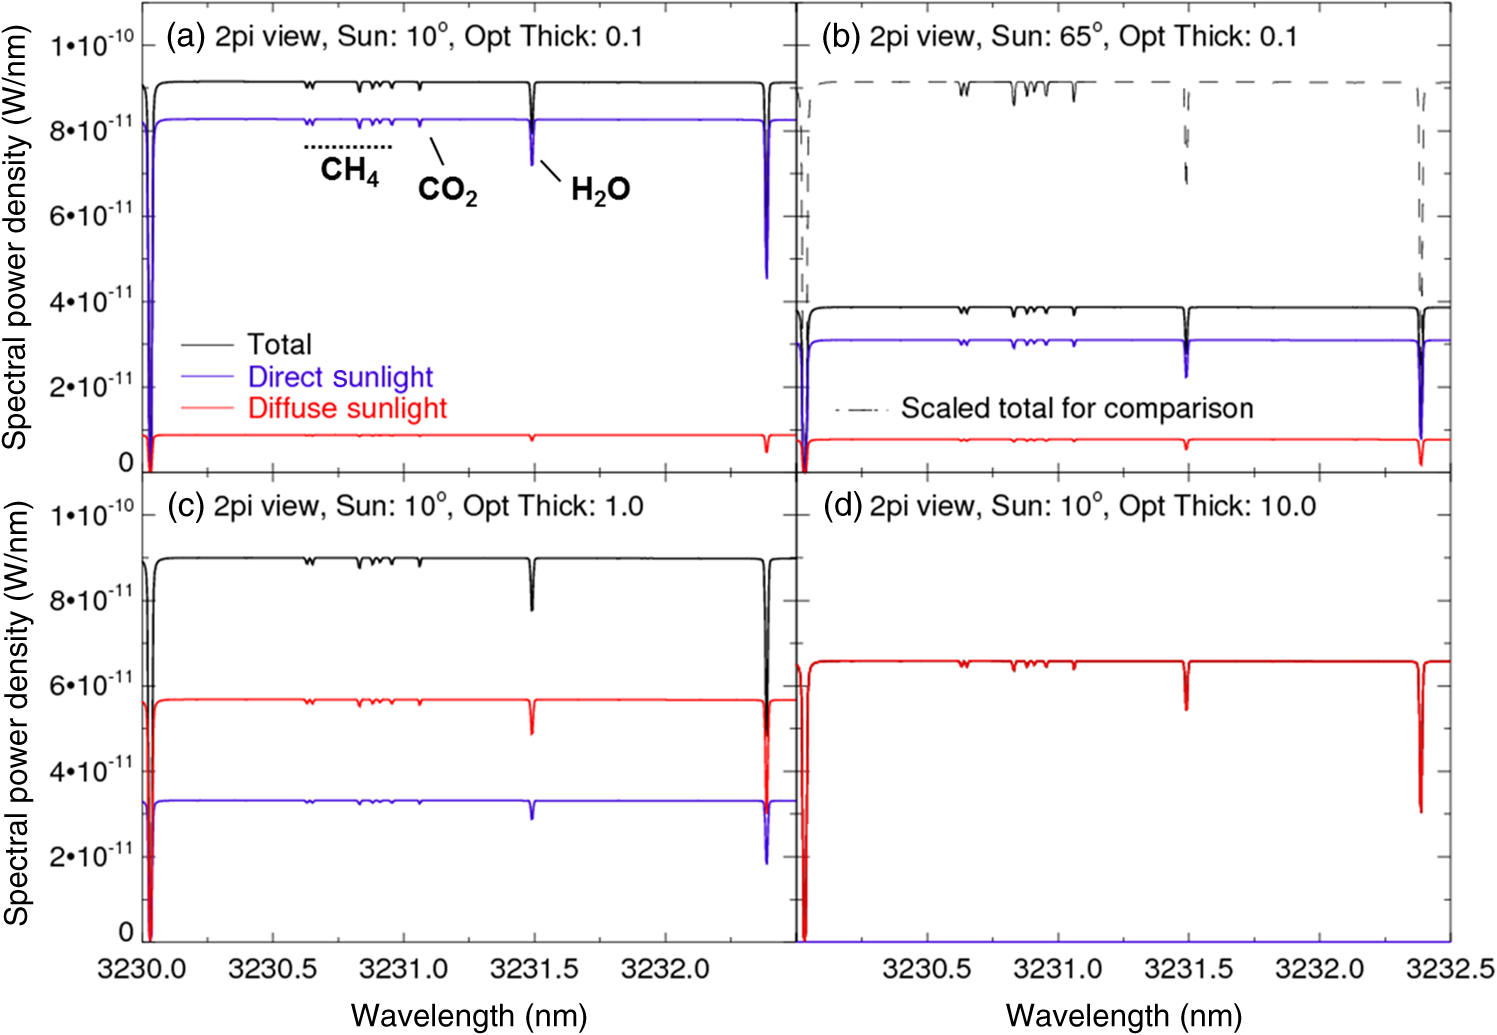 As expected, the radiative transfer calculations show that larger solar zenith angles result in increased trace gas absorption and therefore larger signal levels (relative change in signal within the absorption feature). The results of these radiative transfer calculations are used in the performance estimates discussed in Sec. 5. 4.Conceptual Instrument Design4.1.Optical DesignIn this section, we focus on the design of the interferometer, the entrance optic that is necessary to interface with a heliostat and the exit optics, which relay the signal from the interferometer to the focal plane array (FPA). Since heliostats, which point the field-of-view toward the sun, have been implemented before and fundamentally consist only of flat mirrors and a miniaturized sun sensor, we did not further investigate them here. For example, a heliostat based on the PanCam Mast Assembly14 would be more than adequate. Here, we focus on demonstrating that a suitable spectrometer with a resolving power of 150,000 can be built in a very small and light package using the SHS technique. The conceptual design is shown in Fig. 3. Figure 3(a) shows the interferometer together with a 5-in. diameter compact disc for scale. Figure 3(b) shows the overall optical design concept, which uses thin lenses for the entrance and exit optics. Figures 3(c) and 3(d) illustrate the conceptual optical design with appropriate fold mirrors to minimize the size of the overall package. Figure 4 shows another view of the interferometer as modeled by the optical design software. Fig. 3Optical design. (a) Interferometer comprising a beam splitter and two immersion gratings. In the background, a 5-in. diameter compact disk is shown for size comparison. (b) Overall entrance and exit optics concept using thin lenses and employing an interference bandpass filter. (c) Top view of the optical design using appropriate fold mirrors to minimize the size of the overall package. (d) Side view of the design shown in (c). 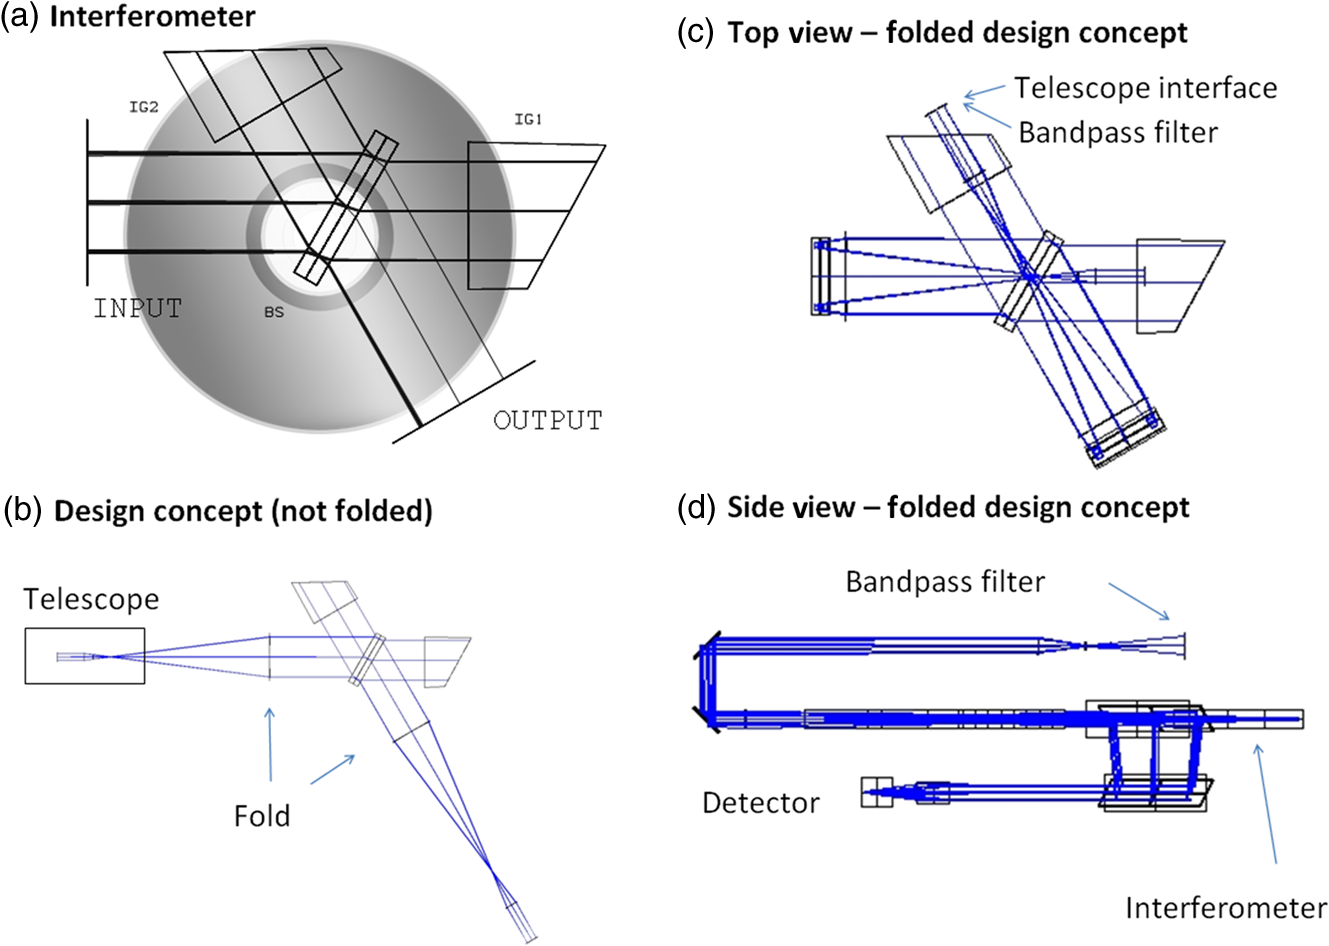 Fig. 4Illustration of the spatial heterodyne spectroscopy interferometer with selected rays of the beam. The incoming and outgoing beams are folded using flat mirrors as shown by the arrows [see Fig. 3(d)].  The interferometer has an illuminated grating area of and a beam angle of at the gratings, with the smaller angle in the dispersion plane. The silicon immersion gratings have a groove density of and a blaze angle of about 32.8 deg. This results in a maximum acceptable etendue of about . Further specifications of the optical spectrometer components are given in Table 2. The design uses an imaging detector with a total illuminated area of . With 1024 pixels across the detector, this results in a pixel pitch of about 7.5 μm. Table 2Specifications of optical components ordered by their position in the beam path. All of the infrared transmitting optics are silicon except the beam splitter, which is ZnSe.
4.2.Narrow Passband FilterLike many other spectrometer types, SHS spectrometers require a bandpass filter limiting the spectral region that is accepted by the spectrometer. In the case of SHS, the bandpass filter is generally used to perform two tasks:
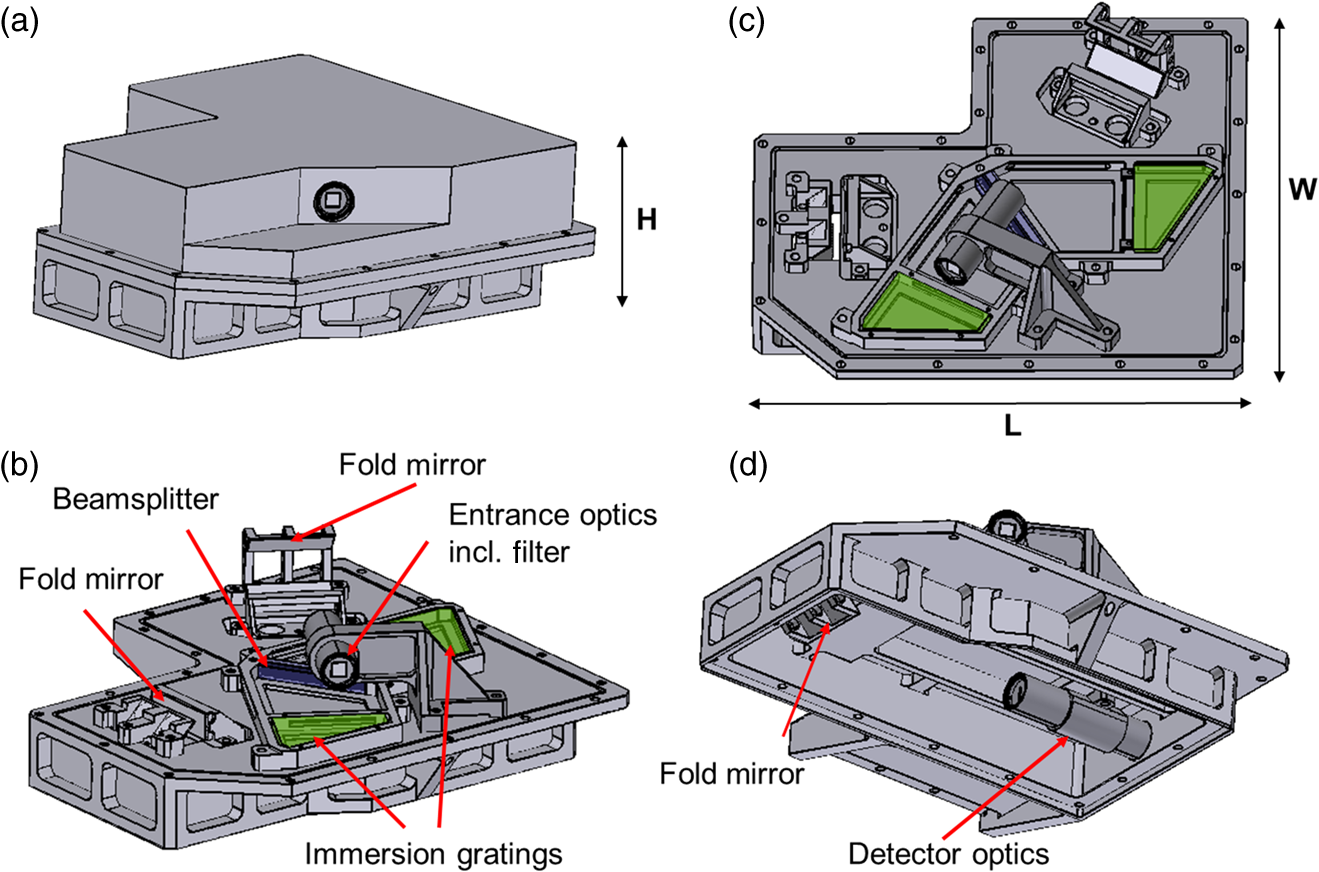
As shown in Fig. 5, the desired bandpass of the MMMM instrument is no larger than about 2 nm in wavelength, which corresponds to a wavenumber interval of about . This is of the center wavelength of a hypothetical passband filter. Fig. 5Illustration of the strategy employed for the MMMM to avoid signal contamination of the , , and absorption, assuming a bandpass filter of about is not available. The black line is the solar spectrum multiplied with the atmospheric absorption of the spectral region of interest and the filter transmittance. The side band folding around the Littrow wavenumber and the aliasing around the sampling limit is indicated by the dot-dashed lines. The uncontaminated region containing all the spectral information of interest is highlighted as the hashed area. 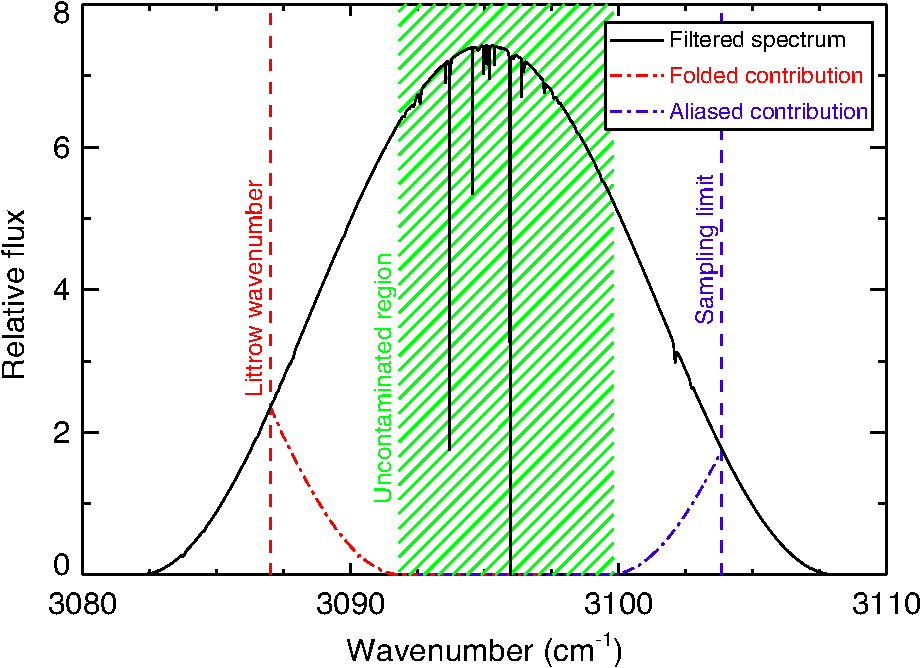 However, our discussions with a leading manufacturer of infrared interference filters revealed that in this wavelength region, due to the available production, monitoring, and metrology techniques, the filter width is currently limited to about 0.4% full width at half maximum (FWHM) of the center wavenumber. Covering a wavenumber region of approximately two times the FWHM of the filter is necessary to avoid signal aliasing while using only one sideband. Therefore, an SHS spectrometer with a resolving power of 150,000, would require an FPA of about 2400 elements (). Even though midinfrared FPAs with are beginning to enter the commercial market, we did not pursue this option in an effort to minimize technical risk. Instead, we explored whether a certain amount of sideband folding and aliasing is acceptable without contaminating the narrow wavelength region of interest, which will enable the selection of an FPA with 1024 pixels in one-dimension. Figure 5 shows that this is indeed possible. Assuming a Hann-shaped filter transmittance and allowing a roughly equal amount of sideband folding around the Littrow wavenumber and aliasing around the Nyquist limit, a central uncontaminated region remains, which can be used to recover the methane, , and water vapor signatures. Figure 5 illustrates a solar spectrum multiplied with the atmospheric transmittance in the wavelength region of interest and the filter transmittance in black. The folding (red) and aliasing (blue) on the short- and long-wavelength sides of the filter transmittance are shown as dot-dashed traces. The region in the center, which is not affected by either spectral superposition (contamination), is highlighted. This region contains all the previously modeled molecular absorption features of interest. The sideband folding and aliasing on both sides of the bandpass are balanced on both sides of the filter passband so that the wavenumbers of interest are approximately in the middle of the available fringe frequencies. This region of spatial frequencies, as opposed to the highest or lowest spatial frequencies, is least likely to be affected by systematic errors.15 The disadvantage of a larger than desired bandpass filter is that the multiplex noise level in the recovered spectrum is larger when compared to the case with an optimal, narrower filter width. This effect is included in the performance estimate of the MMMM instrument described in Sec. 5. 4.3.Mechanical DesignThe mechanical design is based on the folded optical layout shown in Fig. 3 and includes a compact and light-weight structure to house the optics, detector, and electronics. This design meets the fundamental instrument requirements and was used to determine the instrument size and mass properties. A final flight design will have to be customized to the payload platform. Different configurations and views of the three-dimensional assembly model for the MMMM are shown in Figs. 6(a)–6(d). The main structural component is the optical bench, which is a stiffened plate. It carries the optics on both sides. Lightweight covers on the top and bottom sides complete the instrument enclosure. Figure 6(a) shows the assembly with the covers. Figure 6(b) shows the assembly with the top cover removed, revealing the entrance optic, which is mounted off of the optical bench, and the fold mirrors that direct the beam into the interferometer. The interferometer components, gratings and beam splitter, are indicated in green and blue, respectively. A top view is shown in Fig. 6(c). After exiting the interferometer, the beam is again folded underneath the optical bench, which is illustrated in Fig. 6(d). The detector is located at this level, as indicated in Fig. 6. A carbon-carbon composite material is used for the structure because of its light weight, high strength, low coefficient of thermal expansion, and reasonable thermal conductivity. The input telescope, not shown in Fig. 6, as discussed before, can be as simple as a system of flat folding mirrors, the first of which may be actuated to track the sun and direct its light to the input filter and first lens. Otherwise, simple lenses could be added to shape the field-of-view. As this item critically depends on the accommodations, it has not been detailed further in this study. For the mass estimates, fasteners are neglected and are assumed to be replaced by epoxy glue wherever possible. Harness and connectors are also minimal since they are limited to heaters and temperature sensors and there are no mechanisms inside the structure. The structure has a rough envelope of , and a total mass of approximately 700 g. Although it is believed that the mass of this structure can be further reduced by a more detailed analysis, adding a growth margin gives a total mass of under 1.0 kg, excluding the heliostat, focal plane assembly, and any potentially required thermal hardware like radiators and heat straps. The mass breakdown is detailed in Table 3. Table 3Detailed mass table of the MMMM instrument, excluding a heliostat, the focal plane assembly, and thermal hardware. The mass is given in grams, while individual masses below 1 g are rounded up to 1 g. All optics component dimensions are increased by 1 mm (or 25% if lighter than 1 g) to accommodate their mounting.
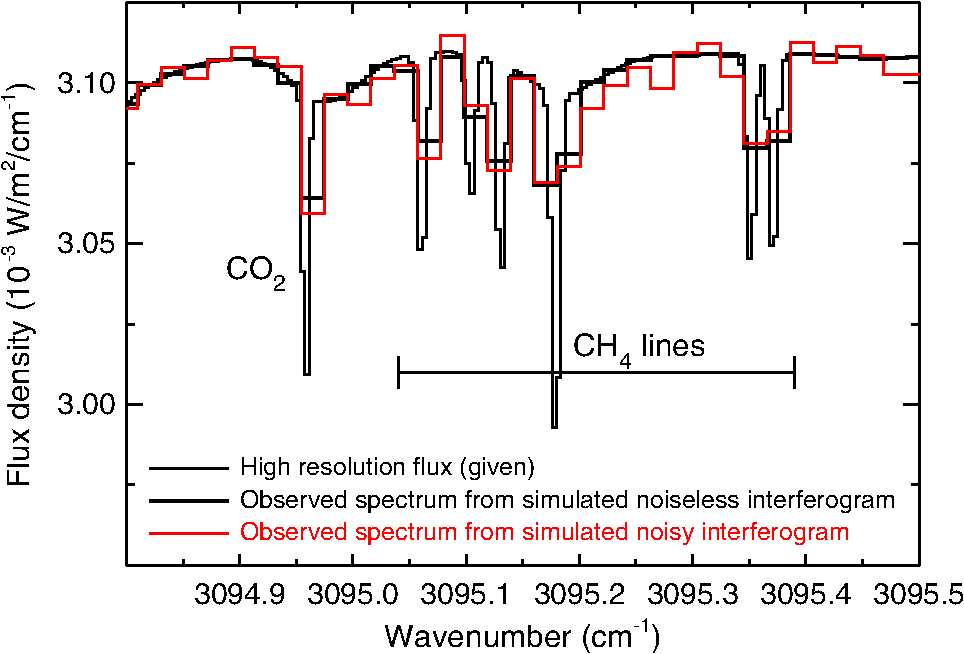
The mass of a heliostat, which could be based on the Mars exploration rover PanCam Mast,14 is not included in the above data. 4.4.Thermal ConsiderationsMars surface temperatures can vary by centered about an average of approximately . This is a threat to the survival and operation of any exposed Mars-based instrument. The best location for the interferometer is therefore in the thermally controlled interior of a vehicle. The interferometer optics, for example, should be held within approximately 1°C of a design temperature during daytime observing hours. The dimensional stability of a carbon composite structure is generally well behaved for larger temperature ranges, but the beam splitter, lenses, and gratings have temperature-dependent refractive indices and nonnegligible coefficients of expansion, requiring thermal control. Once a target operating temperature is established, it can be maintained assisted by thermal standoffs, multilayer insulation, and PID (proportional, integral, derivative) controlled heaters. To the first order, the , , and measurements are not affected by small temperature changes in the instrument since the primary effects are a small change in the Littrow frequency and a slight defocus of the FPA.15 Both of these effects can be corrected in the data analysis if the temperature is stable during an individual exposure since (1) the spectral shape of the measured signal is known (except for the magnitude of the absorption) which allows the determination of the wavelength scale for each measured spectrum from the spectrum itself and (2) the absorption measurement is self-calibrating since the baseline is measured with each exposure. More details on a technique that can be used to correct for the thermal defocus effect in an SHS instrument can be found in Ref. 15. It is worth noting that especially for high fringe frequencies, defocusing will result in a fringe contrast reduction and therefore a decrease in the signal-to-noise ratio, which cannot be recovered. However, a thermally stabilized interferometer will minimize that effect. Another thermal challenge is the cooling and thermal stability of the FPA in the camera. Since power is likely a limited resource on a planetary instrument platform, passive cooling is a preferred method of removing any heat from the FPA. Depending on the location and orientation of the platform on which this instrument is integrated, an appropriately sized radiator is likely the best choice for rejecting thermal energy. If a passive radiator/heater combination is not sufficient to keep the FPA at the desired temperature throughout the day, single or multistage thermoelectric coolers or closed cycle mechanical coolers can be considered. 5.Performance EstimateThe performance of the MMMM instrument is estimated by simulating the response of the experiment to the incident photon flux reaching the surface of Mars, given several dust opacities and several solar zenith angles. For each of these cases, a noise free interferogram is generated, based on the given incident flux for a 1-deg square field-of-view pointed at the sun. To this interferogram, noise is added based on photon statistics (shot noise) and realistic readout noise (0.02% of the dynamic range). Both readout noise and dark noise are small compared to the photon shot noise due to the large solar signal. Finally, these interferograms are used to derive spectra, thus simulating observations. This process introduces both the instrumental resolution (instrumental line shape function) and the expected noise into the simulation. Based on these simulated observations, we can estimate the uncertainty in the retrieval of the atmospheric methane VMR. As discussed in Sec. 4.2 and illustrated in Fig. 5, the measured spectrum contains a signal from the opposite sideband and aliased signal on either end of the retrieved wavenumber interval, while the lines of interest, originating from , , and , are in the central part of the retrieved spectrum that is not influenced by these “folding” effects. This is illustrated in Fig. 7, along with a simulated measurement and the simulated noise in the retrieved spectrum. Fig. 7The top part of this figure (thin black line) shows an example of a high resolution incident flux, referenced to the left axis (aerosol optical depth: , solar zenith angle: 40 deg). The flux was created using the solar atlas of ACE10 and the radiative transfer calculations performed within the central wavelength region containing , , and absorption lines. The thick black line is the retrieved spectrum that clearly shows the folding effects on both edges that introduce extra signal in these regions. The depth of the measured absorption is also noticeably smaller than for the high resolution case, due to the instrumental line shape function of the instrument. The red trace indicates a simulated observation with noise, and the blue trace, referenced to the right axis, represents the noise in the retrieved spectrum. This noise simulation assumes photon shot noise, detector dark, and read noise, and the instrument and measurement parameters listed in Table 2.  Figure 8 shows a smaller wavelength section from a simulated spectrum. The effect of the convolution with the instrumental line shape function of the spectrometer is apparent. The high resolving power of 150,000 is sufficient to clearly separate the absorption features for both and . Figure 9 illustrates the simulated absorption measurement, after removing the spectral shape of the sun. The lines that show an absorption of larger than 0.5% (marked as blue diamonds) are used to estimate the uncertainty in retrieving the VMR from these simulated measurements. The performance estimates are conducted using a Monte Carlo approach with independent sets of noise contributions. Fig. 9and absorption, calculated from the simulated spectrum by removing the features included in the spectral shape of the solar signal. The methane absorption feature of (marked with blue diamonds) and the corresponding noise were used for the sensitivity estimate of the instrument. 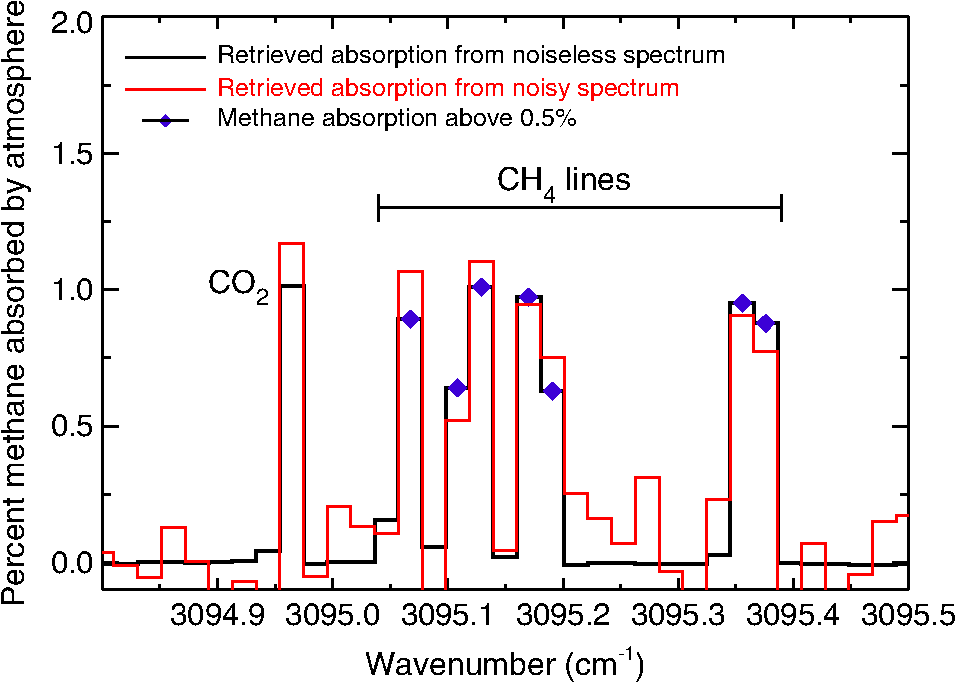 For this Monte Carlo approach, 100 measurement simulations (interferograms) were created using different random noises of equal magnitude, containing photon shot noise, read noise, and dark noise. Using analytical error propagation, we determined that the statistical uncertainty in the noisy interferogram is equivalent to the uncertainty in the associated absorption feature.16 Next the standard deviations of these simulated methane absorption features (marked in Fig. 9) were converted into an equivalent VMR uncertainty. Note that for optically thin conditions, as encountered here, the absorption and VMR have a nearly linear relationship. Table 4 summarizes the instrument parameters that were used for the measurement simulations. For these measurement simulations, the following conservative assumptions are made: the field-of-view on the sky (1 deg) is larger than the angle subtended by the sun () and the etendue of the telescope is smaller than the maximum etendue that can be accepted by the interferometer. Table 4Instrument parameters used for measurement simulations.
The results of the performance estimate for the retrieval of VMR are given in Table 5 for five atmospheric aerosol conditions and three solar zenith angles. Table 5Performance predictions for five different aerosol scenarios and three solar zenith angles assuming a total measurement time of 60 s. The signal-to-noise is calculated using the total incident signal and the corresponding noise. The mixing ratio numbers are the uncertainties in the CH4 retrieval that result from the simulated signal-to-noise of the spectrum and the simulated CH4 absorption.
The uncertainty estimates given in Table 5 show that for the case of a clear or moderately scattering atmosphere [OD (aerosol OD) ] and a measurement time of 1 min, the goal of 100 ppt can be achieved. For increasing dust concentrations in the atmosphere (), the uncertainty of the VMR measurement increases, as expected. 6.ConclusionsWe conclude that a solar occultation measurement from the Mars surface using a very high resolving power () compact spatial heterodyne spectrometer will satisfy the science requirements we anticipate to be leveraged on future Mars missions (100 pptv, 60 s, for a clear atmosphere). We presented a conceptual instrument design using state-of-the-art, available components, so that no technology development is required for the implementation of the instrument. The main resource requirements are summarized in Table 6. Table 6Main instrument resource requirements.
aThe mass of comparable COTS cameras is in the range of 5 kg, where a significant fraction of the mass is the cooler, the housing, and structure. An integrated space flight instrument will be able to benefit from significant savings compared to these bench-top models. cThe power budget consists of detector power, electronics power, power to operate the heliostat, and power for thermal management. Except for the thermal management, the power needs are expected to be quite limited. Depending on the accommodation on the platform, the thermal management might require a more significant amount of heater power. More detailed studies using more specific platform data are needed to derive a better estimate. Further refinements of the instrument are expected to result in weight reductions by a more aggressive, lightweight aluminum structure design or by choosing a different structure material, such as carbon fiber. Further information about the actual platform is needed to finalize the thermal design and the sun pointing telescope. AcknowledgmentsThis work was supported by the NASA Planetary Instrument Definition and Development Program (PIDDP). ReferencesC. Websteret al.,
“Low upper limit to methane abundance on Mars,”
Science, 342
(6156), 355
–357
(2013). http://dx.doi.org/10.1126/science.1242902 SCIEAS 0036-8075 Google Scholar
M. J. Mummaet al.,
“Strong release of methane on Mars in northern summer 2003,”
Science, 323
(5917), 1041
–1045
(2009). http://dx.doi.org/10.1126/science.1165243 SCIEAS 0036-8075 Google Scholar
V. Formisanoet al.,
“Detection of methane in the atmosphere of Mars,”
Science, 306
(5702), 1758
–1761
(2004). http://dx.doi.org/10.1126/science.1101732 SCIEAS 0036-8075 Google Scholar
V. A. Krasnopolskyet al.,
“Detection of methane in the Martian atmosphere: evidence for life?,”
Icarus, 172
(2), 537
–547
(2004). http://dx.doi.org/10.1016/j.icarus.2004.07.004 ICRSA5 0019-1035 Google Scholar
E. Hand,
“Hopes linger for Mars methane,”
Nature, 491
(7423), 174
(2012). http://dx.doi.org/10.1038/491174a NATUAS 0028-0836 Google Scholar
C. R. WebsterP. R. Mahaffy,
“Determining the local abundance of Martian methane and its 13C/12C and D/H isotopic ratios for comparison with related gas and soil analysis on the 2011 Mars Science Laboratory (MSL) mission,”
Planet. Space Sci., 59
(2–3), 271
–283
(2011). http://dx.doi.org/10.1016/j.pss.2010.08.021 PLSSAE 0032-0633 Google Scholar
J. M. HarlanderR. J. ReynoldsF. L. Roesler,
“Spatial heterodyne spectroscopy for the exploration of diffuse interstellar emission lines at far ultraviolet wavelengths,”
Astrophys. J., 396
(2), 730
–740
(1992). http://dx.doi.org/10.1086/171756 ASJOAB 0004-637X Google Scholar
L. S. Rothmanet al.,
“HITRAN 2008 molecular spectroscopic database,”
J. Quant. Spectrosc. Radiat. Transfer, 110 533
–572
(2009). http://dx.doi.org/10.1016/j.jqsrt.2009.02.013 JQSRAE 0022-4073 Google Scholar
ASTM Standard E490-00a, “Standard Solar Constant and Zero Air Mass Solar Spectral Irradiance Tables,”
(2014) www.astm.org February ). 2014). Google Scholar
F. L. Haseet al.,
“The ACE-FTS atlas of the infrared solar spectrum,”
J. Quant. Spectrosc. Radiat. Transfer, 111
(4), 521
–528
(2010). http://dx.doi.org/10.1016/j.jqsrt.2009.10.020 JQSRAE 0022-4073 Google Scholar
H. Nairet al.,
“A photochemical model of the Martian atmosphere,”
Icarus, 111
(1), 124
–150
(1994). http://dx.doi.org/10.1006/icar.1994.1137 ICRSA5 0019-1035 Google Scholar
M. D. Smith,
“Report of the Mars Science Orbiter (MSO) Science Definition Team,”
in Third International Workshop on the Mars Atmosphere: Modeling and Observations,
9067
(2008). Google Scholar
K. Stamneset al.,
“Numerically stable algorithm for discrete-ordinate-method radiative transfer in multiple scattering and emitting layered media,”
Appl. Opt., 27
(12), 2502
–2509
(1988). http://dx.doi.org/10.1364/AO.27.002502 APOPAI 0003-6935 Google Scholar
J. N. Makiet al.,
“Mars exploration Rover engineering cameras,”
J. Geophys. Res., 108
(E12), 1
–12
(2003). http://dx.doi.org/10.1029/2003JE002077 JGREA2 0148-0227 Google Scholar
C. R. Englertet al.,
“Spatial heterodyne imager for mesospheric radicals on STPSat-1,”
J. Geophys. Res., 115
(D20), D20306
(2010). http://dx.doi.org/10.1029/2010JD014398 JGREA2 0148-0227 Google Scholar
C. R. EnglertD. D. BabcockJ. M. Harlander,
“Doppler asymmetric spatial heterodyne spectroscopy (DASH): concept and experimental demonstration,”
Appl. Opt., 46
(29), 7297
–7307
(2007). http://dx.doi.org/10.1364/AO.46.007297 APOPAI 0003-6935 Google Scholar
BiographyChristoph R. Englert received a graduate degree in physics at the Technical University of Munich, Germany, in 1996 and a doctorate degree in physics at the University of Bremen, Germany, in 1999. Currently, he is the head of the Geospace Science and Technology Branch of the Naval Research Laboratory (NRL) Space Science Division (SSD) and has been working on several NRL space-flight projects since 1999, including the SHIMMER instrument on the STPSat-1 satellite, for which he was the principal investigator. He is predominantly interested in space-based atmospheric sensors. Michael H. Stevens earned a PhD degree in earth and planetary science from the Johns Hopkins University in 1992. For two years, he was a research associate at the SSD of the NRL. Since then, he has been a research physicist at NRL’s SSD. He is an expert in spectroscopy and is author or coauthor of over 60 peer-reviewed publications on the terrestrial atmosphere or planetary atmospheres. Charles M. Brown received a PhD degree in chemical physics in 1971. Since then, he has been at NRL’s SSD. He has enjoyed over 40 years of laboratory and space flight work involving spectroscopic instruments. He has contributed to numerous instruments including MAHRSI for the Shuttle and BCS and EIS on the Yohkoh and Hinode satellites. Currently, he is working with SHS instruments such as REDDI and MIGHTI to measure upper atmospheric winds. John M. Harlander earned a PhD degree in physics from the University of Wisconsin-Madison in 1991. While at Wisconsin he and Fred Roesler began developing spatial heterodyne spectroscopy for applications in atmospheric science and astronomy. His 20+ years collaboration with the US NRL has resulted in the development of numerous ground-based and space-borne instruments for atmospheric remote sensing. Currently, he is a professor of physics at St. Cloud State University. Robert DeMajistre obtained a PhD degree in computational sciences and informatics from George Mason University in 2005. Currently, he is a member of the principle professional staff at the Johns Hopkins University Applied Physics Laboratory. He specializes in the development of algorithms for space-based remote sensing and has worked on applications ranging from cloud remote sensing to the characterization of plasma in the outer heliosphere. Currently, he is a member of the AGU. Kenneth D. Marr received a Bachelor of Science degree in physics from Principia College and his doctorate in plasma physics from the Massachusetts Institute of Technology. Currently, he is an NRC postdoctoral in residence with the Geospace Science and Technology branch of the NRL SSD. His residence began in November 2011, working on the thermal properties of DASH interferometers. His main interests include spectroscopy, high-speed imaging systems, robotics, and fiber optics. |
|||||||||||||||||||||||||||||||||||||||||||||||||||||||||||||||||||||||||||||||||||||||||||||||||||||||||||||||||||||||||||||||||||||||||||||||||||||||||||||||||||||||||||||||||||||||||||||||||||||||||||||||||||||||||||||||||||||||||||||||||||||||||||||||||||||||||||||||||||||||||||||||||||||||||||||||||||||||||||||||||||||||||||||||||||||||||||||||||||||||||||||||||||||||||||||||||||||