
|
|
1.IntroductionFactor analysis is a multivariate analysis method which conducts a comprehensive analysis on observed data of multiple variables and multiple samples.1 Based on the study of a similarity matrix of variables or samples, it sums perplexing multiple variables or multiple samples up to a few factors. The combinational relationships of variables or samples are analyzed, so that the essential factors, which play leading roles in the information extraction process, are acquired. Factor analysis has been used to classify geological samples, to get the main factors of geological structures, to obtain geochemical information of different regions, to explain spatial variables, and to analyze topographic variables from which the hydrological factors can be extracted.2–6 R-mode factor analysis has been used to do geochemical division and estimate water quality.1,7 After being combined with clustering analysis, it provides a new quantitative method which has explicit geological significance.8 High temperature targets refer to the surface cover types in which temperatures are obviously higher than the temperatures of normal surface cover types (). These abnormally high temperatures, such as forest fires, grassland fires, coal seam spontaneous combustions, volcanic eruptions, etc., are generally higher than 500 K. Due to the higher temperature, their emitted energy in the shortwave infrared () can be equal to or even higher than the reflected energy of the surface cover types with normal temperatures. This is a significant feature of high temperature targets and can be derived from the blackbody radiation function.9 High temperature targets have a great significance in environmental monitoring, disaster warning, and resources investigation. In this article, factor analysis is conducted to recognize high temperature targets in remote sensing imagery. 2.MethodFactor analysis is divided into R-mode factor analysis and Q-mode factor analysis. R-mode factor analysis is mainly used for studying the relationships among variables and realizing the classification of samples, while Q-mode factor analysis is mainly used for studying the relationships among samples and realizing classification of variables. Both of them can be unified by correspondence analysis.10 R-mode factor analysis starts from a similarity matrix/correlation coefficient matrix of variables. Through the correlation analysis of variables, it sums multiple variables up to a few factors. The information can be extracted with the least amount of information loss. Each factor extracted can be considered as a linear combination of the original variables, so that the group characteristics of variables can be analyzed and the thematic significance of every factor will be achieved. R-mode factor analysis follows the form where is an order original data matrix; is the number of samples/pixels; is the number of variables/bands; is an order matrix called the loading matrix that represents the correlation between variables and factors; is an order matrix called the factor score matrix that represents the correlation between samples and factors; and is the number of factors.The calculation process of R-mode factor analysis is as follows:
3.Data SourcesThe study area lies on the intersection of Fugu in Shanxi Province and Baode in Shaanxi Province, China (, ) (Fig. 1). Bode and Fugu are located on different sides of the Yellow River. The study area is abundant in coal resources. Around the year 2002, high temperature targets, such as coke ovens and metal smelting factories, were widely distributed in this area. One Landsat-7 ETM+ scene acquired the date of July 14, 2002, is selected in this study. A series of imaging processing steps, such as radiometric calibration, atmospheric correction, and clipping, have been performed first. Through the previous processes mentioned above, for remote sensing imagery pixels, their radiant energy should be the sum of the reflected and emitted energies due to the high temperature targets in them. We call the reflectivity of pixels visual reflectivity11 and the physical expression is9 where is the visual reflectivity of a mixed pixel; is the radiant flux density of emission of the high temperature targets in it; is the radiant flux density of reflectance of the high temperature targets in it; is the radiant flux density of emission of normal temperature surface cover types in it; is the radiant flux density of reflectance of normal temperature surface cover types in it; is the percent of area of high temperature targets for mixed pixels; is sun zenith angle; is the solar irradiance of the upper bound of the atmosphere; and is the transmittance of the atmosphere.There are nine kinds of surface cover types in the study area. They are residential area, road, forest land, cultivated land (in the hilly area), cultivated land (in the lowland), river, flood plain, gully, and high temperature targets. In the view of the spectral analysis,12 30 representative pixels in each kind of the surface cover type are selected from remote sensing imagery, respectively. There are 270 samples in total. KMO (Kaiser–Meyer–Olkin) and Bartlett spherical degree test13 have been done to all of the selected samples. KMO statistics is an indicator which is used to compare simple correlation and partial correlation coefficients of variables. Its value range is [0, 1]. The greater the KMO value, the more suitable it is for the factor analysis of the original variables to be put into effect. Bartlett is the indicator that is used to test the difference between the actual correlation matrix and the unit correlation matrix. When the value of the significance test of Bartlett is less than a given reliability, the correlation between the original variables is significant. Thus, the original variables are suitable for factor analysis. The results of these tests show that the KMO value is greater than 0.6 and the Bartlett value is less than 0.05, which satisfy the premise of factor analysis. In R-mode factor analysis of the study area, representative samples, eigenvalues, and information quantity are in Table 1 and the factor loading matrix in Table 2 is achieved. As the accumulated information quantity of first three factors has reached 98.141% and satisfies with the requirements of little information loss, this article will focus on the first three factors with larger amounts of information and give detailed explanations of the analysis of them. Table 1Correlation matrix eigenvalues and information quantity calculated by the representative samples.
Table 2Factor loading matrix calculated by the representative samples.
4.Experimental ResultsThe R-mode factor loading matrix reflects the relationship between variables and factors. Each factor can be considered as a linear combination of each variable. The thematic significance of R-mode factors is determined based on the understanding of the physical meanings of the variables of each band. The element in the factor loading matrix shows the important degree of variable of the factor . The greater the absolute value of , the more important variable is to the factor . That is to say that the thematic meaning of the factor can be described by the variables with larger absolute values of . Factor 1 represents the total linear combination of the visual reflectivity of each band and it is called the brightness factor. Its loading is positive in each band. Factor 2 represents the difference between near-infrared and visible light reflectivity and it is called the vegetation factor. The absolute values of factor loading at the fourth and seventh band variables are larger in Factor 3 (i.e., ). That is to say, mainly represents the information of bands 4 and 7. The inverted result of is equal to the difference value of the combination of bands 7 and 4. The approximate expression of is where is the visual reflectivity of band 4, and is the visual reflectivity of band 7.The main difference between high temperature targets and other surface cover types is that for the targets with high temperature, is larger and is smaller. Hence, the shared similar principles with the enhanced vegetation index14 (, is the visual reflectivity of band 3) are used to enhance the information of vegetation, and can be used to enhance the information of high temperature targets. Calculate the value of for the pixels and the greater the inverted value of is, the more likely it is that there are high temperature targets in them. At the same time, is similar to the normalized difference fire index (NDFI)11 in principle, while NDFI is also similar to the normalized difference vegetarian index (NDVI)14 in its principle of enhancing vegetation. Like NDFI, can enhance the temperature of high temperature targets, so that can be named a fire factor. In the light of factor analysis with representative samples, the authors of this article calculate the factor score for the factor loading matrix with the study area pixel data, and get a factor score image (Fig. 2) and representative samples factor illustration (Fig. 3). The R-mode factor score matrix reflects the relationship between samples and factors, thus the DN value in each factor score image represents the weight of the composition of lightness, vegetation, and fire factors. The reflectivity of the flood plain in each band is very high, so that it shows a high brightness value in the score image of Factor 1. Forest and cultivated land have higher compositions of vegetation, so that they both have high brightness values in the score image of Factor 2. Pixels of high temperature objects in the score image of Factor 3 have the highest brightness values. In the factor illustration, all representative pixel samples show different clustering characteristics of points. The pixel samples can be classified and used to recognize targets. Fig. 2Factor score image. (a) Factor false color image (123 RGB), (b) Factor 1 image, (c) Factor 2 image, (d) Factor 3 image, (e) the subset of (d). 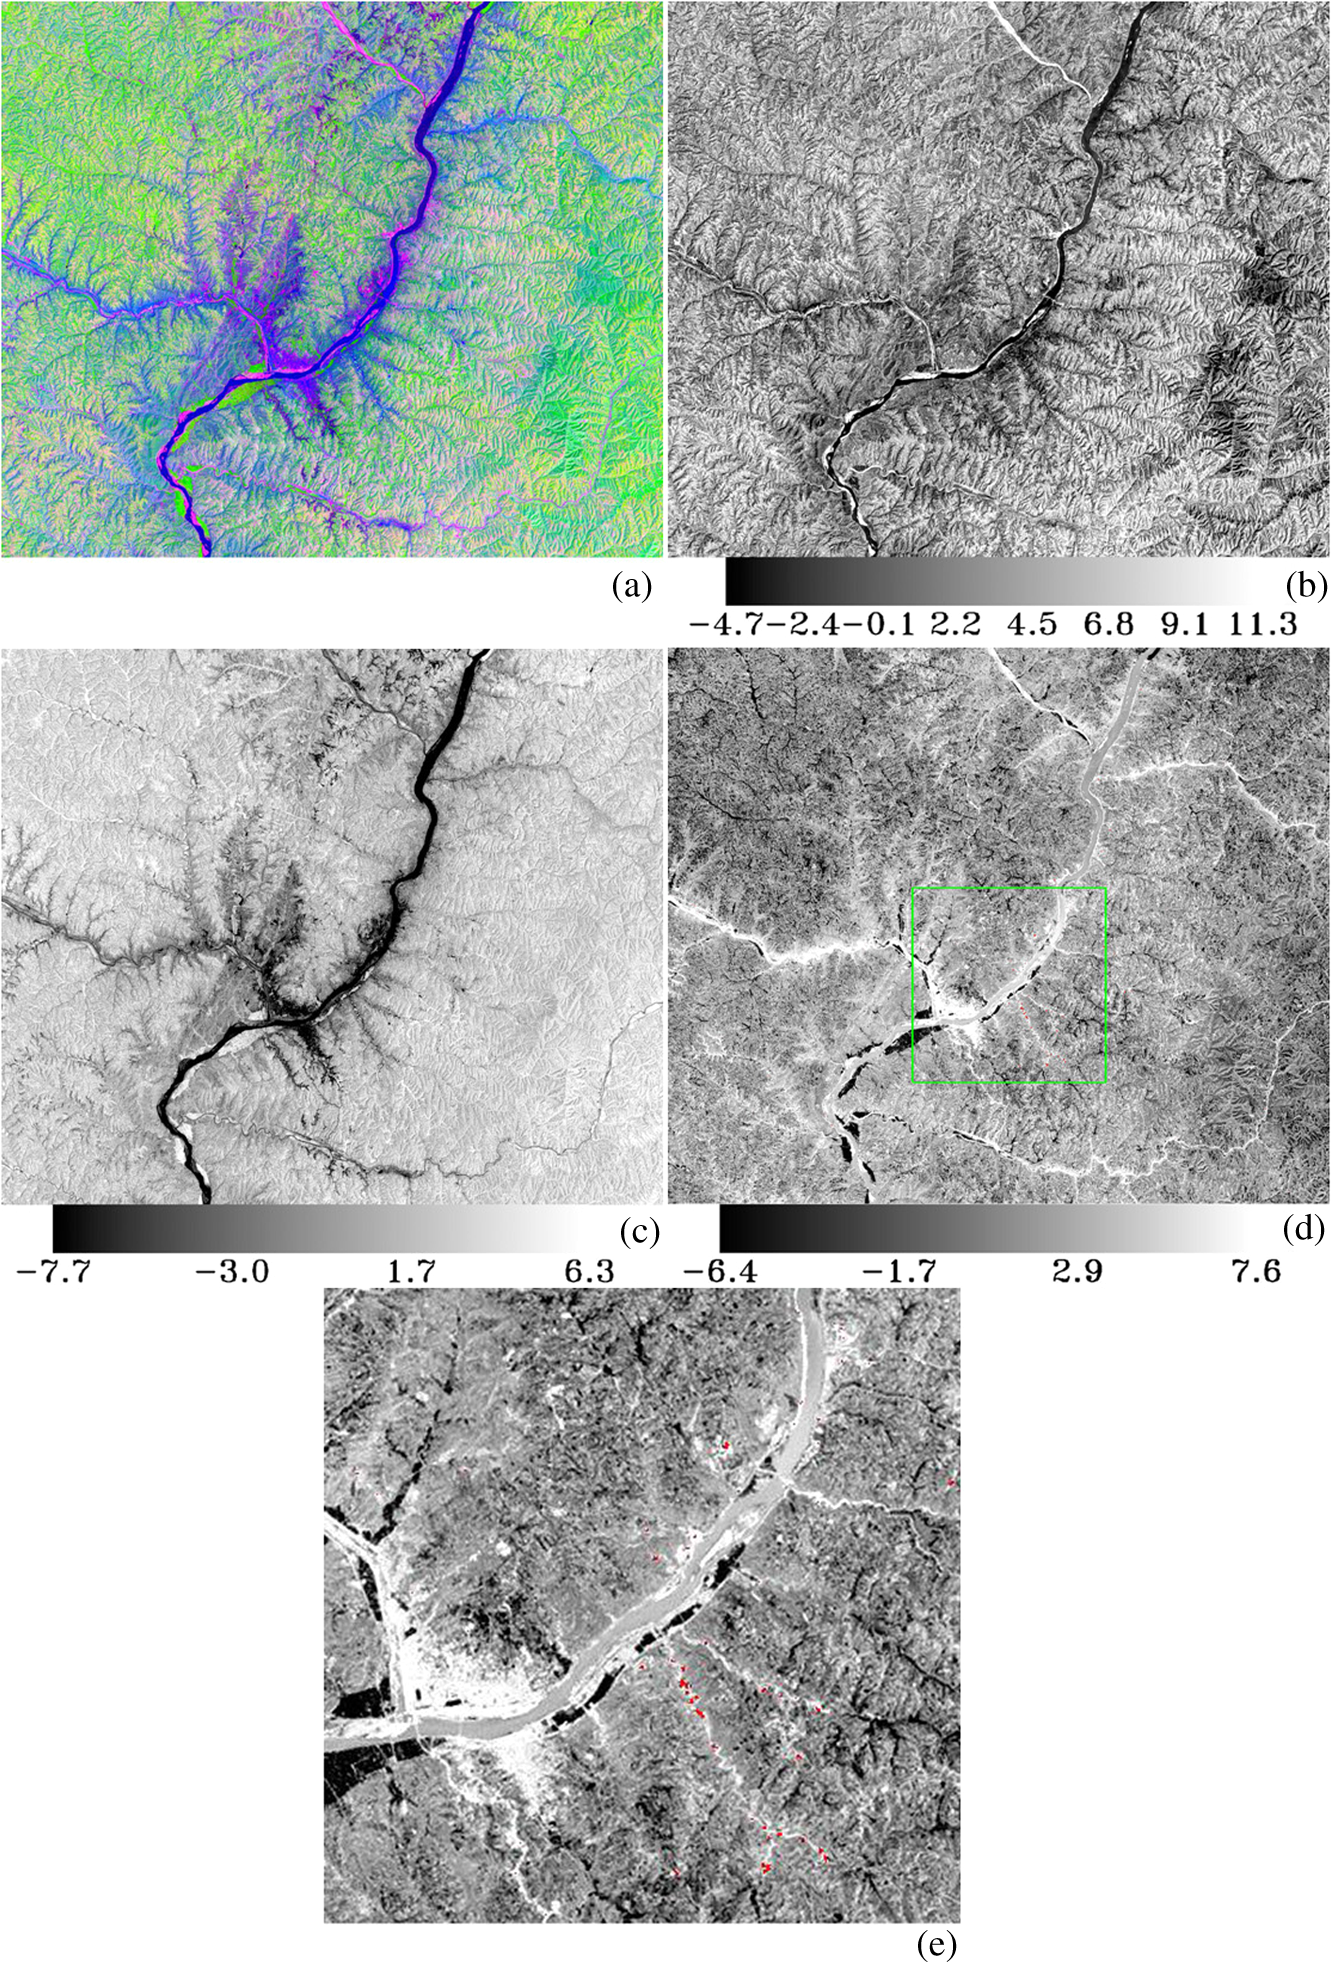 Fig. 3Factors 1, 2, 3 score scatter plot. (a) Factors 1–2 scatter plot, (b) Factors 1–3 scatter plot, (c) Factors 2–3 scatter plot.  Because of the factor score, a mixture tuned matched filtering,15 (MTMF, the identification method which uses a matched filtering score and infeasibility to measure the similarity degree between unknown pixels and known samples), is conducted to high temperature objects of known samples. After the threshold is set according to the matched filtering score image and infeasibility image scatter plot, 300 pixels of high temperature targets are acquired. Then they are verified one by one in the field. The result of the field verification demonstrates the following facts. 285 pixels of targets are recognized successfully. Most of them are from the coking plants or metal smelting plants, and a few of them are from thermal power plants. All the extracted target pixels have high temperature property meanings. There are 15 error pixels, and among them, 8 pixels are from the flood plains and gullies. The reason for this misjudgment is that they have higher values in the curves of all the bands. The other seven pixels are near high temperature pixels. The reason for this misjudgment is that they have a higher similarity on the spectrum to high temperature targets. The identification precision of MTMF reaches 95%. In addition, via using a monowindow algorithm,16 the temperature has been inversed from the thermal infrared remote sensing imagery (ETM+ 6) with the same time phase. The pixels in the thermal imagery, which match the positions of the 285 pixels mentioned above, served as thermal infrared abnormal areas, and the other areas are taken as the normal temperature background in the process of statistical analysis of temperature. The results are listed in Tables 3 and 4. The results show that the values of the normal temperature background and high temperature targets are relatively close, which makes it more difficult to distinguish the targets from the background. Moreover, the target with the highest temperature in the results of this inversion is 324.21 K, which is quite different from its actual temperature (500 K+). The temperature of high temperature targets inversed from the shortwave infrared imagery (Table 5) based on blackbody radiation characteristics17 are relatively consistent with the actual temperature. That is to say, thermal infrared remote sensing data fail to reflect the features of high temperature targets properly. The main reason for this case is that the spatial resolution of thermal infrared remote sensing imagery is 60 m × 60 m and of shortwave infrared remote sensing imagery is 30 m × 30 m. The high temperature targets with the equal temperature and area are more easily weakened by the background with a normal temperature in the thermal infrared remote sensing imagery than those in the shortwave infrared remote sensing imagery. Table 3Inversion temperature of thermal infrared high targets in the study area.
Table 4Inversion temperature of thermal infrared normal temperature background in the study area.
Table 5Inversion temperature of shortwave infrared high targets in the study area.
5.ConclusionR-mode factor analysis starts from the similarity matrix/correlation coefficient matrix of variables. It can sum multiple variables up to a few factors with little information loss. This article uses multispectral remote sensing data in its study. In the results of R-mode factor analysis, a factor loading matrix or factor loading curves reflect the correlation between band variables and factors. Each R-mode factor can be considered as a linear combination of each bands’ variables, so that the group characteristics of variables can be analyzed and the thematic significance of every factor will be achieved. The score matrix of R-mode factor analysis reflects the correlation between samples and factors. In the results of R-mode factor analysis, a factor score matrix represents the factor composition weight of pixel samples and can be used to classify pixel samples and recognize targets. Factor loading and factor score have clear thematic significance, which allows the adoption of MTMF to recognize targets. The result of the field verification shows that all the extracted target pixels have high temperature property meanings, and the identification precision reaches 95%. AcknowledgmentThis article was supported by the Higher Specialized Research Fund for the Doctoral Program funding under Grant number 20110061120067. ReferencesY. X. ShiH. J. JiJ. L. Lu,
“Factor analysis method and application of stream sediment geochemical partition (in Chinese with English summary),”
Geol. Prosp., 40
(5), 73
–76
(2004). http://dx.doi.org/10.3969/j.issn.0495-5331.2004.05.014 Google Scholar
X. W. MengD. W. DuJ. L. Wu,
“Factor analysis for compositional data and its application to the classification of geological samples (in Chinese with English summary),”
J. Jilin Univ., 30
(4), 367
–370
(2000). http://dx.doi.org/10.3969/j.issn.1671-5888.2000.04.012 JDXLAW 1671-5489 Google Scholar
H. ZhangM. Y. HeY. P. Liu,
“Geological factor analysis in the search for the ore-forming geochemical information and the application of construction (in Chinese with English summary),”
Acta. Univ. Pekinensis, 29 367
–370
(2009). Google Scholar
H. Q. Chen,
“SPSS in the application of multi-objective geochemical partition based on factor analysis (in Chinese with English summary),”
China High Tech. Enterprises, 22 71
–73
(2001). http://dx.doi.org/10.3969/j.issn.1009-2374.2011.22.026 Google Scholar
M. J. UmH. YunC. S. Jeong,
“Factor analysis and multiple regression between topography and precipitation on Jeju Island, Korea,”
J. Hydrol., 410
(3–4), 189
–203
(2011). http://dx.doi.org/10.1016/j.jhydrol.2011.09.016 JHYDA7 0022-1694 Google Scholar
I. J. Janneke,
“Environmental conditions in the Donggi Cona lake catchment, NE Tibetan Plateau, based on factor analysis of geochemical data,”
J. Asian Earth Sci., 44 176
–188
(2012). http://dx.doi.org/10.1016/j.jseaes.2011.04.021 1367-9120 Google Scholar
A. Ahmad,
“R-mod fact or analysis, a popular multivariate statistical technique to evaluate water quality in Khaf-Sangan basin, Mashhad, Northeast of Iran,”
Arab. J. Geosci., 6
(3), 893
–900
(2011). http://dx.doi.org/10.1007/s12517-011-0367-7 AJGRAA 1866-7511 Google Scholar
H. H. LvM. D. RenJ. C. Liu,
“Application of Q-model principal factor analysis and clustering method in evaluation on sandstone reservoirs of the neogene in huatugou oilfield, qaidam basin,”
Acta. Univ. Pekinensis, 42
(6), 740
–745
(2006). http://dx.doi.org/10.3321/j.issn:0479-8023.2006.06.008 Google Scholar
Y. F. YuJ. PanL. X. Xing,
“Feasibility analysis of shortwave infrared band for recognition of high temperature target,”
Remote Sens. for Land and Resources, 26
(1), 25
–30
(2014). http://dx.doi.org/10.6046/gtzyyg.2014.01.05 Google Scholar
D. M. ZengH. J. JiW. Gao,
“The R-Q mode factor analysis and correspondence analysis (In Chinese with English summary),”
Comput. Tech. Geophys. Geochem. Exp., 30
(1), 78
–80
(2008). http://dx.doi.org/10.3969/j.issn.1001-1749.2008.01.018 Google Scholar
Y. J. ZhuL. X. XingJ. Pan,
“Method of identifying high-temperature target using shortwave infrared remote sensing data (in Chinese with English summary),”
Remote Sens. Info., 26
(6), 33
–36
(2011). http://dx.doi.org/10.3969/j.issn.1000-3177.2011.06.007 Google Scholar
Y. F. YuJ. PanL. X. Xing,
“Identification of high temperature targets in remote sensing imagery based on Mahalanobis distance (in Chinese with English summary),”
Remote Sens. Info., 28
(5), 90
–94
(2013). http://dx.doi.org/10.3969/j.issn.1000-3177.2013.05.017 Google Scholar
D. D. Li,
“Research based on factors analysis of the service outsourcing industry competitiveness evaluation—China’s service outsourcing model city as an example (in Chinese with English summary),”
Suzhou Univ.,
(2012). http://dx.doi.org/10.7666/d.y2121725 Google Scholar
A. HueteK. DidanT. Miura,
“Overview of the radiometric and biophysical performance of the MODIS vegetation indices,”
Remote Sens. of Environ., 83
(1–2), 195
–213
(2002). http://dx.doi.org/10.1016/S0034-4257(02)00096-2 RSEEA7 0034-4257 Google Scholar
J. W. Boardman,
“Leveraging the high dimensionality of AVIRIS data for improved sub-pixel target unmixing and rejection of false positives: mixture tuned matched filtering,”
in Summaries 7th Annu. JPL Airborne Geoscience Workshop,
55
–56
(1998). Google Scholar
Z. H. Qinet al.,
“Mono-window algorithm for retrieving land surface temperature from Landsat TM 6 data (in Chinese with English summary),”
Acta. Geographica Sinica, 56
(4), 456
–466
(2001). Google Scholar
J. PanL. X. XingJ. C. Wen,
“Inversion method study on short wave infrared remote sensing data high temperature surface feature temperature,”
in Proc. IEEE 2nd Int. Congress on Image and Signal Process.,
1
–4
(2009). http://dx.doi.org/10.1109/CISP.2009.5301511 Google Scholar
|


