|
|
1.IntroductionThe microwave remote-sensed soil moisture generally refers to the water content contained in the upper 5 cm of soil, which serves as an important boundary condition in soil–atmosphere water transport modeling.1–3 Large-scale detection of soil moisture is indicative of potential drought and could help in forecasting crop yields and helping farmers manage their irrigation systems more efficiently.4 It may also serve as a warning for flooding5 if the soil has become too saturated to hold any further water. After decades of research, microwave remote sensing has been proven to be the most effective tool to monitor the surface soil moisture at a global scale.6 This is based on the large difference in the dielectric constant between dry soil and water. In the past few decades, various microwave sensors have been launched with a capability for monitoring soil moisture including radiometers (RMs), scatterometers, and synthetic aperture radar. Among these, L-band RM is generally considered the optimal way for soil moisture retrieval7,8 due to its high sensitivity to soil moisture and large-penetration depth. However, space-borne L-band RM with a satisfactory spatial resolution would require a long antenna which, in turn, would require a large satellite. Presently, there is only one onboard L-band RM for soil moisture ocean salinity (SMOS)9 that is designed for soil moisture retrieval. On the other side, there exist several higher-frequency RMs including scanning multichannel microwave RM (SMMR),10 the special sensor microwave imager (SSM/I),11 the advanced microwave scanning RM for EOS (AMSR-E),12 AMSR2,13 and the microwave radiation imager (MWRI) onboard the Chinese FY-3 satellite.14 These satellites have acquired long-term observations for soil moisture retrieval with an acceptable accuracy. The extensive heritage of this type of observation is requiring new source of similar data to be continued further. Through intercalibration, additional new satellite observations would increase the temporal resolution and also contribute to the long historical record for global change studies. The Chinese HY-215 is a new satellite for soil moisture monitoring, although it is the first satellite for dynamic ocean environment monitoring for China. HY-2 is designed for all-weather, all-aerospace ocean information obtained with multiple sensors onboard including the microwave scatterometer, radar altimeter, scanning microwave radiometer (RM), calibration microwave radiometer, etc. As one of the instruments onboard the HY-2 satellite, the RM operates at 6.6, 10.7, 18.7, 23.8, and 37 GHz. Therefore, it is mainly used for observations of sea surface temperature, wind speed, water vapor content, and rainfall rate. Because there are several space-borne microwave RMs with similar frequency configurations that have been launched for Earth observations, the RM sensor can also be used to measure the land surface soil moisture. This will increase the value and impact of the HY-2 satellite mission by introducing broader applications for the scientific community. The produced soil moisture product would provide a unique source of consistent information about land soil at a global scale. In addition, the acquirement of both passive and active observations would contribute to the new combined active–passive soil moisture algorithm development. Various algorithms for the retrieval of soil moisture from RM brightness temperature have been developed including single-channel algorithm (SCA),16 land parameter retrieval model (LPRM),17 physically based statistical methodology (PBSM),18 and official algorithms developed by the National Aeronautics and Space Administration (NASA) of the United States and the Japan Aerospace Exploration Agency (JAXA) according to AMSR-E configurations. All these algorithms are based on the same radiative transfer model (omega-tau), which assumes that the vegetation multiple scatterings and reflections at the air–vegetation interface are negligible. The major difference between these algorithms is the treatment of vegetation effects. In SCA, the vegetation optical depth is related to the vegetation water content with the coefficient dependent on vegetation type. Vegetation water content is independently derived from ancillary data from high-resolution optical and infrared measurements. The implementation of SCA requires additional satellite observations to be routinely available. The LPRM utilizes the RM-observed microwave polarization difference index to obtain the vegetation optical depth and synchronously retrieves three parameters. But it is found that LPRM soil moisture is systematically overestimated,19 although it has excellent correlations with in situ measurements. The PBSM algorithm is based on an analytical solution for vegetation water content using microwave vegetation indices,20 which are not considered to be sensitive to soil information. However, this algorithm is more suitable for short-vegetation conditions and is currently only calibrated over the Tibet Plateau. An investigation21 using four soil moisture networks indicates that the SCA has the highest overall accuracy and a small bias. The SCA is also the basic option for the Chinese FY-3 soil moisture products. This paper is focused on an RM-only soil moisture product from the HY-2 satellite. In this study, we implemented the SCA to retrieve the surface soil moisture. The normalized difference vegetation index (NDVI) product from the moderate-resolution imaging spectroradiometer (MODIS) was reprocessed and used to calculate the vegetation water content, which is an important parameter with which to measure the vegetation attenuation effect. To validate the retrieved soil moisture, the in situ measurements and satellite-derived soil moisture were compared over two selected dense networks: REMEDHUS in Spain22 and the CTP-SMTMN network23 over the Tibetan Plateau. Validation results are presented and analyzed in the last section with a discussion of future activities. 2.Materials and Methods2.1.Scanning Microwave RM DatasetThe soil moisture retrieval is based only on brightness temperatures obtained by HY-2 RM, which operates at five frequencies of 6.6, 10.7, 18.7, 23.8, and 37 GHz. It works at both horizontal and vertical polarizations, except for the frequency of 23.8 GHz which is only used for vertical polarization. The satellite travels in a twilight, sun-synchronous orbit with a local time of the descending node of 6:00 a.m. In this case, the air, vegetation, and surface soil can be assumed to be in thermal equilibrium, which supports the hypothesis of a soil moisture algorithm that uses a single-effective temperature for the RM observation field of view. The RM antenna adopted a conical scan approach with a constant incidence angle of 40 deg. This design is the same as the future soil moisture active-passive (SMAP) mission24 and is less sensitive to vegetation cover compared with the 55 deg of AMSR-E. The scan swath is 1600 km which enables the HY-2 observations to provide global coverage in 2 to 3 days. The RM is calibrated in orbit by using a two-point method based on a cold space reflector and the onboard hot calibration source. Table 1 is a summary of the specific configuration parameters of the HY-2 RM instrument. Table 1Configuration parameters of the HY-2 RM instrument.
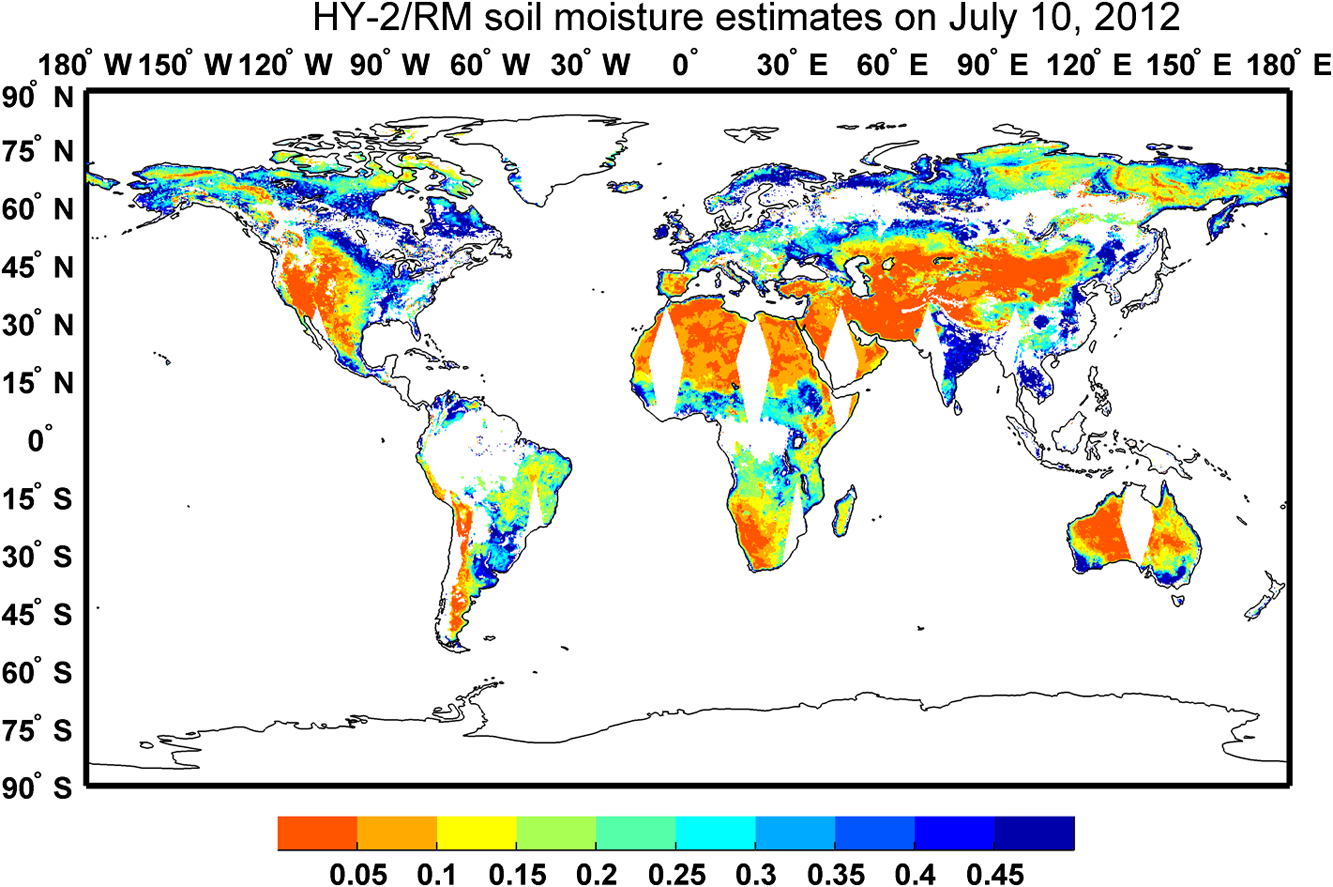
Note: V=vertical, and H=horizontal. In this study, the level 1B swath-based brightness temperature products produced by the National Satellite Ocean Application Service (NSOAS) of State Oceanic Administration are selected for the year 2012. NSOAS is responsible for providing the HY-2 satellite data. Users need to fill in the “satellite data distribution application form” to order to retrieve specific data. More information can be found in Ref. 25. The data products are distributed and formatted in Hierarchical Data Format 5. For the brightness temperature data field, a total of 150 data points along each scan cycle are included with 859 times of scanning for each half-orbit. Particularly, there are two feed horns pointing to different latitudes and longitudes, as one feed is used for 6.6 and 10.7 GHz, and the other one for 18.7, 23.8, and 37 GHz. To avoid spatial inconsistency in observations, all data were resampled to a 0.25-deg global grid with separate ascending and descending orbits. Thus, there is no need to consider whether or not the footprints match at the grid scale. 2.2.Ancillary DatasetsDuring implementation of the SCA procedure, several ancillary datasets are needed such as the NDVI, soil texture map, and land cover types. Vegetation information is required for global soil moisture retrieval from passive microwave observations, since vegetation cover attenuates soil emission and adds its own contribution to satellite observations. The vegetation effects need to be corrected to obtain the pure soil information. NDVI exploits the fact that healthy vegetation absorbs most of the visible radiation and reflects a large portion of the near-infrared radiation. Unhealthy or sparse vegetation reflects more visible radiation and less near-infrared radiation. In consequence, various studies have found that the NDVI can be used to measure the vegetation water content,26,27 which is also applied in the SCA to estimate the vegetation attenuations. In this study, the NDVI values are obtained from a vegetation index climatology database28 to enable the soil moisture algorithm to run routinely. The development of the vegetation index climatology was based on the acquisition and processing of all available MOD13A2 data (over 10 years since February 2000) from the MODIS instrument on Terra. The native data were reprojected to 0.01 deg under the geographical latitude/longitude projection. For each pixel, the NDVI values for each 16-day period were extracted for each year and then binned. Figure 1 shows the processed results for two pixels that are selected according to the two sites of REMEDHUS and CTP-SMTMN, which are used for validating HY-2 soil moisture products in Sec. 3.2. Black circles represent the original observations provided in the MODIS files. Quality control was conducted by using flags including data quality, precipitation, snow/ice, clouds, shadow, and water. Black cross-points show very low values of NDVI, corresponding to snow coverage. After quality control and screening, the data with high confidence were averaged within a 10-day period, shown as red circles. A piecewise linear interpolation would be conducted to fill in the missing/bad data points (gaps) in the time series. For the selected cropland and grassland conditions, it is found that the seasonal pattern of NDVI is clear and well represented by the climatology line. Using NDVI climatology for soil moisture retrieval not only saves time for real-time data processing, but also greatly reduces the NDVI-introduced soil moisture retrieval uncertainties caused by environmental factors. The global NDVI climatological data (0.01 deg) were resampled and averaged at a resolution of 0.25 deg comparable to the HY-2 footprint. Fig. 1MODIS/NDVI climatology (red circles) for two sites after quality flag application, averaging, and interpolation. The original observations of MODIS are drawn in black circles, with data affected by snow coverage in black crosses.  The soil texture data are obtained from Food and Agriculture Organization in a scale of 5 min by 5 min. Soil texture parameters such as clay/sand content and bulk density are required for relating the dielectric constant to soil moisture content. The land cover types are a 500-m yearly product from MODIS (MCD12Q1) based on the International Geosphere Biosphere Programme (IGBP) classification, which is used to determine the land cover-dependent parameters in the algorithm. These data values were also resampled for the HY-2 footprint. 2.3.Soil Moisture AlgorithmThe principle of passive microwave remote sensing of soil moisture is based on the significant difference in dielectric properties between liquid water and dry soil. RMs onboard the satellite observe the top-of-atmosphere brightness temperature in horizontal (H) and vertical (V) polarizations. For nominal-vegetated areas, microwave radiation from the land surface is given by the omega-tau model,29 which is a zero-order radiative transfer solution and is commonly used for soil moisture retrieval. In this equation, the first term accounts for the microwave radiation from the soil that is attenuated by the overlying vegetation. The second term defines the upward radiation coming directly from vegetation, and the third term defines the downward radiation from vegetation that is reflected by the soil and again attenuated by the vegetation. and are the thermometric temperatures for the soil and vegetation layer, respectively. is the emissivity of rough soil, which is related to the soil dielectric constant (soil moisture) and surface roughness. defines the single-scattering albedo, and refers to the single-way transmissivity of the vegetation layer, which is expressed as a function of the optical depth and incidence angle Based on the radiative transfer theory, several issues including soil/vegetation temperature, vegetation attenuation and scattering, and roughness effects need to be addressed when translating the observed brightness temperature to soil moisture. The HY-2 soil moisture retrieval algorithm used in this study is the SCA summarized by Jackson.16 This approach needs only a single-channel observation of brightness temperature and ancillary information on the land surface temperature, vegetation water content, and several corresponding vegetation parameters based on the land cover type. Radiofrequency interference at C-band is found to be severe over the United States and Japan30 and, therefore it is not recommended for global application. In this study, observation at the X-band H-pol by HY-2 is applied to globally retrieve soil moisture because H-pol microwave observations are more sensitive to soil moisture changes than the V-pol observations.1,16,31 The methodology (Fig. 2) is described in detail as follows. First, the effective land surface temperature is estimated using the brightness temperature of the -band at V-pol, based on a linear relationship established by Holmes et al.32 Although the microwave sensing depth may vary with land surface conditions (bare soil and sparse or dense vegetation), it is found that the relationship can provide a good temperature input for soil moisture retrieval.33 One assumption that is made is that the temperature of the vegetation is the same as that of the soil. This is acceptable when the temperature profile of the land surface is in an equilibrium state. This occurs in the early morning, which corresponds to the descending swath (6:00 am) of the HY-2 satellite. Then, the overall surface emissivity can be calculated for the X-band at H-pol with the effective temperature estimated. Second, the overall emissivity is corrected for vegetation effects using the zero-order radiative transfer model to obtain the emissivity of the soil. This requires estimates of the vegetation water content in order to determine the optical depth of the vegetation layer with a vegetation parameter , which may vary according to vegetation geometry, species, and associations.34 The vegetation water content is computed from the processed NDVI climatology database, based on a nonlinear relationship with its coefficients which is dependent on land cover types.35,36 In addition to this, the correction for vegetation effects requires the single-scattering albedo to describe the scattering effects caused by the vegetation. These vegetation parameters are all assigned to land cover types as prepared in ancillary datasets. It should be noted that the vegetation parameters may vary accordingly during the growth of vegetation due to the complexity of the vegetation structure and its change over time. For global applications, these parameters are set to be constants for each specific land cover type. Third, the rough soil emissivity obtained above is corrected for the amount of scattering due to the roughness of the soil surface. The surface roughness model developed by Wang and Choudhury37 is used for this correction. Constant values of 0.1 for the roughness parameter are approximated and applied for global application, although this may change slightly due to extended drought or rainfall. It is normally an appropriate choice due to the coarse resolution of passive microwave footprints.21,33,35 Then the obtained smooth surface reflectivity can be translated into the complex dielectric constant by using the Fresnel equations. The real part of the dielectric constant is inverted to the volumetric soil moisture using the soil dielectric constant model38 with known soil texture properties. 3.Results and Discussion3.1.General PerformanceTo demonstrate the performance of soil moisture derived from the methodology, the brightness temperature obtained by HY-2/RM was used as the input for the SCA to retrieve the soil moisture for the year 2012. In Fig. 3, results are offered as a daily swath composite for both descending and ascending overpasses on July 10. Figure 4 illustrates four examples of the composite soil moisture maps for January, April, July, and October. Fig. 4Global maps of HY-2/RM soil moisture for (a) January, (b) April, (c) July, and (d) October 2012.  The general performance of the HY-2 soil moisture is consistent with global spatial patterns of dry/wet climate. Arid regions such as northern Africa, the Middle East, and central Australia are show low-soil moisture values. High-soil moisture estimates over central Africa and India in July are consistent with precipitation climatology and monsoonal effects. The soil moisture particularly shows a wet to dry trend ranging from humid conditions in the south-east to the arid north-west in China. The blank area over the boreal forest, the Amazon, and other tropical rainforests represents that no retrievals were available, since the vegetation is too dense for microwaves at the HY-2 frequency (X-band) to penetrate to sense the ground soil. In winter, high latitudes are flagged due to frozen soil and snow coverage, where soil moisture retrievals are not attempted. 3.2.Validation with In Situ MeasurementsTo evaluate the HY-2 retrieved soil moisture, long-term and reliable ground measurements are needed. Due to the coarse resolution of passive microwave footprints, a reliable ground-based network should cover a spatial extent of 25 to 100 km, with replicated measurements within the footprint.21 Soil moisture sensors should be embedded in the top 5 cm of soil according to the microwave penetration depth. There are only a few networks over the world that could be used for this kind of large-scale soil moisture validation. In this study, two networks (REMEDHUS in Spain and the CTP-SMTMN network over the Tibetan Plateau) with different vegetation/climate conditions are initially selected to validate the soil moisture estimates from the HY-2 satellite. REMEDHUS22 is a soil moisture monitoring network composed of 21 stations which are located within an area of (41.1° to 41.5°N; 5.1° to 5.7°W) in a central sector of the Duero basin. The climate is semiarid continental Mediterranean climate with a mean temperature of 12°C and an annual precipitation of 385 mm. This area is dominated by croplands of cereal, irrigated crops, vineyards, and others. The growing cycle of cereal, as represented by the NDVI climatology [Fig. 1(a)], consists of the seeding period in autumn, development in spring, and harvesting in early summer. Soil moisture is measured hourly with Hydra probes (Stevens Water Monitoring Systems Inc., Portland, Oregon) integrating a soil layer on the top of 0 to 5 cm. CTP-SMTMN23 is a multiscale soil moisture and temperature monitoring network on the central Tibet Plateau of Naqu, which is located in a cold and semiarid area with an average elevation above 4500 m. This network covers an area of (31° to 32°N; 91.5° to 92.5°E), and is fairly smooth with rolling hills. This area is influenced by the South Asian summer monsoon, with an annual precipitation of 407 mm, most of which is concentrated in the monsoon season (June to September). The annual averaged temperature is , as the soil surface starts its diurnal freeze-thaw cycle in October and becomes fully frozen during December to February. The land use is mainly alpine grasslands with the growing season in summer [Fig. 1(b)]. Soil moisture is measured with EC-TM and 5TM probes (Decagon Devices Inc., Pullman, Washington) by inserting them into 0 to 5 cm into the soil. Soil moisture observations of all available stations within each network (21 for REMEDHUS and 38 for CTP-SMTMN) were averaged for the evaluation. Accordingly, satellite-estimated soil moisture within each network was also averaged for the comparison. This can ensure that both the in situ and satellite observations are a mean estimate of regional soil moisture conditions. Here, we are assuming that the averaged measurements from in situ sensors could represent the domain average soil moisture. Figure 5 plots the in situ observed and satellite-estimated soil moisture as a function of time. In situ soil moisture is plotted as a black solid line with a shaded error bar (1 standard deviation), and satellite estimations are plotted as red squares. Precipitation estimates from TRMM 3B42 daily products are also included in the figure as an independent reference. At the REMEDHUS site, the HY-2 soil moisture was able to capture several precipitation events in the spring as followed by a long period of drying. The HY-2 soil moisture estimates are higher during winter and lower during summer, which is consistent with the in situ measurements and the characteristics of the Mediterranean climate. Soil moisture appears to be overestimated during the winter, but mostly falls within the error range of in situ measurements. The overestimation can be partially explained by the frequent precipitation during this period. When rain occurs, it first wets the top layer of the soil and results in a thin saturated soil layer before infiltration. This would lead to a shallower microwave contribution depth of less than 5 cm, where the in situ sensors are installed. The representation of a different depth than the in situ measurements results in an apparent overestimation. For the CTP-SMTMN site, only unfrozen soils39 with a physical temperature above 5°C are used for comparison. As shown in the Fig. 5(b), the surface soil begins to thaw in April and the soil moisture increases until the middle of May. This freeze-thaw process is well represented by the satellite-derived soil moisture, as the microwave remote sensing is a direct measurement of the liquid water content40 as well as the ground-based sensor. During the following summer, it is found that the retrieved values follow the soil moisture dynamic range and the dry-down cycles. In October, the surface soil begins to freeze and in situ measured and satellite-derived soil moistures decrease, finally becoming a constant. Overall, the HY-2 derived soil moisture in this study shows a dynamic range consistent with in situ observations for these two areas. Fig. 5Time series plots of in situ soil moisture observations (black solid line with a shaded error bar) and HY-2 soil moisture estimates (red squares, ascending only). Precipitation estimates from TRMM 3B42 products are shown as blue bars. 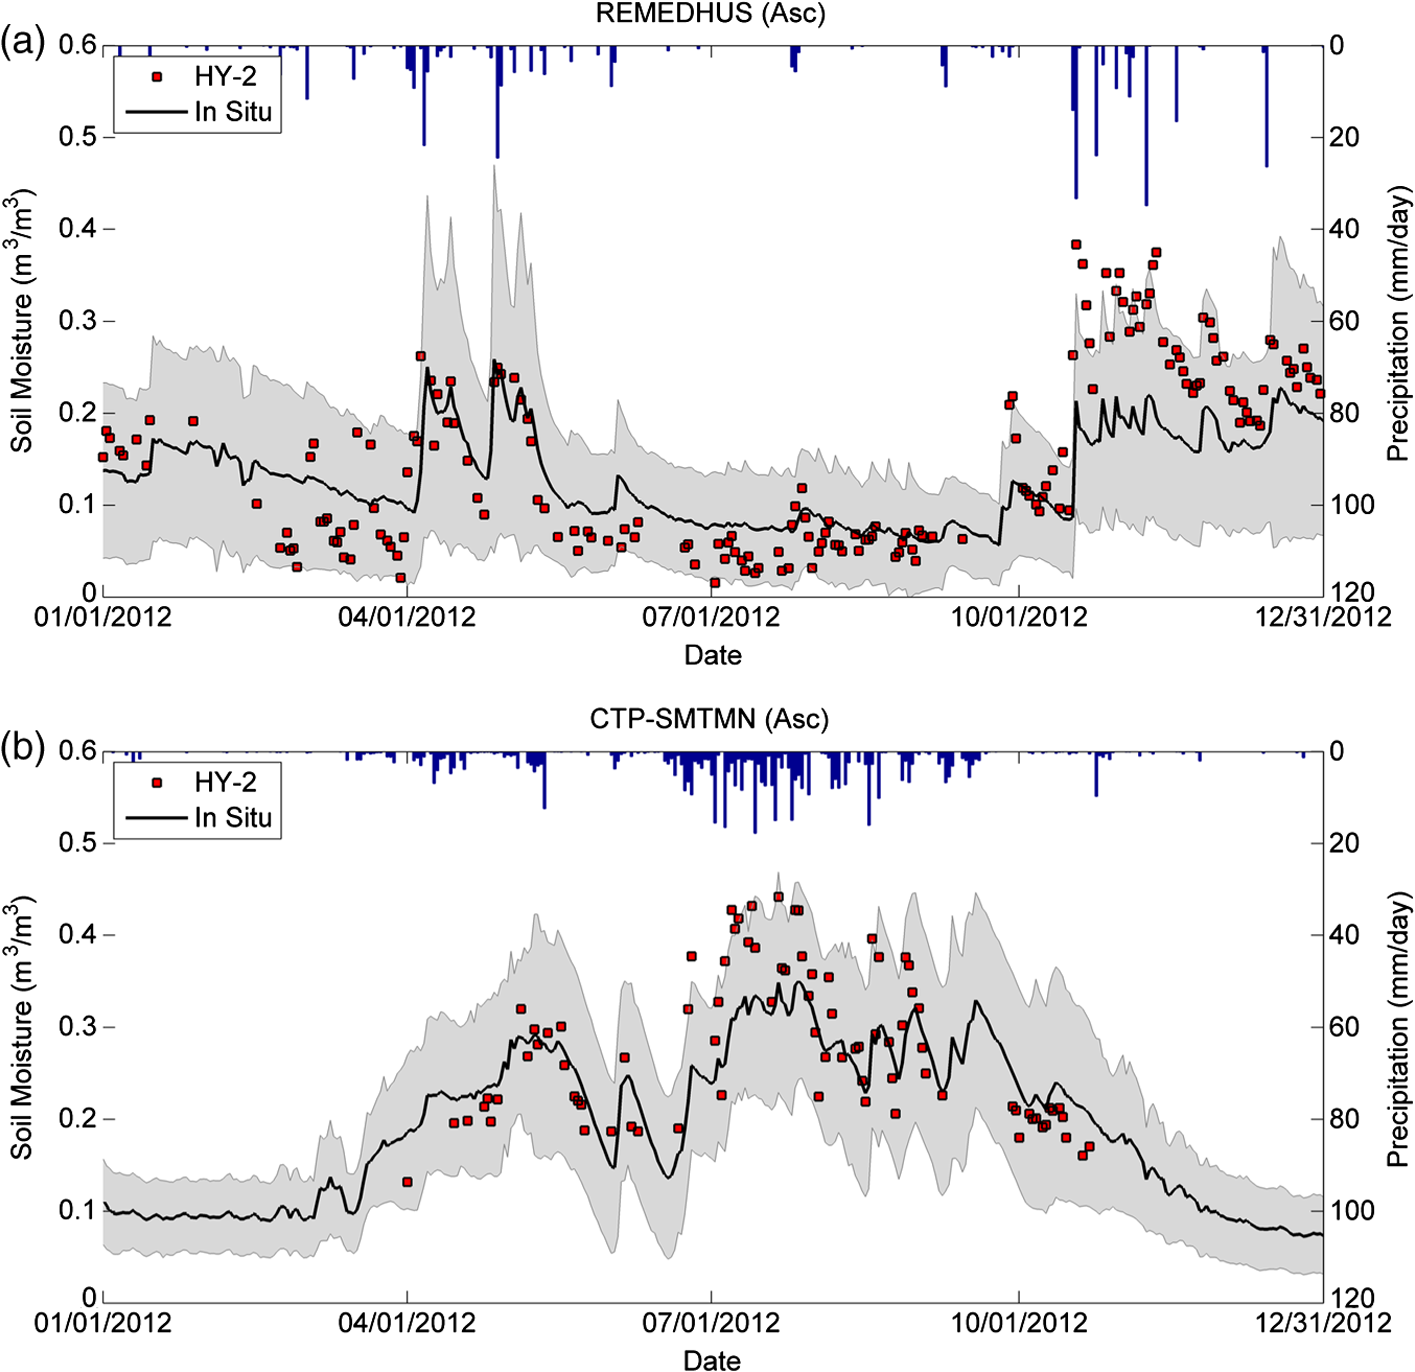 Figure 6 is a scatter plot that compares the HY-2 estimated soil moisture with the in situ observations. Table 2 is a summary of the algorithm performance statistics. The HY-2 retrieved soil moisture is found to be consistent with in situ observations for both networks. Results show a good performance by the algorithm for the land surface conditions of croplands (, , and ) and grasslands (, , and ). The HY-2 soil moisture retrieval accuracy can meet the mission target of of AMSR-E, which has a similar configuration as the HY-2. Further validation work is ongoing to include additional sites for other land surface conditions and, in turn, to calibrate the parameters used in the algorithm. Fig. 6Scatter plots between in situ soil moisture observations and HY-2 estimated soil moisture (ascending in red circles and descending in blue circles).  Table 2Performance statistics of the HY-2 soil moisture.
Note: Asc=ascending, Dsc=descending, RMSE=root mean square error, and R=correlation coefficient. 4.ConclusionsIn this study, a methodology to use HY-2/RM brightness temperature observations to retrieve the soil moisture using the SCA has been developed. The global maps of retrieved soil moisture show good consistency with climatic wet/dry patterns. Satellite-derived soil moisture was evaluated at two selected dense networks; the REMEDHUS in Spain and the CTP-SMTMN network over the Tibetan Plateau. It is concluded that the HY-2 soil moisture is able to capture the dynamic range, precipitation events, and dry-down cycles. The accuracy is satisfactory with the overall RMSE less than over these land surface conditions. More extensive and detailed field campaigns for product validation are still required. As the soil moisture may vary over the course of the day, the HY-2 product developed in this study would increase the soil moisture temporal resolution together with other sensors such as Chinese FY-3/MWRI, AMSR-E, AMSR2, and WindSat.33 Further cross-calibration between the brightness temperatures of these different sensors might be needed for producing a blended soil moisture product with a high-temporal frequency. In addition, the Aquarius/SAC-D satellite41 delivers soil moisture products with the same overpass time as the HY-2. The HY-2 soil moisture would provide a valuable dataset/target for intercomparison and the research of corresponding scaling issues. NASA is scheduled to launch an SMAP satellite24,42 with both RM and radar onboard. The features of HY-2 with both scanning microwave RM and scatterometer would provide a valuable chance for predevelopment of the combined active-passive soil moisture retrieval algorithm, which will be explored in our continuing research. AcknowledgmentsThis work was jointly supported by the National Natural Science Foundation of China (41301396), the CAS/SAFEA International Partnership Program for Creative Research Teams (KZZD-EW-TZ-09), and the National Basic Research Program of China (2013CB733406). The contributions from Dr. Thomas Jackson and Dr. Rajat Bindlish from the Hydrology and Remote Sensing Lab, USDA-ARS are gratefully acknowledged. The authors would also like to thank Xingai Song and Lei Huang for their help in processing the HY-2 satellite data. Thanks to the Goddard Earth Sciences Data and Information Services Center for providing the TRMM daily precipitation products, and thanks to the International Soil Moisture Network for providing soil moisture measurements. ReferencesT. SchmuggeP. E. O'NeillJ. R. Wang,
“Passive microwave soil moisture research,”
IEEE Trans. Geosci. Remote Sens., GE-24
(1), 12
–22
(1986). http://dx.doi.org/10.1109/TGRS.1986.289584 IGRSD2 0196-2892 Google Scholar
T. J. Jackson,
“Soil water modeling and remote sensing,”
IEEE Trans. Geosci. Remote Sens., GE-24
(1), 37
–46
(1986). http://dx.doi.org/10.1109/TGRS.1986.289586 IGRSD2 0196-2892 Google Scholar
J. A. Santanello Jr.et al.,
“Using remotely-sensed estimates of soil moisture to infer soil texture and hydraulic properties across a semi-arid watershed,”
Remote Sens. Environ., 110
(1), 79
–97
(2007). http://dx.doi.org/10.1016/j.rse.2007.02.007 RSEEA7 0034-4257 Google Scholar
T. R. McVicarD. L. B. Jupp,
“The current and potential operational uses of remote sensing to aid decisions on drought exceptional circumstances in Australia: a review,”
Agric. Syst., 57
(3), 399
–468
(1998). http://dx.doi.org/10.1016/S0308-521X(98)00026-2 AGSYD5 0308-521X Google Scholar
R. BindlishW. T. CrowT. J. Jackson,
“Role of passive microwave remote sensing in improving flood forecasts,”
IEEE Geosci. Remote Sens. Lett., 6
(1), 112
–116
(2009). http://dx.doi.org/10.1109/LGRS.2008.2002754 IGRSBY 1545-598X Google Scholar
J. P. Wigneronet al.,
“Retrieving near-surface soil moisture from microwave radiometric observations: current status and future plans,”
Remote Sens. Environ., 85
(4), 489
–506
(2003). http://dx.doi.org/10.1016/S0034-4257(03)00051-8 RSEEA7 0034-4257 Google Scholar
J. R. Wanget al.,
“The effects of soil moisture, surface roughness, and vegetation on L-band emission and backscatter,”
IEEE Trans. Geosci. Remote Sens., GE-25
(6), 825
–833
(1987). http://dx.doi.org/10.1109/TGRS.1987.289754 IGRSD2 0196-2892 Google Scholar
Y. H. Kerret al.,
“Soil moisture retrieval from space: the soil moisture and ocean salinity (SMOS) mission,”
IEEE Trans. Geosci. Remote Sens., 39
(8), 1729
–1735
(2001). http://dx.doi.org/10.1109/36.942551 IGRSD2 0196-2892 Google Scholar
Y. H. Kerret al.,
“The SMOS mission: new tool for monitoring key elements of the global water cycle,”
Proc. IEEE, 98
(5), 666
–687
(2010). http://dx.doi.org/10.1109/JPROC.2010.2043032 IEEPAD 0018-9219 Google Scholar
A. GuhaV. Lakshmi,
“Use of the scanning multichannel microwave radiometer (SMMR) to retrieve soil moisture and surface temperature over the central United States,”
IEEE Trans. Geosci. Remote Sens., 42
(7), 1482
–1494
(2004). http://dx.doi.org/10.1109/TGRS.2004.828193 IGRSD2 0196-2892 Google Scholar
S. Palosciaet al.,
“A multifrequency algorithm for the retrieval of soil moisture on a large scale using microwave data from SMMR and SSM/I satellites,”
IEEE Trans. Geosci. Remote Sens., 39
(8), 1655
–1661
(2001). http://dx.doi.org/10.1109/36.942543 IGRSD2 0196-2892 Google Scholar
E. G. Njokuet al.,
“Soil moisture retrieval from AMSR-E,”
IEEE Trans. Geosci. Remote Sens., 41
(2), 215
–229
(2003). http://dx.doi.org/10.1109/TGRS.2002.808243 IGRSD2 0196-2892 Google Scholar
K. Imaokaet al.,
“Global change observation mission (GCOM) for monitoring carbon, water cycles, and climate change,”
Proc. IEEE, 98
(5), 717
–734
(2010). http://dx.doi.org/10.1109/JPROC.2009.2036869 IEEPAD 0018-9219 Google Scholar
H. Yanget al.,
“The FengYun-3 microwave radiation imager on-orbit verification,”
IEEE Trans. Geosci. Remote Sens., 49
(11), 4552
–4560
(2011). http://dx.doi.org/10.1109/TGRS.2011.2148200 IGRSD2 0196-2892 Google Scholar
X. Jianget al.,
“The HY-2 satellite and its preliminary assessment,”
Int. J. Digital Earth, 5
(3), 266
–281
(2012). http://dx.doi.org/10.1080/17538947.2012.658685 1753-8947 Google Scholar
T. J. Jackson,
“III. Measuring surface soil moisture using passive microwave remote sensing,”
Hydrol. Processes, 7
(2), 139
–152
(1993). http://dx.doi.org/10.1002/(ISSN)1099-1085 HYPRE3 1099-1085 Google Scholar
M. OweR. de JeuT. Holmes,
“Multisensor historical climatology of satellite-derived global land surface moisture,”
J. Geophys. Res., 113
(F1), F01
–002
(2008). http://dx.doi.org/10.1029/2007JF000769 JGREA2 0148-0227 Google Scholar
T. Zhaoet al.,
“A physically based statistical methodology for surface soil moisture retrieval in the Tibet Plateau using microwave vegetation indices,”
J. Geophys. Res., 116
(D8), D08116
(2011). http://dx.doi.org/10.1029/2010JD015229 JGREA2 0148-0227 Google Scholar
C. Champagneet al.,
“Evaluation of soil moisture derived from passive microwave remote sensing over agricultural sites in Canada using ground-based soil moisture monitoring networks,”
Int. J. Remote Sens., 31
(14), 3669
–3690
(2010). http://dx.doi.org/10.1080/01431161.2010.483485 IJSEDK 0143-1161 Google Scholar
T. Zhaoet al.,
“Estimating vegetation water content during a growing season of cotton,”
in 2011 IEEE Int. Geoscience and Remote Sensing Symposium (IGARSS),
791
–794
(2011). Google Scholar
T. J. Jacksonet al.,
“Validation of advanced microwave scanning radiometer soil moisture products,”
IEEE Trans. Geosci. Remote Sens., 48
(12), 4256
–4272
(2010). http://dx.doi.org/10.1109/TGRS.2010.2051035 IGRSD2 0196-2892 Google Scholar
N. Sanchezet al.,
“Validation of the SMOS L2 soil moisture data in the REMEDHUS network (Spain),”
IEEE Trans. Geosci. Remote Sens., 50
(5), 1602
–1611
(2012). http://dx.doi.org/10.1109/TGRS.2012.2186971 IGRSD2 0196-2892 Google Scholar
K. Yanget al.,
“A multiscale soil moisture and freeze-thaw monitoring network on the third pole,”
Bull. Am. Meteorol. Soc., 94
(12), 1907
–1916
(2013). http://dx.doi.org/10.1175/BAMS-D-12-00203.1 BAMIAT 0003-0007 Google Scholar
D. Entekhabiet al.,
“The soil moisture active passive (SMAP) mission,”
Proc. IEEE, 98
(5), 704
–716
(2010). http://dx.doi.org/10.1109/JPROC.2010.2043918 IEEPAD 0018-9219 Google Scholar
”Satellite data distribution application form,”
http://www.nsoas.gov.cn/gy/channel/ Google Scholar
E. R. Hunt Jr.et al.,
“Comparison of vegetation water contents derived from shortwave-infrared and passive-microwave sensors over central Iowa,”
Remote Sens. Environ., 115
(9), 2376
–2383
(2011). http://dx.doi.org/10.1016/j.rse.2011.04.037 RSEEA7 0034-4257 Google Scholar
T. J. Jacksonet al.,
“Vegetation water content mapping using Landsat data derived normalized difference water index for corn and soybeans,”
Remote Sens. Environ., 92
(4), 475
–482
(2004). http://dx.doi.org/10.1016/j.rse.2003.10.021 RSEEA7 0034-4257 Google Scholar
R. BindlishT. J. JacksonT. Zhao,
“A MODIS-based vegetation index climatology,”
Proc. SPIE, 8156 815603
(2011). http://dx.doi.org/10.1117/12.890311 PSISDG 0277-786X Google Scholar
T. Moet al.,
“A model for microwave emission from vegetation-covered fields,”
J. Geophys. Res., 87
(C13), 11229
–11237
(1982). http://dx.doi.org/10.1029/JC087iC13p11229 JGREA2 0148-0227 Google Scholar
E. G. Njokuet al.,
“Global survey and statistics of radio-frequency interference in AMSR-E land observations,”
IEEE Trans. Geosci. Remote Sens., 43
(5), 938
–947
(2005). http://dx.doi.org/10.1109/TGRS.2004.837507 IGRSD2 0196-2892 Google Scholar
R. Pancieraet al.,
“Evaluation of the SMOS L-MEB passive microwave soil moisture retrieval algorithm,”
Remote Sens. Environ., 113
(2), 435
–444
(2009). http://dx.doi.org/10.1016/j.rse.2008.10.010 RSEEA7 0034-4257 Google Scholar
T. R. H. Holmeset al.,
“Land surface temperature from Ka band (37 GHz) passive microwave observations,”
J. Geophys. Res., 114
(D4), D04113
(2009). http://dx.doi.org/10.1029/2008JD010257 JGREA2 0148-0227 Google Scholar
R. M. ParinussaT. R. H. HolmesR. A. M. de Jeu,
“Soil moisture retrievals from the WindSat spaceborne polarimetric microwave radiometer,”
IEEE Trans. Geosci. Remote Sens., 50
(7), 2683
–2694
(2012). http://dx.doi.org/10.1109/TGRS.2011.2174643 IGRSD2 0196-2892 Google Scholar
T. J. JacksonT. J. Schmugge,
“Vegetation effects on the microwave emission of soils,”
Remote Sens. Environ., 36
(3), 203
–212
(1991). http://dx.doi.org/10.1016/0034-4257(91)90057-D RSEEA7 0034-4257 Google Scholar
T. J. Jacksonet al.,
“Soil moisture retrieval using the C-band polarimetric scanning radiometer during the Southern Great Plains 1999 Experiment,”
IEEE Trans. Geosci. Remote Sens., 40
(10), 2151
–2161
(2002). http://dx.doi.org/10.1109/TGRS.2002.802480 IGRSD2 0196-2892 Google Scholar
M. T. Yilmazet al.,
“Vegetation water content during SMEX04 from ground data and Landsat 5 Thematic Mapper imagery,”
Remote Sens. Environ., 112
(2), 350
–362
(2008). http://dx.doi.org/10.1016/j.rse.2007.03.029 RSEEA7 0034-4257 Google Scholar
J. R. WangB. J. Choudhury,
“Remote sensing of soil moisture content, over bare field at 1.4 GHz frequency,”
J. Geophys. Res., 86
(C6), 5277
–5282
(1981). http://dx.doi.org/10.1029/JC086iC06p05277 JGREA2 0148-0227 Google Scholar
J. R. WangT. J. Schmugge,
“An empirical model for the complex dielectric permittivity of soils as a function of water content,”
IEEE Trans. Geosci. Remote Sens., GE-18
(4), 288
–295
(1980). http://dx.doi.org/10.1109/TGRS.1980.350304 IGRSD2 0196-2892 Google Scholar
T. Zhaoet al.,
“A new soil freeze/thaw discriminant algorithm using AMSR-E passive microwave imagery,”
Hydrol. Processes, 25
(11), 1704
–1716
(2011). http://dx.doi.org/10.1002/hyp.v25.11 HYPRE3 1099-1085 Google Scholar
L. Zhanget al.,
“Estimate of phase transition water content in freeze-thaw process using microwave radiometer,”
IEEE Trans. Geosci. Remote Sens., 48
(12), 4248
–4255
(2010). http://dx.doi.org/10.1109/TGRS.2010.2051158 IGRSD2 0196-2892 Google Scholar
D. M. Le Vineet al.,
“Aquarius: an instrument to monitor sea surface salinity from space,”
IEEE Trans. Geosci. Remote Sens., 45
(7), 2040
–2050
(2007). http://dx.doi.org/10.1109/TGRS.2007.898092 IGRSD2 0196-2892 Google Scholar
X. Zhanet al.,
“A method for retrieving high-resolution surface soil moisture from Hydros L-band radiometer and Radar observations,”
IEEE Trans. Geosci. Remote Sens., 44
(6), 1534
–1544
(2006). http://dx.doi.org/10.1109/TGRS.2005.863319 IGRSD2 0196-2892 Google Scholar
BiographyTianjie Zhao is a research assistant at the Institute of Remote Sensing and Digital Earth, Chinese Academy of Sciences. He received his BS and PhD degrees in cartography and geography information systems from Beijing Normal University, in 2007 and 2012, respectively. His current research interests are microwave remote sensing of soil moisture and physical parameters of frozen soil. Since 2013, he has been involved in the development of a new satellite Water Cycle Observation Mission (WCOM). Jiancheng Shi received his BA degree from the University of Lanzhou, Lanzhou, China, and the MA and PhD degrees in geography from the University of California, Santa Barbara (UCSB), California, in 1982, 1987, and 1991, respectively. In 2010, he became the director and senior research scientist with the State Key Laboratory of Remote Sensing Science. His current research interests include microwave remote sensing of water cycle-related components and data assimilation. He is the principle investigator of the Water Cycle Observation Mission (WCOM). |
||||||||||||||||||||||||||||||||||||||||||||||||||||||||||||||||||||||||||||||||||||||||||||