|
|
1.IntroductionSnow has a significant impact on surface energy balance, crop frost, and water cycles due to its high albedo, thermal insulation, and melting water.1 In situ measurements and space observations are the two most common approaches for snow monitoring. Although in situ measurements provide the most accurate snow observations, they are subject to environmental accessibility and sparse distributions.2 Passive microwave remote sensors, for example, scanning microwave multiband radiometer, special sensor microwave/imager, advanced microwave scanning radiometer-EOS (AMSR-E), are used mostly for continental and global scale studies because of their daily repeat cycle and ability to penetrate cloud. But their coarse spatial resolution (25 km or coarser) constrains further applications for mountainous areas in local and regional scales. In contrast, the active microwave remote sensors, such as advanced synthetic aperture radar and interferometric synthetic aperture radar, have higher spatial resolution but a longer repeat cycle and are not practical for daily operation of snow cover monitoring.3–5 Optical remote sensors, such as Landsat and others with higher spatial resolutions, can be used to accurately map local and regional snow cover conditions under clear sky, but are limited for daily operational use due to their longer repeat cycle and inability to penetrate cloud. The moderate resolution imaging spectral radiometer (MODIS) onboard both Terra and Aqua satellites scans the Earth twice per day during daytime in most parts of the world. MODIS snow cover products have been widely applied for snow cover mapping and climatic and hydrologic studies, although cloud seriously impairs the advantages of MODIS images.6–9 For instances, in Northern Xinjiang, China, and on the Colorado Plateau, USA, the annual mean cloud cover is around 50% and can be up to 95% in several straight days.2,10 Various approaches have been developed to mitigate the influence of cloud obscuration for the MODIS standard snow cover products. The first common step of most cloud-removal approaches10–17 is to combine the MODIS Terra and Aqua daily snow cover products to generate a daily cloud-less product ( less as compared with the MODIS Terra or Aqua alone). The difference of various approaches comes from the further processing steps to remove those cloud-blocked pixels. The first type is to use passive microwave snow water equivalent product (AMSR-E, 25-km spatial resolution) to replace the remaining cloud-blocked pixels.4–6 This method greatly mitigates the impact of cloud but also reduces the spatial resolution of MODIS snow cover images, especially for spatially extensive cloud-blocked areas (from 500 m to 25 km). The second type is to use the snowline or spatial filter to remove the remaining cloud-blocked pixels.11–14 The snowline method does not replace all cloud-blocked pixels with snow or land.13 The effect of spatial filter that interpolates from nearby cloud-free pixels is limited for spatially extensive cloud-blocked areas.18 The third type applies a temporal filter to composite multiday snow cover images (both forward and backward) to minimize the impact of cloud.10–17 The snowline and spatial filters methods are normally applied together with or after the temporal filter to further reduce the cloud-blocked pixels. The aforementioned methods sacrifice either spatial resolution with no remaining cloud pixels (the first type) or temporal resolution with still remaining cloud-blocked pixels (the second and third types). The forward combination is a retrospective estimate which requires data past the date and is useful for monthly or seasonal reanalysis. Dozier et al.18 adopted a continuous backward combination approach to assimilate cloud-free pixels in their daily fractional snow cover products for runoff forecasting, but did not generate a daily cloud-free snow cover product. In this study, we present a new multiday backward cloud-removal approach to produce daily cloud-free snow cover product. This method includes two steps. The first step is basically the same as the aforementioned methods to combine daily MODIS Terra (MOD10A1) and Aqua (MYD10A1) snow cover images to generate a daily cloudless ( less) snow cover image MODMYD_DC. The second step, however, is unique to all other methods and is a multiday backward replacement, i.e., the cloud-blocked pixels on the current day combination of MODMYD_DC () are replaced by the cloud-free pixels on the previous day combination of MODMYD_DC (), continuing the backward replacement until all cloud-blocked pixels are replaced. The resulting image is a daily cloud-free snow cover product (i.e., MODMYD_MC). This daily cloud-free snow cover product is then validated using the in situ snow depth observations in the Heilongjiang Province and is finally used to analyze the spatiotemporal variations of snow cover in the XiaoXing’AnLing watershed in northeast China. 2.Data and Test AreaTerra and Aqua satellites launched in December 1999 and May 2002 pass the equator at the local time of 10:30 am and 1:30 pm, respectively. MODIS instrument is one of the key sensors mounted on both satellites. Both Terra and Aqua MODIS snow cover products apply the same algorithm and have similar accuracy on snow cover mapping.6 MODIS standard snow cover products include the daily MOD10A1 (Terra) and MYD10A1 (Aqua) and the 8-day maximum composite of MOD10A2 and MYD10A2 with a 500-m spatial resolution and 10 deg by 10 deg tiles, and the daily, 8-day maximum and monthly mean snow cover products of MOD10C1-3 and MYD10C1-3 with a 0.05 deg global climate model pixel.19,20 MOD10A1 and MYD10A1 are used in this study. The MODIS tile of h26v04 covering the central part of the Heilongjiang Province and neighboring provinces is selected for the algorithm development (Fig. 1). A total of 3962 MOD10A1 and 3429 MYD10A1 images are used during the 11 hydrologic years from 2000 to 2011 (September 1 to August 31 of the following year). Fig. 1The cloud-free snow cover image from MODIS/Terra and Aqua combination on January 30, 2006, in northeast China (h26v04). The red dots are the ground snow depth monitoring stations, and the blue polygon in the central north of Heilongjiang Province is the XiaoXing’AnLing watershed.  The collected in situ snow depth data are daily measurements rounded to 1 cm from 2000 to 2010. There are 53 weather stations within the umbrella of MODIS tile h26v04 in the Heilongjiang Province. The elevations of those stations range from 53 to 550 m above sea level. In comparison, MODIS pixel values collocated with one weather station are extracted to compare with the corresponding in situ snow depth data. To minimize the impacts of the spatial representative of in situ measurements, the snow depth data are used to validate the accuracy of snow cover mapping, and other data of 0 cm (no snow) and 1 to 3 cm (patchy snow) are also provided for assistance.2,6,11 3.New Cloud-Removal AlgorithmThe new cloud-removal algorithm consists of two automatic steps (Fig. 2). The first step is to combine the snow cover images of MOD10A1 and MYD10A1 to generate a daily maximum snow cover image called MODMYD_DC.10 The second step is a multiday backward replacement, i.e., the cloud-blocked pixels on the current day combination of MODMYD_DC () are replaced by the cloud-free pixels on the previous day combination of MODMYD_DC (), continuing the backward replacement on day () until all cloud-blocked pixels are replaced. There is no limit for , the number of cloud-persistent days (CPDs), but is normally less than 5 days. Fig. 2The flowchart of the cloud-removal algorithm, consisting of two steps: the daily combination and the multiday replacement. Day () is the current day, day () is one day before the current day, and is the number of cloud-persistent days (CPDs). 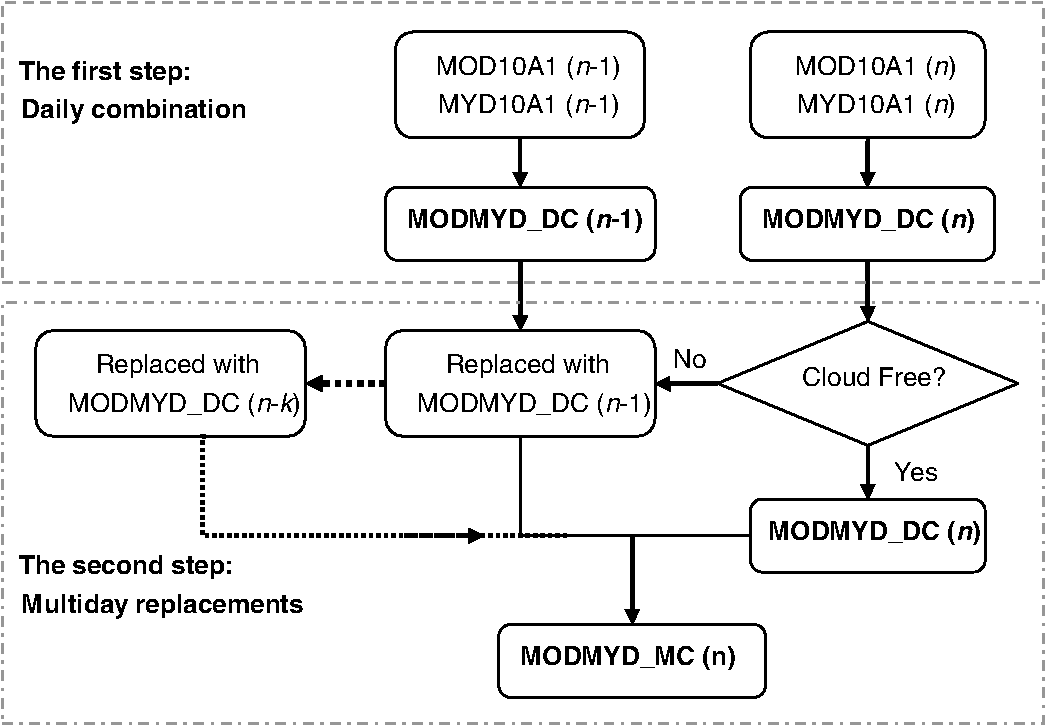 Along with the cloud-free snow cover image, the algorithm also generates an image to record the CPD on each pixel. CPD is a relative number (days) against the current day and indicates the clear sky date of each pixel on the new cloud-free snow cover image. In other words, CPD records the days when the cloud-blocked pixel on the current day image is replaced with a cloud-free pixel on a previous day image(s) and acts like a quality flag for the new cloud-free snow cover images. For instance, if , it indicates that this pixel is cloud free in the current day image and does not require replacement. If , it indicates that the cloud-covered pixels on the current day are replaced as cloud free one day before the current day; if , it indicates that the cloud-covered pixels on the current day and the day before are replaced as cloud free two days before the current day, and so on. As the CPD gets larger, the new cloud-free snow cover image has a greater uncertainty. 4.Accuracy Assessment4.1.Efficiency of Cloud-RemovalMODIS tile h26v04 covering northeastern China is applied to test the cloud-removal algorithm and the new daily cloud-free snow cover product. As shown in Fig. 3, in the first 60 days of 2004, the daily combination algorithm removes the cloud-blocked pixels by of the total pixels after combining MOD10A1 and MYD10A1. After 3-day replacements, the cloud cover dramatically declines to below 10% and continues to decline as continuous replacements are made. Since the MOD10A1 was the first available at the end of February 2000, a new daily cloud-free snow cover image could be generated each day at the beginning of April 2000 after the first month’s initial combination. Fig. 3Time series plot of cloud cover in the four snow cover products (MOD10A1, MYD10A1, MODMYD_DC, and MODMYD_MC) on January and February 2004.  The annual mean cloud cover derived from the daily MODIS snow cover product is around 50% in the 11 years within the MODIS tile h26v04, leading to a large underestimate of annual mean snow cover (6%) (Table 1). The daily combination (MODMYD_DC) of MOD10A1 and MYD10A1 reduces the annual mean cloud cover to 36% (14% to 18% cloud reduction) and increases the annual mean snow cover to 10%. After multiday replacements, the new daily cloud-free snow cover product (MODMYD_MC) retrieves an annual mean snow cover of 19%, with 68 mean snow-covered days (SCDs), and a minimum (35days) in 2002 (hydrologic year) and maximum (86 days) in 2010. Table 1Mean cloud and snow cover derived from the four snow cover products within MODIS tile of H26V04. The mean cloud cover for MODMYD_MC was zero.
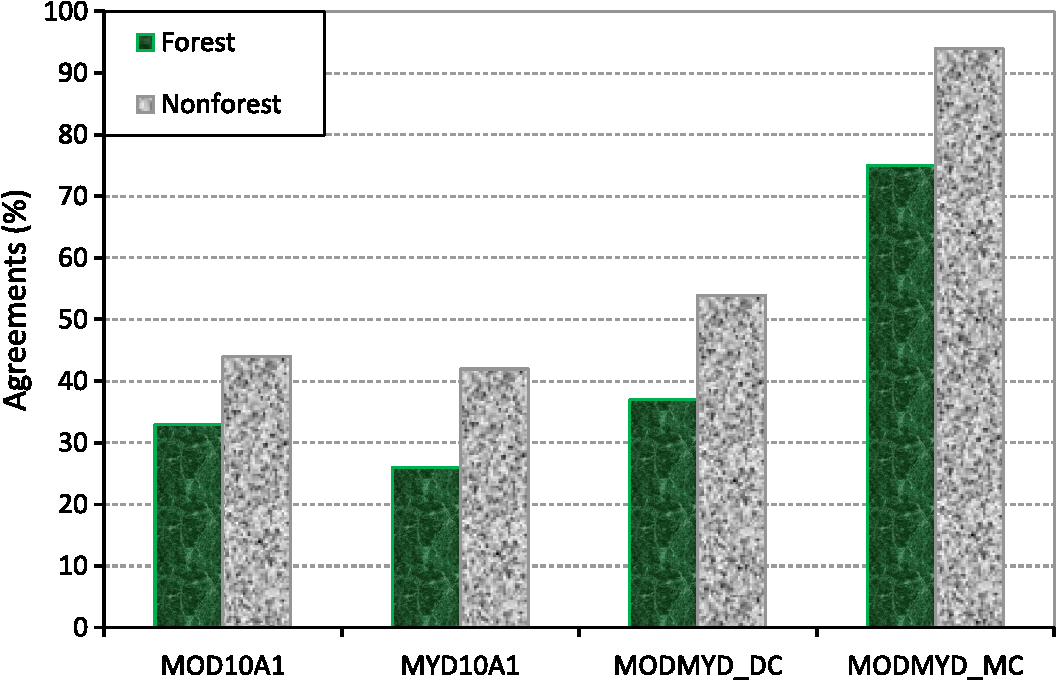
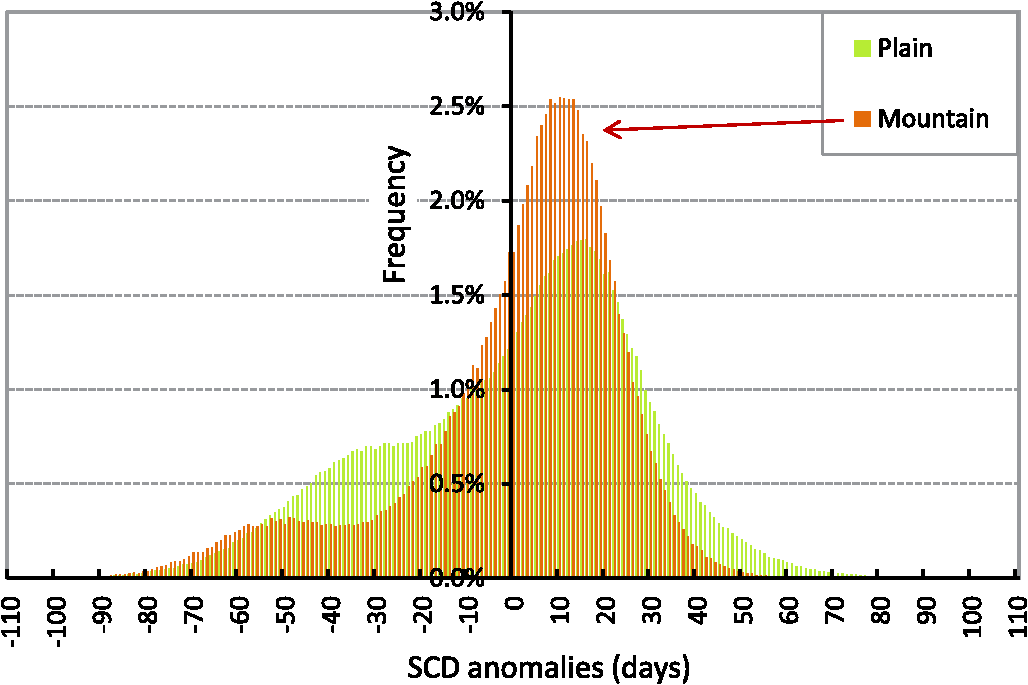
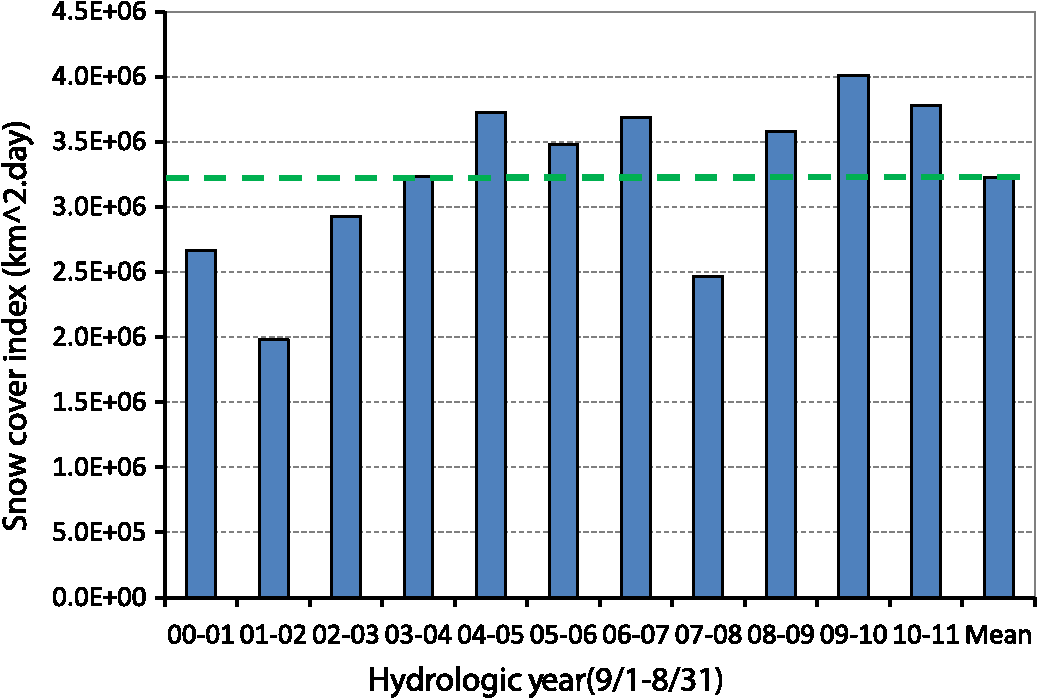
Figure 4 illustrates the mean percentage of the cloud-free pixels on MODMYD_MC images against the nine CPD categories of 0, 1, 2, 3, 4, 5, 6, 7 days, and days during 2000 to 2011. The cloud-free pixels on the current day combination images were dominant (57%), and those for and 2 were next at 18% and 9%, respectively. The total cloud-free pixels were 88% after the 4 days’ backward replacements. This is similar to the results of Xie et al.10 who found that a snow cover image was generated with a cloud cover of less than 10% within 2.5 days on average in Northern Xinjiang, China, and on the Colorado Plateau, USA. Fig. 4Mean agreements of snow and land classification against in situ snow depth measurements and the mean percentage of cloud-free pixels during 2000 to 2011. On the horizontal -axis, indicates that this pixel is cloud-free on the current day and does not need to be replaced; indicates that the cloud-blocked pixels on the current day are replaced as cloud-free one day before; means that the cloud-blocked pixels are replaced as cloud-free two days before; and so on. 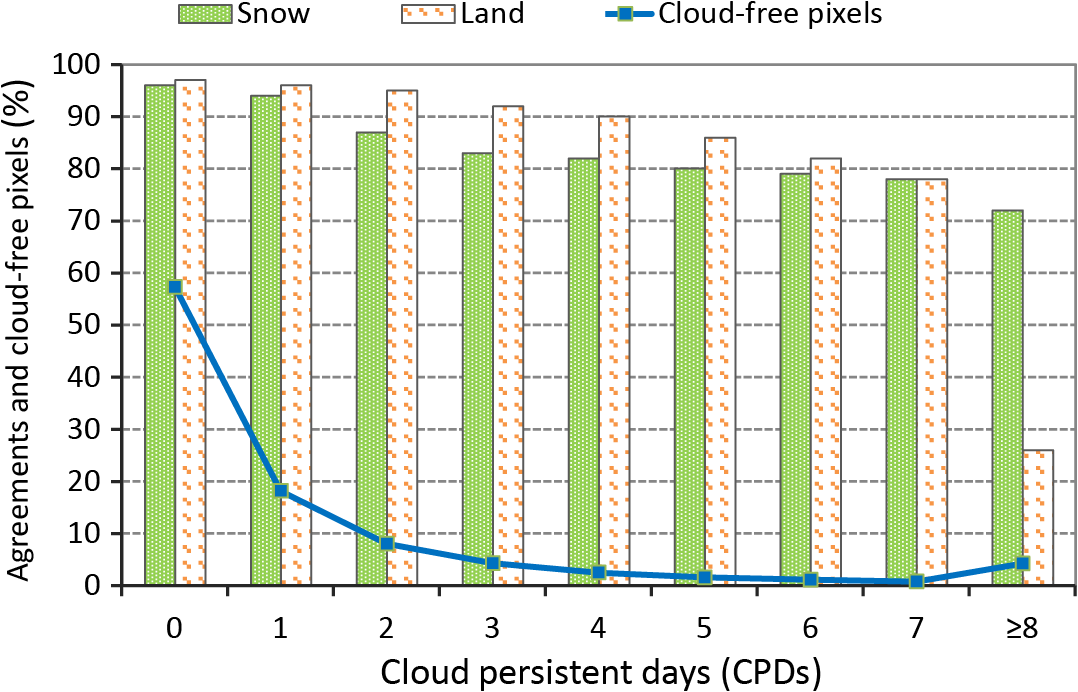 4.2.Assessment of Snow ClassificationThe in situ snow depth measurements at 53 meteorological stations within the MODIS tile h26v04 and in the Heilongjiang Province are used to validate the agreement of snow and land classification for the four snow cover products. In comparison, the in situ snow depth data are divided into three groups:2,6,10 (1) snow depth (20% of all data), which assumes that the corresponding entire MODIS pixel is covered by snow; (2) (8%), which assumes that the corresponding MODIS pixel is partly covered by snow; and (3) (72%), no snow. Other snow depth thresholds of 1 cm,21 2 cm,22 and 2.54 cm23,24 were also used in literature. The mean agreements of snow and land classification with in situ measurements for MOD10A1 and MYD10A1 are as low as and , respectively, mainly due to the blockage of cloud (Fig. 5). MOD10A1 in the morning has slightly less cloud and higher agreement than MYD10A1 in the afternoon. MODMYD_DC, the daily combination of MOD10A1 and MYD10A1, reduces the cloud cover by and correspondingly increases the agreement of snow classification to 51%. MODMYD_MC, the new cloud-free snow cover product, increases the snow and land agreements to 91% and 93%, respectively. Moreover, the number of CPD for the MODMYD_MC negatively affects the agreements of land and snow classifications. The agreement of snow classification is 95% and 93% when pixels are cloud free on the current day () and one day before (), respectively. It decreases to 88% when and is below 80% when days (Fig. 4). Fig. 5The mean snow and land classification agreements of the four snow cover products and the cloud cover of the first three products. Only measured snow depth data (Land, no snow) are used in comparison. 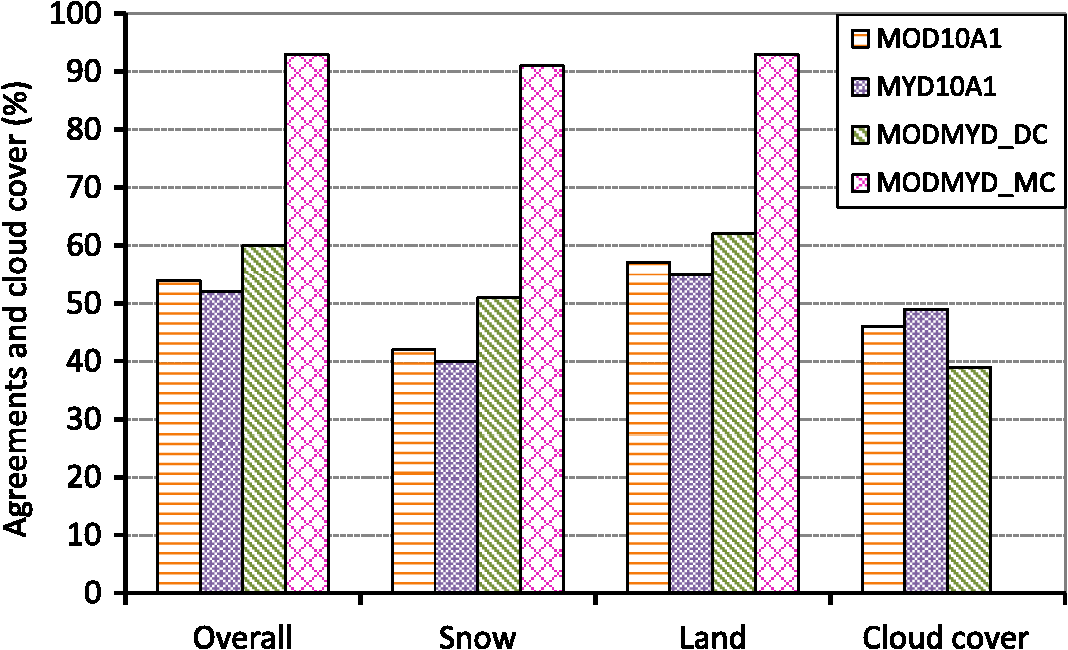 The agreements of snow classification for the fractional snow cover conditions (, 2, and 3 cm) in the above four products are 22%, 13%, 24%, and 62%, respectively (not shown). The low agreements are partially due to the limitations of spatial representatives of points in situ measurements, which cannot represent the patchy snow cover situations over a MODIS pixel of 500 m. To illustrate the impacts of the widespread forest in northeast China on the agreement of snow classification, the land cover types around each station are extracted using the MODIS land cover product of MCD12Q1 in 2009.25 MCD12Q1 was produced using ensemble supervised approaches with different classification systems. MCD21Q1 consists of five different land cover classifications in each calendar year. The 17-class International Geosphere -Biosphere Programme classification is used in this study. The land cover types around those stations include deciduous coniferous forest, deciduous forest, shrub, grass, and crops and are reclassified into forest (coniferous forest, deciduous forest, and shrub) and nonforest (grass and crops). The mean agreements of snow classification over forested areas are lower than those for nonforested areas (Fig. 6). 4.3.Assessment of Snow-Covered DaysThe annual SCDs in each hydrologic year (from September 1 to August 31) are computed using the new daily cloud-free snow cover images (MODMYD_MC) from 2000 to 2011. SCDs are also validated by in situ snow depth data at the same 53 stations, but with a loose constraint to the snow depth data ().22 The agreement between the two SCDs is determined by Eq. (1)7 where is the agreement, and and represent the SCDs derived from MODIS and calculated from in situ snow depth data.The mean agreement in SCD during the 11 hydrologic years is shown in Fig. 7. SCDs varied from 50 to 150 days at those stations and most were in a range from 80 to 120 days. The MODIS-derived SCD is in agreement with the in situ SCD [, mean difference (MODIS − in situ) ], and the former is slightly shorter than the latter partially due to the patchy snow cover. We compare MODIS-derived SCDs to in situ SCDs using different snow depth thresholds of 1, 2, 3, and 4 cm. The best results we present here are from 2 cm. 5.Snow Cover VariationsThe in situ measurements of snow depth data are limited to represent the spatial variations of snow cover. Satellite observations expand beyond in situ locations to monitor the detailed variation of land cover including snow cover at the regional and even global scales. The new daily cloud-free snow cover images generated in this study are used to illustrate the spatiotemporal variations of snow cover in the XiaoXing’AnLing area in northeast China as a case study. MODIS SCD describes the total SCDs for each 500-m pixel in a hydrological year from September 1st to August 31st in the following year.7 The MODIS SCD is calculated from MODMYD_MC images. If a pixel value is 200 (snow), then this pixel is covered by snow on the current day and its SCD equals to 1; otherwise its SCD is 0. The annual SCD is obtained by summarizing all the SCD pixels in a hydrologic year. The mean SCD is the multiyears' mean SCD within the 11 hydrological years from 2000 to 2001 to 2010 to 2011. SCD anomalies are the deviation of SCD in each hydrologic year against the 11-year mean SCD. 5.1.Snow-Covered DaysThe spatial distribution of the 11-year mean SCD is illustrated in Fig. 8 in the XiaoXing’AnLing area. SCD is classified into seven categories: shorter than 30 days, 30 to 60 days, 61 to 90 days, 91 to 120 days, 121 to 150 days, 151 to 180 days, and longer than 180 days. Most pixels have an SCD in a range from 60 to 150 days. The mountainous areas have a much longer SCD than the plains. Fig. 8Spatial distribution of mean annual SCDs (a) and elevation (b) in the XiaoXing’AnLing area from September 1, 2000, to August 31, 2011. The light green line (in the right panel) is the 500-m elevation contour and is assumed to be the boundary between mountainous areas (DEM , light-color areas) and plains (, dark-color areas). 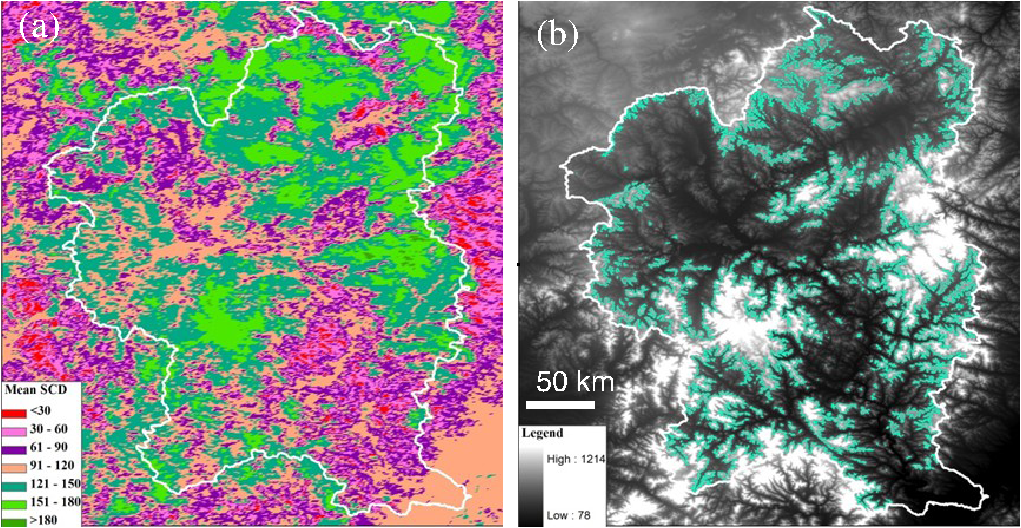 The spatial distribution of SCD anomalies (deviation from the 11-year mean) of each hydrologic year are demonstrated in Fig. 9. The SCD anomalies are also divided into seven groups with different colors: shorter than , to , to days, to 10 days (black, no change), 11 to 30 days, 31 to 60 days, and longer than 60 days. Red colors are below the mean and the green colors are above the mean. SCDs in hydrologic years of 2000 to 2001 (not shown in Fig. 9 due to space setting), 2001 to 2002, and 2007 to 2008 were much shorter than the mean, especially in 2001 to 2002, when the SCDs in one third of the area were 60 days shorter than the mean. The 2003 to 2004 hydrologic year was a neutral year with the SCD close to the mean. In the rest of the years, SCDs were longer than the mean, especially in 2009 to 2010, when SCDs were 30 days longer than the mean in almost the entire area. Overall, SCDs demonstrated an increasing pattern during the 11 hydrologic years in this area. This increase trend is also observed by Chen et al.22 and seems negatively correlated with the air temperature decrease in the recent decade. Fig. 9Spatial distribution of SCD anomalies (deviation from the 11-year mean) of each hydrologic year from 2001 to 2011. Red colors are below the mean, and green colors are above the mean.  Figures 10 and 11 display the histogram of SCD and SCD anomalies in mountainous areas () and in plains (). In plains, the dominant SCD (total 37%) ranges from 100 to 130 days (), whereas in mountainous areas, the primary SCD (56%) is between 140 and 170 days (). The SCD in mountainous areas is less variable than those in plains. Fig. 10The histogram of annual SCDs on mountainous areas () and in plains () from 2000 to 2011. The two vertical dashed lines are the SCD median values of mountain and plain. 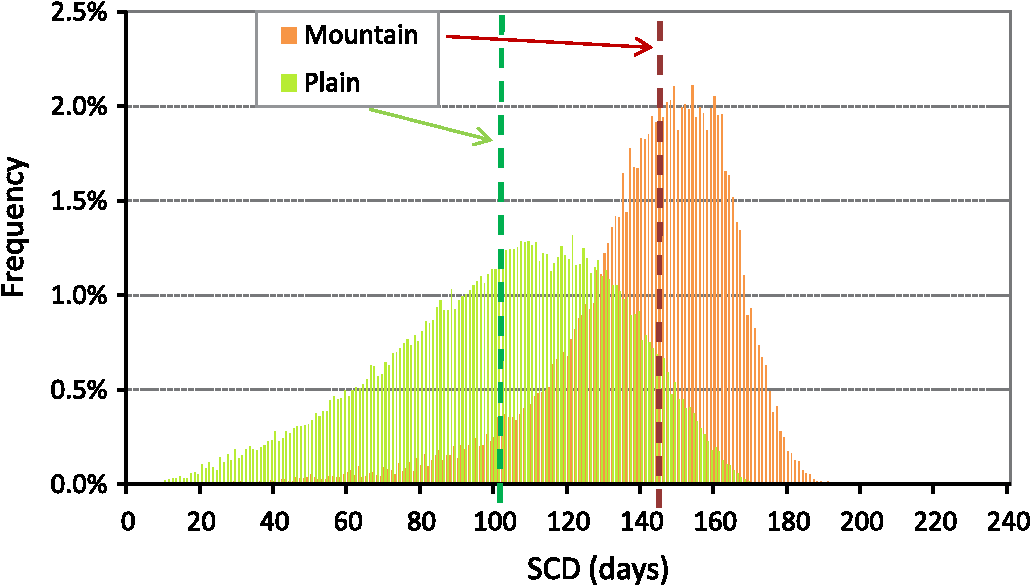 The mode values for SCD anomalies (Fig. 11) are 0 to 20 days (48%) in mountainous areas, while they are 5 to 25 days (34%) in plains. The frequencies of less than (23%) and more than 30 days (11%) in the plains are higher than those in mountainous areas with frequencies of 16% and 4%, respectively. This indicates that the SCD both in plains and mountainous areas shows an increasing trend, being consistent with the spatial distribution of SCD anomalies in Fig. 9, and the interannual variations of snow cover in plains are larger than those in mountainous areas. 5.2.Variations of Snow Cover IndexThis study applies a snow cover index (SCI) in Eq. (2) to integrate the spatiotemporal snow cover variations in a certain region.7 where represents the area of each pixel (), refers to the SCD in a hydrological year for pixel , and is the total pixels in the study area, i.e., the XiaoXing’AnLing watershed labeled by the white polygon in Fig. 8 in this study.SCI in Fig. 12 shows a similar pattern and an increasing trend with SCD anomalies in Fig. 9. SCI values in 2000 to 2001, 2001 to 2002, 2002 to 2003, and 2007 to 2008 were less than the mean SCI value of the 11 years, among which SCI values in 2001 to 2002 and 2007 to 2008 were much lower than the mean by and , respectively. The SCI in 2003 to 2004 was similar to the mean. For the rest of years, SCIs were greater than the mean, especially in 2009 to 2010, where it was 24% greater. 6.DiscussionOur improved cloud-removal approach generates a daily cloud-free MODIS snow cover product through a daily combination and multiday backward replacements. The daily combination of Terra and Aqua MODIS snow cover products is based on the snow priority algorithm developed by Xie et al.10 Other studies that applied this algorithm did not generate a completely cloud-free snow cover product although the cloud-blocked pixels were greatly reduced.15–17 The cloud threshold set by Xie et al.10 in their final cloud-less snow cover product was 10%. Thus, they generated a cloud-less snow cover image with cloud per 2.5 days on average, and with mean cloud of , which is similar to that of MODIS 8-day snow cover products. Hall et al.15 made the combination by replacing the cloud pixels with the cloud-free pixels on the previous 1 to 3 days’ images, but only the 0.05 deg (5 km) snow cover products (MOD10C1) were tested. Gao et al.17 further improved Hall et al.’s15 algorithm by extending the snow combination window to both the previous and succeeding 3 to 5 days to produce a cloud-less snow cover product, yet still not generating a daily completely cloud-free snow cover product. The total snow cover retrieved from Gao et al.’s approach17 and from ours is similar by a difference of 0.5% to the 2003 to 2004 hydrologic year. Our new cloud-removal approach, through multiday backward replacements, not only produces a daily cloud-free snow cover product, but is also a predictive estimate that can be made in near real time, while the forward combination is a retrospective estimate that requires data past the date and is only useful for monthly or seasonal reanalysis.18 The CPDs images are generated at the same time when the cloud-free snow cover images are produced. CPD acts as a quality flag to indicate the specific date when a cloud-free pixel is used to replace the cloud-blocked pixel on the current day. The longer the CPD, the larger uncertainty the replaced pixels have (Fig. 4). In the new cloud-free snow cover product, the cloud-free pixels are dominant (57%) on the current day image and on the previous 3-day images (31%). Therefore, compared with the former methods, the improved cloud-removal algorithm makes full use of those cloud-free pixels on both Terra and Aqua MODIS snow cover images and generates a daily completely cloud-free snow cover product. Although northeast China has the thickest snow depth accumulation among the three snow distribution regions in China, few studies investigate the detailed snow variation using the updated remote sensing techniques. Lei et al.26 evaluated the snow classification accuracy of the MODIS 8-day snow cover products and AMSR-E SWE in the Heilongjiang Province during 2002 to 2007. Chen et al.22 examined the spatiotemporal variations of snow cover in northeast China by using the multiday combinations of MODIS snow cover products, which have a mean cloud cover of 4% and mean combination period of 7 days. Lei et al.26 directly applied the daily MODIS Terra snow cover product to compute the SCDs in northeast China by only counting the snow-covered pixels under a clear sky and omitted those blocked by cloud but which were covered with snow. Cloud is the major factor influencing the MODIS snow cover classification, leading to an underestimation of the snow-covered areas. In contrast, SCD computed from the daily cloud-free snow cover product in this study can better represent the real snow-covered duration (Table 1). This study illustrates the XiaoXing’AnLing watershed as an example to analyze the detailed snow cover variations using our daily cloud-free snow cover product. The algorithm developed in this study can also be applied to other areas in China and elsewhere in the world. The daily cloud-free snow cover product and other derived maps provide basic information for snow disaster prevention and mitigation, agriculture, and water resources management and are accurate inputs for hydrologic and climatic models as well.22 The snow cover shows an overall upward trend in the XiaoXing’AnLing watershed. The increase trend of snow cover in northeast China negatively correlated with the air temperature decrease in the recent decade.22 Mountainous areas with higher elevation had longer SCD, but shorter SCD anomalies than in plains. These demonstrate the possible applications of the daily cloud-free snow cover product. In addition, it can also be combined with other microwave snow products to downscale their spatial resolution.3–5 Logically, a next step is to apply this cloud-free snow cover product to investigate the detailed variations of snow cover in the entire northeast China and in the Amur River Basin, which is beneficial to the local hydrology, water resources, climate, agriculture, and other fields. 7.SummaryThis study develops a cloud-removal approach via multiday backward replacements based on Terra and Aqua MODIS daily snow cover products (MOD10A1 and MYD10A1), to generate a daily cloud-free snow cover product (MODMYD_MC). MODIS tile h26v04 was used to test the proposed algorithm, and the four snow cover products were evaluated with in situ snow depth measured from 2000 to 2010 at 53 meteorological stations in the Heilongjiang Province in northeast China. The annual mean cloud covers of MOD10A1, MYD10A1, MODMYD_DC, and MODMYD_MC are 50%, 54%, 35%, and 0%, the mean snow covers are 6%, 6%, 10%, and 19%, and their mean agreements of snow cover mapping are 42%, 40%, 51%, and 91%, respectively. The SCDs derived from MODMYD_MC are in agreement (91%) with and slightly shorter than those obtained from in situ observations. This study also illustrates the detailed variations of snow cover in the XiaoXing’AnLing watershed using SCD and SCI derived from MODMYD_MC and finds that the snow cover in this area had an increasing trend since 2000, with a minimum in the 2002 hydrologic year and a maximum in 2010. The results from this study demonstrate that the MODMYD_MC can be applied to monitor the spatiotemporal variations of snow cover in northeast China and elsewhere in the world. Moreover, the improved cloud-removal algorithm makes full use of cloud-free pixels on both Terra and Aqua MODIS snow cover images and can be applied to assimilate the latest MODIS daily snow cover images to realize the near real-time snow cover monitoring operationally. AcknowledgmentsThis study is funded by the Natural Science Foundation of China (#41371404), the Startup Foundation for Oversea Returnees from the Department of Education of China (#2013693), the National Basic Research Program of China (#2012CB955903), and the Open Foundation of the State Key Laboratory of Desert and Oasis Ecology (#Y371163), Xinjiang Institute of Ecology and Geography, Chinese Academy of Sciences. We thank the US NASA and NSIDC for providing the MODIS daily snow cover products and the Heilongjiang Climate Data Center for the in situ snow depth data. The comments and suggestions from reviewers and editors greatly improve this manuscript and are highly appreciated. ReferencesH. Zhang,
“Study on spatio-temporal variations of snow from 2000 to 2009 in Northeast China,”
Jilin University,
(2010). Google Scholar
X. WangH. XieT. Liang,
“Evaluation of MODIS snow cover and cloud mask and its application in Northern Xinjiang, China,”
Remote Sens. Environ., 112 1497
–1513
(2008). http://dx.doi.org/10.1016/j.rse.2007.05.016 RSEEA7 0034-4257 Google Scholar
T. Lianget al.,
“Toward improved daily snow cover mapping with advanced combination of MODIS and AMSR-E measurements,”
Remote Sens. Environ., 112 3750
–3761
(2008). http://dx.doi.org/10.1016/j.rse.2008.05.010 RSEEA7 0034-4257 Google Scholar
H. Yuet al.,
“A new approach of dynamic monitoring of 5-day snow cover extent and snow depth based on MODIS and AMSR-E data from Northern Xinjiang region,”
Hydrol. Processes, 26 3052
–3061
(2012). http://dx.doi.org/10.1002/hyp.v26.20 HYPRE3 1099-1085 Google Scholar
Y. Gaoet al.,
“Toward advanced daily cloud-free snow cover and snow water equivalent products from Terra-Aqua MODIS and Aqua AMSR-E measurements,”
J. Hydrol., 385 23
–35
(2010). http://dx.doi.org/10.1016/j.jhydrol.2010.01.022 JHYDA7 0022-1694 Google Scholar
X. Wanget al.,
“Comparison and validation of MODIS standard and new combination of Terra and Aqua snow cover products in northern Xinjiang, China,”
Hydrol. Processes, 23 419
–429
(2009). http://dx.doi.org/10.1002/hyp.v23:3 HYPRE3 1099-1085 Google Scholar
X. WangH. Xie,
“New methods for studying the spatiotemporal variation of snow cover based on combination products of MODIS Terra and Aqua,”
J. Hydrol., 371 192
–200
(2009). http://dx.doi.org/10.1016/j.jhydrol.2009.03.028 JHYDA7 0022-1694 Google Scholar
T. Lianget al.,
“An application of MODIS data to snow cover monitoring in a pastoral area: a case study in Northern Xinjiang, China,”
Remote Sens. Environ., 112 1514
–1526
(2008). http://dx.doi.org/10.1016/j.rse.2007.06.001 RSEEA7 0034-4257 Google Scholar
H. Yuet al.,
“Research progress on snow monitoring based on optical and microwave remote sensing in pastoral area,”
Pratacultural Sci., 27 59
–68
(2010). Google Scholar
H. XieX. WangT. Liang,
“Development and assessment of combined Terra and Aqua snow cover products in Colorado Plateau, USA and northern Xinjiang, China,”
J. Appl. Remote Sens., 3 033559
(2009). http://dx.doi.org/10.1117/1.3265996 1931-3195 Google Scholar
J. ParajkaG. Bloschl,
“Spatio-temporal combination of MODIS images–potential for snow cover mapping,”
Water Resour. Res., 44 W3406
(2008). http://dx.doi.org/10.1029/2007WR006204 WRERAQ 0043-1397 Google Scholar
A. GafurovA. Bárdossy,
“Cloud removal methodology from MODIS snow cover product,”
Hydrol. Earth Syst. Sci., 13
(7), 1361
–1373
(2009). http://dx.doi.org/10.5194/hess-13-1361-2009 HESSCF 1027-5606 Google Scholar
J. Parajkaet al.,
“A regional snow-line method for estimating snow cover from MODIS during cloud cover,”
J. Hydrol., 381 203
–212
(2010). http://dx.doi.org/10.1016/j.jhydrol.2009.11.042 JHYDA7 0022-1694 Google Scholar
K. P. PaudelP. Andersen,
“Monitoring snow cover variability in an agropastoral area in the Trans Himalayan region of Nepal using MODIS data with improved cloud removal methodology,”
Remote Sens. Environ., 115 1234
–1246
(2011). http://dx.doi.org/10.1016/j.rse.2011.01.006 RSEEA7 0034-4257 Google Scholar
D. K. Hallet al.,
“Development and evaluation of a cloud-gap-filled MODIS daily snow-cover product,”
Remote Sens. Environ., 114 496
–503
(2010). http://dx.doi.org/10.1016/j.rse.2009.10.007 RSEEA7 0034-4257 Google Scholar
Y. Gaoet al.,
“Integrated assessment on multi-temporal and multi-sensor combinations for reducing cloud obscuration of MODIS snow cover products of the Pacific Northwest USA,”
Remote Sens. Environ., 114 1662
–1675
(2010). http://dx.doi.org/10.1016/j.rse.2010.02.017 RSEEA7 0034-4257 Google Scholar
Y. GaoN. LuT. Yaoet al.,
“Evaluation of a cloud-gap-filled MODIS daily snow cover product over the Pacific Northwest USA,”
J. Hydrol., 404 157
–165
(2011). http://dx.doi.org/10.1016/j.jhydrol.2011.04.026 JHYDA7 0022-1694 Google Scholar
J. Dozieret al.,
“Time-space continuity of daily maps of fractional snow cover and albedo from MODIS,”
Adv. Water Resour., 31 1515
–1526
(2008). http://dx.doi.org/10.1016/j.advwatres.2008.08.011 AWREDI 0309-1708 Google Scholar
G. A. RiggsD. K. HallV. V. Salomonson,
“MODIS snow products user guide for collection 4 data products,”
(2014) http://modis-snow-ice.gsfc.nasa.gov/sug_main.html August ). 2014). Google Scholar
D. K. Hallet al.,
“MODIS snow-cover products,”
Remote Sens. Environ., 83 181
–194
(2002). http://dx.doi.org/10.1016/S0034-4257(02)00095-0 RSEEA7 0034-4257 Google Scholar
E. P. Maureret al.,
“Evaluation of the snow covered area data product from MODIS,”
Hydrol. Processes, 17 59
–71
(2003). http://dx.doi.org/10.1002/(ISSN)1099-1085 HYPRE3 1099-1085 Google Scholar
S. Chenet al.,
“Spatiotemporal variations of snow cover in northeast China based on flexible multiday combinations of moderate resolution imaging spectroradiometer snow cover products,”
J. Appl. Remote Sens., 8 084685
(2014). http://dx.doi.org/10.1117/1.JRS.8.084685 1931-3195 Google Scholar
A. Simicet al.,
“Validation of VEGETATION, MODIS and GOES+SSM/I snow-cover products over Canada based on surface snow depth observations,”
Hydrol. Processes, 18 1089
–1104
(2004). http://dx.doi.org/10.1002/(ISSN)1099-1085 HYPRE3 1099-1085 Google Scholar
A. E. Tekeliet al.,
“Using MODIS snow cover maps in modeling snowmelt runoff process in the eastern part of Turkey,”
Remote Sens. Environ., 97 216
–230
(2005). http://dx.doi.org/10.1016/j.rse.2005.03.013 RSEEA7 0034-4257 Google Scholar
M. A. Friedlet al.,
“MODIS Collection 5 global land cover: algorithm refinements and haracterization of new datasets,”
Remote Sens. Environ., 114 168
–182
(2010). http://dx.doi.org/10.1016/j.rse.2009.08.016 RSEEA7 0034-4257 Google Scholar
X. Leiet al.,
“Accuracy evaluation of MODIS and AMSR-E snow cover products in the Heilongjiang drainage basin,”
J. Grad. Sch. Chin. Acad. Sci., 28 43
–50
(2011). Google Scholar
BiographyXianwei Wang is an associate professor in the School of Geography and Planning at Sun Yat-sen University (SYSU). He received his PhD degree from the University of Texas at San Antonio in 2008 and then worked as a postdoc at the University of California, Irvine, before he joined SYSU in Feb 2011. His research interests are on cryosphere and surface hydrology by using remote sensing, GIS, and hydrologic models. Hailing Zheng is an assistant engineer at the Surveying and Mapping Institute of Urban and Rural Planning of Zengcheng. She was a master’s student in the School of Geography and Planning at Sun Yat-sen University and received her master’s degree in 2014. Her research interests are on snow remote sensing and cartography. Yaning Chen is a research professor in the Xinjiang Institute of Ecology and Geography, Chinese Academy of Sciences (CAS), the director of State Key Laboratory of Desert and Oasis Ecology, and a chief scientist of the national basic research program of China (973 program). He received his PhD degree from Northwest University in 2000 and then worked in CAS. He is an active leading scholar in hydrological processes and environmental remediation in arid regions. Henan Liu is a senior engineer in the Heilongjiang Climate Center. She received her master’s degree from Nanjing University of Information Science and Technology in 2009. Her research interests are in climate change and climate hazards risk assessment. Lin Liu is a professor and the dean of the School of Geography and Planning, Sun Yat-Sen University. He is also a professor of geography at University of Cincinnati. He received his PhD degree from the Ohio State University and earned his BS and MS degrees from Peking University, China. His research interest includes spatial interaction modeling, crime analysis and simulation modeling, location analysis, spatial data mining, geographic visualization, and environmental modeling. Huabing Huang is an assistant professor in the School of Geography and Planning at Sun Yat-sen University. He received his PhD degree from Wuhan University in 2012, and then joined SYSU. His research interests are on urban hydrology and risk analysis of natural hazards. Kai Liu is an associate professor in the School of Geography and Planning at Sun Yat-sen University. He received his PhD degree from the Guangzhou Institute of Geochemistry, Chinese Academy of Sciences in 2007. His current research focuses on wetlands, especially on mangroves and dyke pond systems, with remote sensing and GIS techniques. |
|||||||||||||||||||||||||||||||||||||||||||||||||||||||||||||||||||||||||||||||||||||||||||||||||||||||||||||||||||||||||||||