|
|
1.IntroductionSynthetic aperture radar (SAR) has demonstrated its advantages in oceanic applications since it is independent of weather condition and capable of monitoring natural surface in full day and night. With the wide availability of polarimetric SAR (PolSAR) data which is configured to receive both magnitude and phase of backscattered signal, the polarimetric response of targets can be simultaneously obtained by measuring backscattered signal for all four linear polarization configurations (),1 represented by scattering matrix , where the subscript denotes the horizontal transmit and vertical receive. It is the nature of complex signal that enables us to estimate polarized phase difference (PPD) between two different polarization channels. Statistics of co-polarized PPD calculated from and channels have been thoroughly studied in the literature.1–4 In Ref. 1, the behavior of co-polarized PPD over forests is related to the properties of test sites, as experimental results confirmed that the mean PPD is contributed by a combination of propagation delay, forward scatter by soil surface, and specular bistatic reflection by stalks. Then the relationship between the probability distribution function (PDF) of PPD and sensor, speckle, and terrain properties is examined by considering speckle noise as a multiplicative independent random process.2 Closed solutions of co-polarized PPD are presented in the form of Legendre function3 and in Ref. 4 by relating its mean and variance to elements of the Mueller matrix. A detailed derivation of statistics of PPD for multi-look data is given in Ref. 5 based on the complex Wishart distribution. The PDF of co-polarized PPD in Ref. 5 is dependent on a complex correlation coefficient with the magnitude determining the PDF height and the phase controlling the position of the central axis. The statistics of PPD require much deeper investigation due to its wide oceanic applicability.6,7Speckle noise is of great importance as it has a significant effect on the quality of SAR imageries.8 When radar illuminates a rough facet on the scale of the radar wavelength, the total received signal consists of contributions from many elementary scatterers within a resolution cell. The random distances between these scatterers and the sensor determine that the reflected waves from these scatterers are not coherent in phase.9 In order to achieve high spatial resolution, SAR coherently processes the returned signal from successive pulses; as a result, speckle noise is produced. A complete speckle noise model for single-look PolSAR data has been presented, which is focused on the noise characteristics of all covariance matrix elements,10 hereinafter referred to the LM noise model. This model proposes that the noise can be divided into two types: multiplicative noise which only introduces noise in amplitude and additive noise which introduces noise both in amplitude and phase. The contributions of these two noise types to the total speckle noise depend on the complex correlation coefficient,10 which determines the characteristics of PPD PDF as introduced in Ref. 5. In the case of spaceborne SAR, it is widely accepted that the reciprocity theorem holds, which means . This is expected to be reasonable for most natural distributed targets so the PDF of cross-polarized PPD can be predicted to be symmetrical and has a major single lobe centered at 0 for most natural targets. But real data might not always conform exactly to this theorem due to various factors such as measurement errors, noise effect, and so on. In this paper, we are devoted to examining reasons for various behaviors of PDF under different conditions. The case of low noise level is found to meet this prediction, while the existence of strong noise may make the real PDF deviate from this expectation. In the case of strong noise, the relationship between statistics of cross-polarized PPD and dominant noise type is examined based on the Radarsat-2 fully polarimetric data and LM noise model. The distribution over areas where the dominant noise is multiplicative noise is found to be in good agreement with the theoretical expectation, while that of the areas where additive noise dominates deviates from the prediction. Further experiment with Radarsat-2 polarimetric imagery qualitatively aims at validating this relationship. This paper will help to classify the areas where the reciprocity theorem does not hold so that further research using cross-polarized channels requires taking the effect of speckle noise into account. The present paper is divided as follows. Section 2 contains a brief introduction to the LM noise model. The experimental results are treated in Sec. 3 and concluding remarks are given in Sec. 4. 2.LM Noise ModelThe LM noise model is focused on identifying the speckle noise for all covariance matrices, defined by target vector , where the subscript denotes transpose. Every element of can be written as the complex Hermitian product , where belong to a pair of orthogonal polarization states, represented by10 where the symbol · represents the ensemble average and the subscripts and * denote the conjugate transpose and complex conjugate, respectively. Specifically, for the product of cross-polarized channels expressed as where is the amplitude and is the measured phase difference. The statistical property of is mainly determined by the complex correlation coefficient5 where denotes the coherence, is called the effective phase difference, and represents the ensemble average. The average power of the two channels is denoted asThe speckle noise is divided into two types: multiplicative noise and additive noise . Hereinafter, the term noise refers to total speckle noise without any specifics. The exhaustive derivation of the noise model has been presented in Ref. 10 and the reader is urged to refer to it for the detailed deduction process. The simplified form of speckle noise model for is defined as10 where the parameter is the normalized mean amplitude by with denoting the mean amplitude of this averaging window and for one-look imagery is given by where is a Gauss hypergeometric function.The first term in Eq. (6) introduces multiplicative noise, given by ;, which has an equal effect on the real and imaginary parts of . By this, it means that this term only induces noise in the amplitude since the phase is not affected. The mean and standard deviation for the real part of this term is expressed as10 The second term in Eq. (6) is a mean value without noise. The third term,, introduces an additive noise, affecting both amplitude and phase as the ;and are not equal. It should be pointed that in the process of separating two types of noise, the first term in Eq. (6) is referred to as the multiplicative noise term while the combination of the rest of the two terms is taken as the additive speckle noise term. The mean and variance for the real part are given by10 Figure 1 depicts the mean value versus standard deviation of multiplicative noise and additive noise, respectively, assuming and . A linear relation between the mean and standard deviation can be clearly observed as it is very close to an equality relation in Fig. 1(a). This conclusion is consistent with the results given in Ref. 9, which points out that the standard deviation is approximately equal to the mean value for one-look SAR imagery with multiplicative noise. However, for the additive noise term, there is not a clear relation between the mean value and standard deviation in Fig. 1(b). This difference will later be used as the key feature to classify the dominant noise type of experimental data. 3.Experimental ResultsIn order to examine the relationship between the dominant noise type and the statistical behavior of , we have tested a series of Radarsat-2 quad-pol datasets among which three typical imageries are included in this experiment. Then, we select five homogeneous areas to analyze the speckle noise type and statistics. The detailed information about these areas is given in Table 1. Further, the parameter noise equivalent sigma-zero (NESZ) in Table 1 is defined as the scattering cross-section coefficient () of an area which represents a mean level equal to the thermal noise.11 The nominal NESZ in Table 1 for each beam mode is an approximate value estimated from Ref. 11. These three scenes are given in Fig. 2 as well as the five selected subareas. The five subareas are chosen with the rule that strong and low noise levels should both be taken into account. The subareas marked by SA1, SA2, and SA4 are selected because they are displayed as dark patches in intensity images and they might be of the same order as thermal noise. The two other areas are in gray color, which means their values are much higher than NESZ. Table 1Experimental datasets.
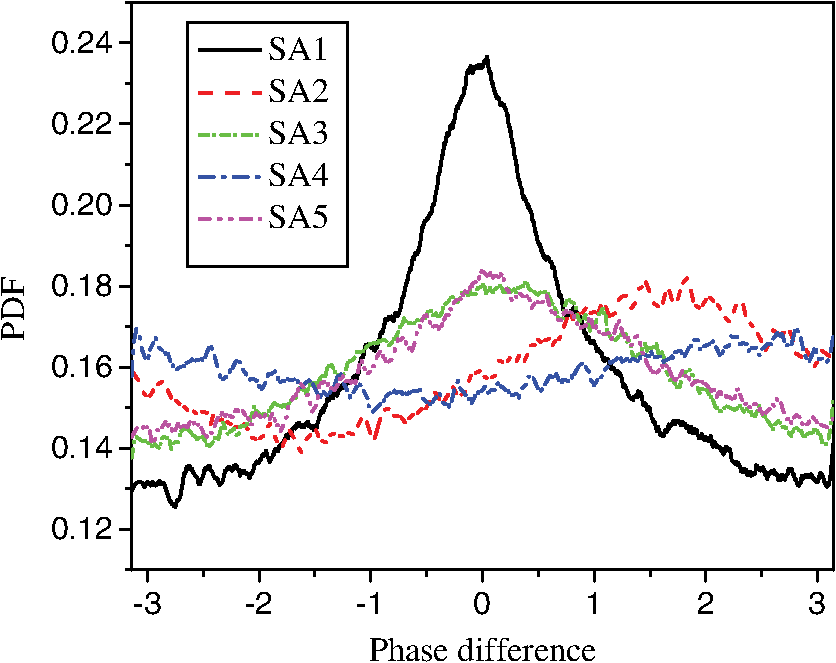
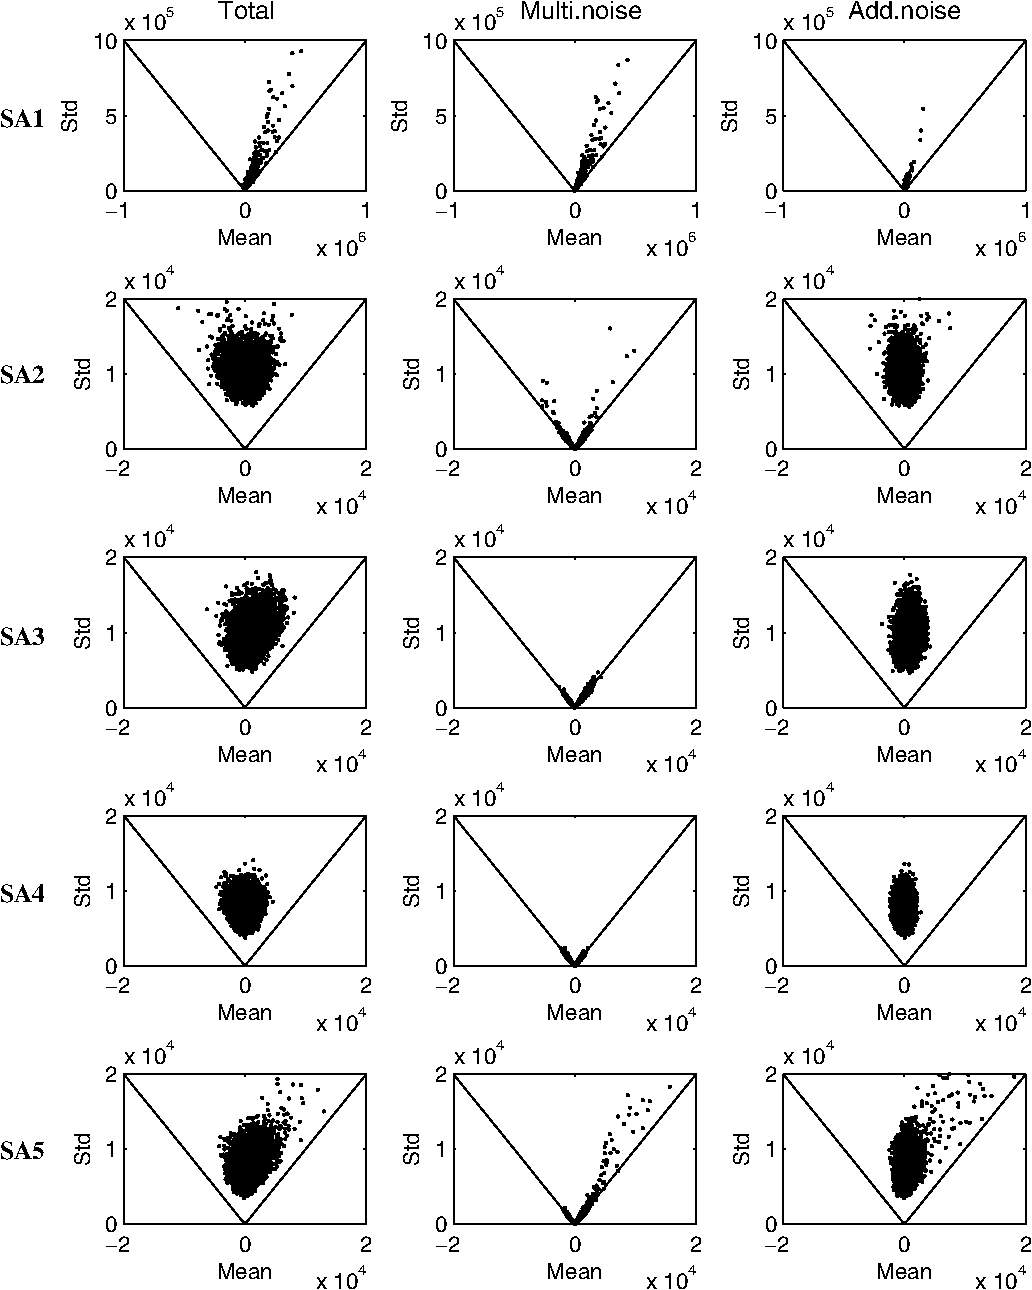
The distribution of is shown in Fig. 3 and the corresponding is presented in Fig. 4. To relate the phase difference to the dominant type of speckle noise, the first step is to determine the relative noise level with respect to the NESZ. Note that the radar cross section of SA3 and SA5 is much higher than the nominal NESZ in Fig. 3; as a result, the genuine signal is not primarily affected by the total speckle noise. Therefore, it is predicted that the of SA3 and SA5 should be centered at 0 deg and have a single major lobe, which is consistent with the experimental lines in Fig. 4. Further, we find that the mean values of over SA1, SA2, and SA4 are of the same order as the corresponding NESZ. Therefore, it is reasonable to assume that measurement error induces an equivalent effect on SA1 and SA2, so if the observed phase difference is caused by the measurement error, PDFs over SA1 and SA2 in Fig. 4 are expected to have a similar shape. However, the experimental results demonstrate that the various phase differences cannot be attributed to measurement errors. In addition, the PDFs are estimated within an area of , which is large enough to neglect the effect of statistical fluctuations. Thus, the effects of speckle noise need to be taken into consideration. The real part of is shown in Fig. 5 and for every case, the scatter diagrams illustrate the behavior of , the multiplicative term and the additive term, respectively. The scatter diagrams are plotted by employing pixel nonoverlapping windows. It should be noted that the imaginary part is not displayed here because this term presents a similar behavior as . In combination with the conclusions reached in Sec. 2 (Fig. 2), the mean value versus standard deviation for multiplicative noise is approximately an equality relation. From Fig. 5, we can see that the dominant noise over SA1 is multiplicative noise, which only introduces noise in the amplitude. In this case, the speckle noise has no effect on the individual phases of HV and VH channels; therefore, the distributions remain centered at 0 deg, which is in agreement with the theoretical expectation as shown in Fig. 4. There is no clear relation between mean value of additive noise and its standard deviation as in Fig. 2, where the only feature is that the mean value is about 0 deg. According to this pattern, it is clear in Fig. 5 that the dominant noise type over areas SA2 and SA4 is additive noise which induces noise both in amplitude and phase. This introduced additive noise results in the distribution for SA2 and SA4 being significantly deviating from the 0 degree as shown in Fig. 4. From this experiment, we could conclude that the reciprocity theorem does not hold in the case of strong additive noise. 4.ConclusionsA qualitative relationship between statistics of and dominant noise type is treated based on Radarsat-2 fully polarimetric data. In the case of low noise level, the mean is much higher than the NESZ and the genuine signal is not significantly corrupted by speckle noise, therefore, the cross-polarized PPD distribution is centered at 0 deg as expected in terms of the reciprocity theorem. However, in the case of high noise level, the correlation between distribution and dominant noise type is evident. As the experiments demonstrate, distribution over the areas where the multiplicative noise is dominant centers at 0 deg, while that over the area of additive noise is observed to have an obvious deviation from 0 deg. This behavior is due to the fact that the multiplicative noise only affects the amplitude while the additive noise introduces noise both in amplitude and phase. However, we realize that more effort is required to figure out a quantitative relationship between the noise type and degree of deviation for further oceanic applications. AcknowledgmentsThe paper is supported by the National Natural Science Foundation of China (Grant No. 41376179). We would like to thank the anonymous reviewers for their constructive comments. ReferencesF. T. Ulabyet al.,
“Relating polaization phase difference of SAR signals to scene properties,”
IEEE Trans. Geosci. Remote Sens.,
(1), 83
–92
(1987). http://dx.doi.org/10.1109/TGRS.1987.289784 IGRSD2 0196-2892 Google Scholar
A. Lopeset al.,
“Phase difference statistics related to sensor and forest parameters,”
in IGARSS '92,
779
–781
(1992). Google Scholar
I. R. JoughinD. P. WinebrennerD. B. Percival,
“Probability density functions for multilook polarimetric signatures,”
IEEE. Trans. Geosci. Remote Sens., 32
(3), 562
–574
(1994). http://dx.doi.org/10.1109/36.297975 IGRSD2 0196-2892 Google Scholar
F. UlabyK. SarabandiA. Nashashibi,
“Statistical properties off the Mueller matrix off distributed targets,”
IEE Proc. F Radar and Signal Processing, 139
(2), 136
–146
(1992). Google Scholar
J. S. LeeA. R. MillerK. W. Hoppel,
“Statistics of phase difference and product magnitude of multi-look processed Gaussian signals,”
Waves Random Media, 4
(3), 307
–319
(1994). http://dx.doi.org/10.1088/0959-7174/4/3/006 WRMEEV 0959-7174 Google Scholar
D. Haldaret al.,
“Analysis of temporal polarization phase difference for major crops in India,”
Prog. Electromagnet. Res. B, 57 299
–309
(2014). http://dx.doi.org/10.2528/PIERB13111901 1937-6472 Google Scholar
M. MigliaccioF. NunziataA. Gambardella,
“On the co–polarized phase difference for oil spill observation,”
Int. J. Remote Sens., 30
(6), 1587
–1602
(2009). http://dx.doi.org/10.1080/01431160802520741 IJSEDK 0143-1161 Google Scholar
J.-S. Lee,
“Speckle analysis and smoothing of synthetic aperture radar images,”
Comput. Graph. Image Process., 17
(1), 24
–32
(1981). http://dx.doi.org/10.1016/S0146-664X(81)80005-6 CGIPBG 0146-664X Google Scholar
J.-S. LeeE. Pottier, Polarimetric Radar Imaging: From Basics to Applications,, CRC Press, New York
(2009). Google Scholar
C. Lopez-MartinezX. Fabregas,
“Polarimetric SAR speckle noise model,”
IEEE Trans. Geosci. Remote Sens, 41
(10), 2232
–2242
(2003). http://dx.doi.org/10.1109/TGRS.2003.815240 IGRSD2 0196-2892 Google Scholar
B. Slade, RADARSAT-2 Product Description, MacDonald, Dettwiler and Associates (MDA) Ltd., Richmond, B.C., Canada
(2009). Google Scholar
BiographyHuimin Li is currently studying for an MS degree in ocean information sensing and processing from the Ocean University of China. She received her BS degree in marine technology from the Ocean University of China, Qingdao, China, in 2013. Her main research of interest focuses on the utilization of polarimetric SAR data for target detection and dynamic elements retrieval. Yunhua Wang received his MS and PhD degrees in radio science from Xidian University, Xi’an, China, in 2005 and 2006, respectively. He is currently with the Ocean Remote Sensing Institute, Ocean University of China, Qingdao, China. His research interests include asymptotic and numerical simulations of electromagnetic wave scattering from random sea surfaces and SAR remote sensing of the ocean. |