|
|
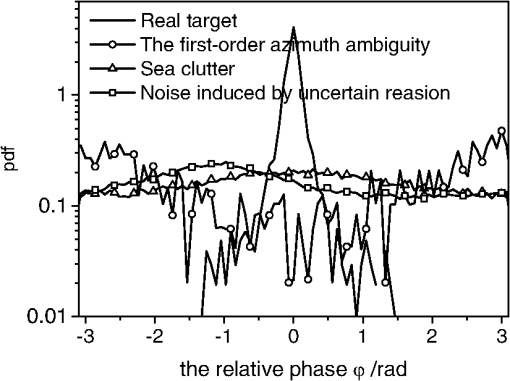
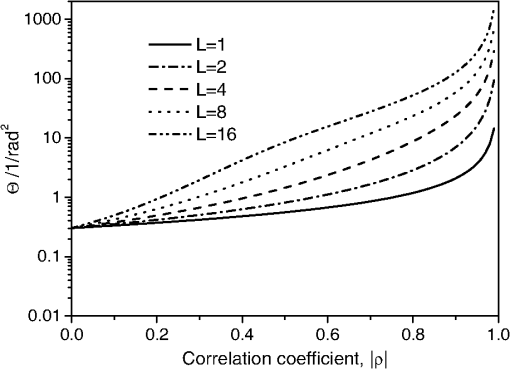
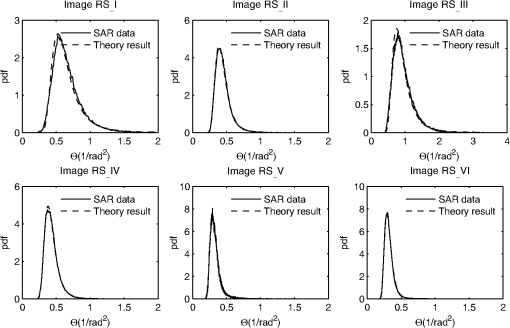
1.IntroductionTarget detection based on synthetic aperture radar (SAR) images has been a hot topic because of its important application in maritime environment monitoring. Since the scattering fields from man-made targets, such as ships and oil platforms, are generally stronger than those from surrounding sea surface, the intensity-based constant false alarm rate (CFAR) algorithms have been widely established to distinguish targets from sea surface.1–12 However, the detection algorithms based on single-channel SAR data are sometimes ineffective due to various factors, such as speckle noise, the ambiguities of targets, and other strong noise induced by some uncertain reasons. Recently, with the availability of polarimetric SAR sensors, the polarimetric scattering behavior of targets can be described by the scattering matrix, through which features relating to both the intensity and the relative phase can be extracted. Recently, many polarimetric detection algorithms using polarimetric information provided by fully polarimetric SAR are successfully exploited for detecting targets, especially marine targets.7–12 In Ref. 12, Novak proposed the polarimetric whitening filter method for target detection. On the other hand, the coherent target decomposition (CTD) theory can also be used to observe ships because the scattering mechanisms of targets are generally different from that of surrounding sea surface. The results in Ref. 13 showed that even in low resolution, SAR imageries marine targets can also be distinguished from sea clutter by CTD theory. Generally, the backscattered field from sea surface is dominated by Bragg scattering with low entropy value. However, owing to the complex metallic structures of man-made targets, the scattering field from a man-made target always contains complex scattering mechanisms with higher entropy value. In Refs. 14 and 15, based on CTD theory, polarimetric SAR images were used to detect ships exploring entropy values. Note that the effectiveness of the entropy-based detector decreases with increasing wind speed because the scattering field from breaking waves also contains complex scattering mechanisms with higher entropy value. Although the methods mentioned above have been widely used to detect targets in SAR images, the strong noises induced by ambiguities and so on, which are often mistaken as real targets and cause false alarms, cannot be effectively removed. In Ref. 16, the eigenvalues of the coherency scattering matrix are used to distinguish ambiguities from real targets. However, the method in Ref. 16 will no longer perform well in the case of strong depolarized scattering. In Ref. 17, Liu and Gierull found that in image, the scattering fields of azimuth ambiguities can be suppressed effectively because the HV channel data of the first-order azimuth ambiguities (FOAAs) are approximately equal to VH channel in magnitude but shifted about in phase. In Ref. 18, based on the intensity of image (it is called as ambiguity free image by Velotto), a new parameter , which is a simple combination of slope and departure from the uniform distribution of the phase parameters in GK distribution, is proposed for target detection (refer to Ref. 18 for detail). Velotto et al. pointed out that is always smaller than 10 for real targets but larger than 10 for sea surface and ambiguities. The methods proposed in Refs. 17 and 18 are applicable to detect targets effectively in high-quality SAR images, by this I mean the SAR imageries without exotic noises. Nevertheless, besides ambiguities, many SAR images have also been corrupted by other strong noise induced by uncertain reasons. For the case of the poor-quality SAR images, methods of Liu and Velotto will be no longer in validity. This paper mainly focuses on detection of azimuth ambiguities in noise severely corrupted fully polarimetric SAR images. We define reciprocal of the mean square value of the relative phase (RMSRP) as a new indicator of marine targets considering the different behaviors of phase difference over real targets and FOAAs. Based on the central limit theorem, we find that the mean value of RMSRP estimated through a spatially moving window satisfies the Gaussian distribution well. The theoretical distribution of RMSRP is derived and in terms of this, a RMSRP-based CFAR algorithm is established for marine target detection. The experiment results using Radarsat-2 imageries acquired in fine quad-polarization mode are promising, demonstrating that our detection algorithm is not only robust for removal of azimuth ambiguities in SAR images but also is able to suppress noise induced by unknown reasons. This paper is organized as follows. In Sec. 2, the statistic properties of the relative phase and RMSRP are discussed, and the probability density function (PDF) of RMSRP for surrounding sea surface is derived. Section 3 addresses the RMSRP-based CFAR algorithm. Experimental results are presented in Sec. 4, whereas conclusions are given in Sec. 5. 2.Definition of the New Parameter RMSRPIn this work, the relative phase is estimated by where and denote the single-look complex (SLC), HV and VH scattering amplitudes, and represents the look-number.For convenience, the new parameter RMSRP is represented by symbol , and it is defined as where denotes the mean value of within a spatial window. From Eq. (2), one can easily conclude that (1) the narrower the PDF of , the higher the value of is, and vice versa, and (2) the closer is the mean value of the relative phase from zero, the higher is the value of , and vice versa.2.1.For Real Targets and Its FOAAsAzimuth ambiguities in SAR images are caused by the discrete sampling of the Doppler signal at finite intervals of the pulse repetition frequency (PRF). The Doppler frequencies higher than PRF would appear as aliased, folded into the azimuth spectrum. Azimuth ambiguities occur at fixed along-track repeat positions with respect to the position of the actual target, i.e., Ref. 19: where denotes the position of actual target, is the ambiguity index, and denote the radar wavelength and the slant range, respectively. is the relative speed between radar and target. For RS-2 data applied in this work, the theoretical distance between the FOAAs and the target is about 4.1 to depending on the range position.For fully polarimetric SAR systems, the horizontal (H) and vertical (V) pulses are transmitted alternately. Thus, the time interval between HV and VH signals is 1/2PRF. If the HV ambiguous response occurs at position , then the corresponding VH ambiguous would occur at The azimuth phase history for a target positioned at can be represented by Substituting Eqs. (3) and (4) into Eq. (5), the relative phase between the ambiguous HV and VH returns is obtained as For real targets, the reciprocity condition, i.e., , should be satisfied. However, there exists an additional phase shift in Eq. (6), which can be removed by multiplying a complex number during the resampling processes so that Eq. (6) is simplified to . Then the relative phase between two cross-polarized channels is 2.2.For Sea Surface and the Strong NoiseIn SAR images, for sea surface and the strong noise, the relative phase between two cross-polarized channels has been widely spread in angle region due to decorrelation effect. The histograms of evaluated by SLC quad-pol RS-2 SAR data are illustrated in Fig. 1. It is clearly shown that the relative phase is equal to 0 rad for real target, and the PDF is very narrow. Just as discussed in Sec. 2.1, the PDF for FOAAs is distributed around , but it has been spread because the field intensities of ambiguities are generally much lower than real target and can be easily affected by sea clutter. Figure 1 also shows that the relative phases for sea surface and strong noise are widely spread in angle region due to decorrelation effect. In order to detect target by RMSRP-based CFAR algorithm, the “prior probability” of should be obtained first. In Refs. 20 and 21, the PDF of the relative phase has been derived by Lee as where is a Gauss hypergeometric function, , the correlation coefficient and the mean phase are related to the measured data byUsing Eq. (8), the PDF of is derived as Based on the central limit theorem, if the dimension number of a moving window is large enough, the PDF of (i.e., the mean value of within the moving window) can be described approximately by a Gaussian distribution where and denote the mean value and the mean square deviation of , respectively. Then, using the identity equation , the PDF of is obtainedUsing Eqs. (10) and (12), the mean values of for different look numbers are evaluated, and the curves are plot in Fig. 2. Just as shown in this figure, the value of increases with the increase of look number and correlation coefficient. And the effect of look number is more remarkable when the correlation coefficient is larger. This property implies that multilook processing would improve the ability of for target detection because the correlation coefficients for real targets are always larger than those for surrounding sea surface. However, it should be pointed out that the multilook processing would reduce the spatial resolution. On the other hand, to ensure the applicability of the central limit theorem, the dimension of the moving window, in which the mean value of is evaluated, is set to be . In this work, a data set that contains six Radarsat-2 SAR images acquired in fine quad-polarization mode are processed to show the effectiveness of the theoretical PDF. The detailed descriptions of the images are given in Table 1. The comparisons in Fig. 3 illustrate that the theoretical PDFs match the histograms well. Table 1The data set used in this work.
3.-based CFAR Target DetectorHere, a -based CFAR algorithm is established for marine target detection. The detection threshold is determined by the following integration: where is the given false alarm. And denotes the error function. Using Eq. (13), the relation between the false alarm rate and the detection threshold is derived as where denotes the inverse error function.Based on the analysis above, the following rule is used to detect targets, i.e., 4.Experimental ResultsIn this section, three meaningful Radarsat-2 SAR imageries (namely Image RS_V, Image RS_VI and Image RS_VII in Table 1), in which targets, azimuth ambiguities, and strong noise are simultaneously present, have been selected to demonstrate the effectiveness of the -based target detector. In the following discussions, the false alarm rate is set to be . First, the -based target detector is tested to remove azimuth ambiguities. Figure 4 shows the SAR image of the Dongsha Island acquired at 10:12 (UTC) on August 8, 2012 (namley Image RS_VII in Table 1). From Fig. 4, we can find that the first-order azimuth ambiguity of the Dongsha Island can be seen in and images. In image (i.e., the so called image in Ref. 18), the intensity of the azimuth ambiguity has been suppressed due to its special phase difference. From Fig. 4(d), we can find that the value of (i.e., RMSRP) for target/azimuth ambiguity is higher/lower than the surrounding sea surface. Thus, the parameter can also be used to remove the azimuth ambiguities. Figure 4(e) shows the detection results by the -based target detector by using threshold 0.77, and it is obvious that this proposed algorithm is good to detect real targets. Fig. 4An example of SAR azimuth ambiguity removal using RMSRP. The bright target is Dongsha Island in East China Sea. (a) , (b) , (c) , (d) RMSRP, (e) Detection result. 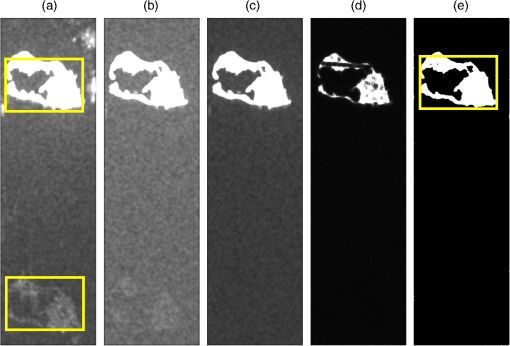 By comparison in Fig. 4, it is evident that the azimuth ambiguities can be suppressed effectively within or RMSRP image. However, in the case of strong noise corrupted SAR images, the -based algorithm will no longer perform well. This behavior is shown in Fig. 5(a), and the SAR image was acquired at 10:13 (UTC) on February 15, 2013 (named Image RS_ V in Table 1) in the Bohai sea. The center longitude and latitude coordinates are about 118°14′41′′E and 39°01′04′′N. The yellow rectangle in Fig. 5(a) indicates the blown-up area, as shown in Figs. 5(b)–5(f). The red circles in Fig. 5(c) highlight the areas with strong noise induced by unknown reasons. Unlike azimuth ambiguities, the strong noise cannot be suppressed effectively in image [see Fig. 5(d)], while reduced over RMSRP image as given in Fig. 5(e). The reason is attributed to the fact that PDF of the relative phase in the noise-polluted region is always broader than that for real targets, making RMSRP over noise-region much smaller than that of real targets. Figure 5(f) shows the detection results by -based target detector with threshold 1.49, as we expected that this algorithm is able to suppress both azimuth ambiguities and strong noise. To validate the detection results, the detailed information of targets achieved by Electronic Navigation Chart (ENC) and Automatic Identification System (AIS) are given in Table 2. This ground truth is consistent with the detection results, further supporting our proposed detector. The largest ship in Fig. 5 is T18, with 294 m in length and 32 m in width. There do exist two odd targets circled by red rectangle in Fig. 5(f), and no AIS information indicates these targets. Fig. 5An example of target detection in noise-corrupted SAR image (RS_ V in Table 1). (a) , (b) , (c) , (d) , (e) RMSRP, (f) Detection result. 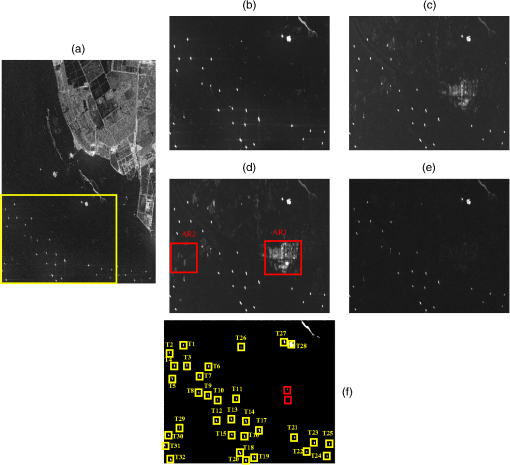 Table 2The information of the targets in Fig. 5.
Note: The information for T27 and T28 are achieved from ENC (electronic navigation chart) C1311700. No AIS information are available for T10 and T26. The information for the other targets is all obtained by AIS (automatic identification system). Another typical example of target detection in a noise-corrupted SAR imagery is presented in Fig. 6. The SAR image in Fig. 6 was acquired at 09:39 (UTC) on July 13, 2010, in the East China Sea. And the center longitude and latitude coordinates are 122°34′54′′E and 31°11′43′′N, respectively. Besides real targets, some filaments could be seen in Figs. 6(a)–6(c), and we have no idea about the origin of these odd noise. Figure 6(f) demonstrates promising detection result with threshold of 0.67. It is exciting to find that the strong noise has been suppressed in the RMSRP image, highlighting the visually inspected ships. This imagery provides further evidence to the applicability of our proposed algorithm. Fig. 6Another example of target detection in noise-corrupted SAR image (named RS_ VI in Table 1). (a) , (b) , (c) , (d) , (e) RMSRP, (f) Detection result. 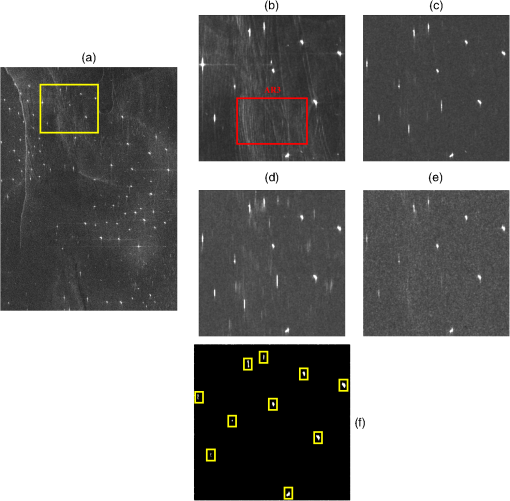 To present a quantitative description about the reduction degree of noise, we introduce the standard deviation of , , , and RMSRP over the noise-corrupted areas to indicate this improvement. We select two areas in Fig. 5(d) marked as AR1, AR2, and one area AR3 in Fig. 6(b) to demonstrate the improvement of RMSRP in suppressing noise. The detailed estimates for different parameters are given in Table 3, and it is evident that the noise is primarily reduced by RMSRP while others do not exhibit such capability. It also should be noted that the standard deviation of is always the largest value, by this I mean that noise presents the highest variability in images. Table 3Standard deviation over noise-corrupted areas.
5.ConclusionsIn this paper, the RMSRP between cross-polarized channels is proposed as a new promising indicator for SAR target detection at sea. Meanwhile, an analytical form of the PDF for RMSRP was derived, and the comparisons between the histograms of the sea clutter and theoretical PDF show the correctness of the statistic model. Based on the statistic model, a RMSRP-based CFAR algorithm is developed to detect targets in noise corrupted SAR images. From the tests over quad-pol RS-2 SAR images, we find that not only the azimuth ambiguities but also strong noise can be reduced successfully by the RMSRP-based algorithm. Standard deviation is introduced to indicate the quantitative improvement in suppressing noise. The experiment results certify that RMSRP is a promising indicator for Pol-SAR target detection purpose, particularly when pol-SAR images have been corrupted by strong noise and azimuth ambiguities. This proposed algorithm would be helpful in detecting targets in SAR imageries and further applying to coastal management. AcknowledgmentsThis research was supported by the National Natural Science Foundation of China (Grant Nos. 41376179, 41106153) and the National Science Foundation for Distinguished Young Scholars of China (Grant No. 61225002). ReferencesP. W. Vachonet al.,
“Ship detection by the Radarsat SAR: validation of detection model predictions,”
Can. J. Remote Sens., 23
(1), 48
–59
(2014). http://dx.doi.org/10.1080/07038992.1997.10874677 CJRSDP 0703-8992 Google Scholar
C. C. Wackermanet al.,
“Automatic detection of ships in RADARSAT-1 SAR imagery,”
Can. J. Remote Sens., 27
(4), 371
–378
(2014). http://dx.doi.org/10.1080/07038992.2001.10854879 CJRSDP 0703-8992 Google Scholar
P. W. Vachonet al,
“Validation of ship detection by the RADARSAT synthetic aperture radar and the ocean monitoring workstation,”
Can. J. Remote Sens., 26
(3), 200
–212
(2000). http://dx.doi.org/10.1080/07038992.2000.10874770 CJRSDP 0703-8992 Google Scholar
S. KuttikkadR. Chellappa,
“Non-Gaussian CFAR techniques for target detection in high resolution SAR images,”
in IEEE Int. Conf. on Image Processing,
910
–914
(1995). Google Scholar
Q. Jianget al.,
“Automatic detection for ship target in SAR imagery using PNN model,”
Can. J. Remote Sens., 26
(4), 297
–305
(2000). http://dx.doi.org/10.1080/07038992.2000.10874780 CJRSDP 0703-8992 Google Scholar
S. Bruschet al.,
“Ship surveillance with Terra SAR-X,”
IEEE Trans. Geosci. Remote Sens., 49
(3), 1092
–1103
(2011). http://dx.doi.org/10.1109/TGRS.2010.2071879 IGRSD2 0196-2892 Google Scholar
M. Yeremyet al.,
“Ocean surveillance with polarimetric SAR,”
Can. J. Remote Sens., 27
(4), 328
–344
(2014). http://dx.doi.org/10.1080/07038992.2001.10854875 CJRSDP 0703-8992 Google Scholar
H. L. LiY. J. HeW. G. Wang,
“Improving ship detection with polarimetric SAR based on convolution between co-polarization channels,”
Sensors, 9
(2), 1221
–1236
(2014). http://dx.doi.org/10.3390/s90201221 SNSRES 0746-9462 Google Scholar
L. M. ZhangB. ZouW. Y. Tang,
“Stokes matrix polarimetric similarity parameters and its application in target detection,”
Remote Sens. Lett., 3
(2), 93
–100
(2012). http://dx.doi.org/10.1080/01431161.2010.537391 IGRSBY 1545-598X Google Scholar
L. M. ZhangB. ZouW. Y. Tang,
“Similarity-enhanced target detection algorithm using polarimetric SAR images,”
Int. J. Remote Sens., 33
(19), 6149
–6162
(2012). http://dx.doi.org/10.1080/01431161.2012.680614 IJSEDK 0143-1161 Google Scholar
L. M. NovakS. D. Halversen,
“Effects of polarization and resolution on SAR ATR,”
IEEE Trans. Aerosp. Electron. Syst., 33
(1), 102
–115
(1997). http://dx.doi.org/10.1109/7.570713 IEARAX 0018-9251 Google Scholar
L. M. NovakB. C. Burl,
“Optimal speckle reduction in polarimetric SAR imagery,”
IEEE Trans. Aerosp. Electron. Syst., 26 293
–305
(1990). http://dx.doi.org/10.1109/7.53442 IEARAX 0018-9251 Google Scholar
R. RingroseN. Harris,
“Ship detection using polarimetric SAR data,”
in SAR Workshop: CEOS,
687
(2000). Google Scholar
R. Touzi,
“Calibrated polarimetric SAR data for ship detection,”
in Geoscience and Remote Sensing Symposium, 2000. IGARSS’00,
144
–146
(2000). Google Scholar
J. ChenY. C. ChenJ. Yang,
“Ship detection using polarization cross- entropy,”
IEEE Geosci. Remote Sens. Lett., 6
(4), 723
–727
(2009). http://dx.doi.org/10.1109/LGRS.2009.2024224 IGRSBY 1545-598X Google Scholar
C. C. WangY. WangM. S. Liao,
“Removal of azimuth ambiguities and detection of ship: using polarimetric airborne C-band SAR images,”
Int. J. Remote Sens, 33
(10), 3197
–3210
(2012). http://dx.doi.org/10.1080/01431161.2011.633123 IJSEDK 0143-1161 Google Scholar
C. LiuC. H. Gierull,
“A new application for PolSAR imagery in the field of moving target indication/ship detection,”
IEEE Trans. Geosci. Remote Sens., 45
(11), 3426
–3436
(2007). http://dx.doi.org/10.1109/TGRS.2007.907192 IGRSD2 0196-2892 Google Scholar
D. VelottoM. SoccorsiS. Lehner,
“Azimuth ambiguities removal for ship detection using full polarimetric X-band SAR data,”
IEEE Trans. Geosci. Remote Sens., 52
(1), 76
–88
(2014). http://dx.doi.org/10.1109/TGRS.2012.2236337 IGRSD2 0196-2892 Google Scholar
A. Freeman,
“The effects of noise on polarimetric SAR data,”
in Geoscience and Remote Sensing Symposium, 1993. IGARSS’93. Better Understanding of Earth Environment International,
799
–802
(1993). Google Scholar
J. S. Leeet al.,
“Intensity and phase statistics of multilook olarimetric and interfereometric SAR imagery,”
IEEE Trans. Geosci. Remote Sens., 32
(5), 1017
–1028
(1994). http://dx.doi.org/10.1109/36.312890 IGRSD2 0196-2892 Google Scholar
J. S. LeeA. R. MillerK. W. Hoppel,
“Statistics of phase difference and product magnitude of multilook processed Gaussian signals,”
Waves in Random Media, 4 307
–319
(1994). http://dx.doi.org/10.1088/0959-7174/4/3/006 WRMEEV 0959-7174 Google Scholar
BiographyYunhua Wang received his MS and PhD degrees in radio science from Xidian University, Xi’an, China, in 2005 and 2006, respectively. He is currently with the Ocean Remote Sensing Institute, Ocean University of China, Qingdao, China. His research interests include asymptotic and numerical simulations of electromagnetic wave scattering from random sea surfaces and SAR remote sensing of the ocean. Huimin Li is currently studying for an MS degree in ocean information sensing and processing from the Ocean University of China. She received a Bachelor of Science in marine technology from the Ocean University of China, Qingdao, China, in 2013. Her main research of interest focuses on the utilization of polarimetric SAR data for target detection and dynamic element retrieval. Yanmin Zhang was born in Shandong, China, in 1979. She received the PhD degree in optics from Huazhong University of Science and Technology, Wuhan, China, in 2007. She is currently with the College of Information Science and Engineering, Ocean University of China, Qingdao, China. Her current research interests include electromagnetic scattering from sea surface and applications for remote sensing. Lixin Guo received the MS degree in radio science from Xidian University, Xi’an, China, and the PhD degree in astrometry and celestial mechanics from the Chinese Academy of Sciences, Beijing, China, in 1993 and 1999, respectively. He was a visiting scholar with the School of Electrical Engineering and Computer Science, Kyungpook National University, Daegu, Korea, from 2001 to 2002. His current research interests include electromagnetic wave propagation and scattering in random media, computational electromagnetic. |
||||||||||||||||||||||||||||||||||||||||||||||||||||||||||||||||||||||||||||||||||||||||||||||||||||||||||||||||||||||||||||||||||||||||||||||||||||||||||||||||||||||||||||||||||||||||

