
|
|
1.IntroductionBoll weevil eradication programs have effectively eliminated weevil populations throughout all temperate regions of the United States Cotton Belt. The mandatory and timely elimination of cotton plants following harvest and subsequent creation of a host-free period has been deemed critical to the success of eradication programs. However, in a subtropical environment such as southern Texas, heavy rains often impede timely cotton stalk destruction and promote the regrowth of cotton plants.1 Further, winter temperatures cool enough to freeze and kill cotton plants rarely occur in South Texas. Consequently, cotton plants may regrow from shredded stalks following harvest, and subsequently provide weevils with a year-round source of food and host for reproduction. Early detection of regrowth cotton plants, which can serve as hosts for boll weevils during and beyond the production season, is critical for completing eradication in South Texas. However, timely detection of regrowth plants is a challenging process given the expansive cotton production areas. Furthermore, regrowth plants occurring in the middle of large fields are difficult to detect because such plants are not readily apparent from turn rows or roadsides. Emerging remote sensing technologies, such as synthetic aperture radar (SAR), have advanced the capability to resolve canopy structure, plant height, plant spacing, and soil moisture.2 Enhanced detection of diverse plant types, soil types, and water bodies has been achieved by using multiple radar frequencies that are polarized in various aspects. The SAR imaging resolution of the airborne SIR-C/X-SAR system ranged from 10 to 50 m, with the incidence angle varying from 15 to 60 deg.3 Further, interferometric coherence of two passes (flights) of an SAR system may be better able to distinguish among land cover feature classes.4 SAR technology such as the ENVISAT-1 ASAR with a 30-m nominal resolution is appropriate for detecting fields with a minimum required sampling area of .5 Due to the large required sampling area, SAR may not effectively detect small plants such as volunteer and regrowth cotton plants for which there is generally an open canopy. During the past decade, airborne multispectral imaging systems have been used in a number of high-spatial resolution applications, including crop condition assessments, precision agriculture, and crop disease management. The ability to obtain real time data over large areas also makes airborne multispectral imaging systems an attractive tool for detecting regrowth cotton plants. However, this application of aerial remote sensing has not been fully explored. Recent studies demonstrated that the spectral reflectance of cotton plants may be sufficiently different to distinguish cotton from other plant types. Ground-based hyperspectral reflectance data revealed that spectral reflectance properties (e.g., red-edge position) were different for cotton plants compared with other row crops during the vegetative and reproductive growth stages.6 The fusion of airborne multispectral imagery with ground-based hyperspectral reflectance data increased the accuracy in classifying cotton plants from other row crops.7 However, this work needs to be expanded to include the spectral signatures of image pixels containing mixed plant coverage. Additionally, ground-based observations of plant distribution and growth characteristics are needed to associate spectral reflectance values of cotton plants with actual plant distributions that vary by location and date. The selection of proper endmember reflectance spectra is critical for estimating plant abundance and crop yield.8 Linear spectral unmixing (LSU) is an analytical technique used to determine the relative abundance of matter detected in each pixel of multispectral or hyperspectral imagery. Reflectance measurements at each image pixel are assumed to be linear combinations of the reflectance from each type of matter present within the pixel. Plant abundance fractions obtained by applying the LSU technique to airborne hyperspectral imagery provided better correlation than broad-band normalized difference vegetation index (NDVI) values and the majority of narrow-band NDVI values.9,10 Further, vegetation indices derived from airborne multispectral images were well correlated with efficacy of cotton defoliation and subsequent regrowth.11 This approach relies on the fact that the camera viewing area encompasses soil as well as cotton plants. The use of the LSU technique may provide the capability to accurately detect cotton plants from mixed-pixel images and could result in earlier detection of small cotton plants and increased utility of medium-resolution images covering large areas. However, new information is needed to quantify the size of regrowth cotton plants based on the spectral reflectance of mixed image pixels that also incorporate spectral reflectance from the soil and other plant types. The growth rate of cotton has been related to the accumulation of degree-days above a threshold air temperature of 15.6°C, where a degree-day is the value of the daily mean air temperature minus the threshold air temperature.12 Degree-days are greater than or equal to zero, and no degree-days are accumulated if the daily mean air temperature is less than the threshold air temperature. Further, information about the effect of degree-day accumulation on the height and width of regrowth cotton plants is needed. Degree-day cotton plant regrowth regression models could be used to estimate when remote sensing images and LSU would be capable of estimating the mean size of regrowth cotton plants and identifying fields that are most likely to be or soon become hostable for boll weevil infestations. The goal of this study was to identify the smallest size of regrowth cotton plants detectable by airborne multispectral imaging so that fields can be located and plants destroyed before they become hostable for boll weevils. The specific objectives of this study were to apply airborne remote sensing techniques to compare the spectral properties of various stages of regrowth cotton over time, to estimate the canopy coverage of various sizes of regrowth cotton plants using the LSU technique and to develop a predictive model of cotton regrowth as a function of accumulated degree-days (). 2.Materials and MethodsA field located on the Texas A&M University farm in Burleson County, Texas, was prepared and planted with cotton (Deltapine 1050, Monsanto, St. Louis, Missouri) at a seed spacing of 10 cm (4 in.) and row spacing of 1.02 m (40 in.). Three shred date treatments and a nonshredded control were replicated four times (blocks) in a Latin square plot design to produce various stages of regrowth cotton plants. Each plot was 48 rows by 15.24 m, and the three shred dates were 30 July, 13 August, and 27 August, respectively. These dates cover the range of dates that cotton would be harvested and shredded in South Texas. A defoliant (Thidiazuron 4 SC, Arysta Lifescience North America Corp., Cary, North Carolina) was applied at a rate of 0.224 kg ai per ha (0.2 lb ai per acre) approximately two weeks prior to shredding plants in respective plots. A Cessna 206 fixed-wing aircraft equipped with two nadir-oriented, Canon 5D Mark II digital cameras, captured 21-megapixel images defined by a array of 16-bit pixels. One camera recorded a color image (broadband red-green-blue, RGB) (ISO 200, 2-ms exposure, ), and a second camera recorded a near-infrared image (broadband NIR) (ISO 200, 2-ms exposure, ). The spectral bands were 400 to 500 nm (blue), 500 to 600 nm (green), 600 to 700 nm (red), and 720 to 1000 nm (NIR). Two spectral reflectance indices, NDVI and Green NDVI (GNDVI), were derived from the measured spectral band measurements, where and . Airborne multispectral images ( viewing area with 0.1-m pixel resolution) were acquired from flights at an altitude of above ground level. Four tarps with unique reflectance attributes (4%, 16%, 32%, and 48%) were placed near the field and within the field of view of each airborne multispectral image. The reflectance tarps were used to establish the regression fit between measured spectral reflectance (absolute digital number, DN) and relative reflectance (%) for each spectral band. Multispectral imaging flights were made on 29 June, 16 July, 26 July, 9 August, 22 August, 6 September, 20 September, 4 October and 19 October 2012 before the mandatory cotton stalk destruction date of 31 October. In conjunction, the spectral reflectance, height, and width of 20 cotton plants and 10 bare soil locations were measured in each plot on the same dates or within one day of the aerial image acquisition dates (i.e., 28 June, 16 July, 26 July, 9 August, 23 August, 6 September, 20 September, 4 October, and 19 October 2012). Additionally, mean spectral reflectance and plant growth characteristics were derived for all plots 17 days before the first shredding date to verify uniform plant size among plots. A Fieldspec Handheld2 hyperspectral radiometer (Analytical Spectral Devices, Inc., Boulder, Colorado) acquired reflectance measurements from 325 to 1075 nm at a sampling interval of 1.5 nm. The radiometer was operated using a bare fiber optic and radiometric samples were acquired using an integration time of 34 ms. A (60-sample) dark current and (60-sample) white reference measurement of a spectralon reflectance disk were recorded to initially calibrate the radiometer, before acquiring (30-sample) hyperspectral reflectance measurements in each plot. Twenty hyperspectral reflectance measurements for the four reflectance tarps were used to establish the regression fit between the absolute DN and the relative value of airborne reflectance measurements for each of the four spectral bands. Daily air temperature data were acquired by a Campbell Scientific 21XL automated weather station (Campbell Scientific Inc., Logan, Utah). The RGB and NIR images were processed to create four-band multispectral images. Concurrent pairs of RGB and NIR images were imported into ArcMap 10.1 (ESRI, Redlands, California). A minimum of nine ground control points (three each on the left, center, and right sections of the images) was selected using the locations of obvious features such as trees and utility poles. To correct for misalignment of the RGB and NIR images, maps were rectified using linear transformation with nearest neighbor interpolation. The rectified images were saved in ERDAS Imagine format and imported to Idrisi Selva GIS and Remote Sensing software (Clark Labs, Worcester, Massachusetts) using the ERDIDRIS module with ERDAS Imagine format. A raster group file was created that contained each of the four spectral band images (red, green, blue, NIR). A area of interest (AOI) was created in the center of each sub-plot from the multispectral images from which pixel arrays were extracted for use in multispectral analysis. Multispectral reflectance values of “pure” pixels of soil and cotton plants were extracted from several locations in the AOI. Multispectral reflectance signature files (overall means for all observation dates) of soil and cotton plants were created using the MAKESIG module in Idrisi. LSU classification was performed using the four spectral bands and the two signature files. Histograms of estimated surface identity (soil and/or cotton) were generated to estimate percent canopy cover of cotton plants. The HISTO module was performed to create histograms of the soil and cotton multispectral reflectance signature files and to calculate mean DN values for each of the four multispectral bands for soil and cotton. The mean DN values for each band were entered into the ENDSIG module to create signature group files from the two ENDSIG signatures for soil and cotton. Daily degree-day values () were calculated and regressed with the height and width of cotton plants13 to derive the regrowth rate of cotton plants. Differences of plant height, plant width, reflectance for each of the four spectral bands, and two reflectance indices were analyzed using ANOVA in Proc GLM (SAS 9.3, SAS Institute, Cary, North Carolina). Mean separation of shredding treatments on each observation date was obtained using the Tukey adjustment at a significance level of . Subsequently, multispectral reflectance, plant height, and plant width data of post-treatment observations were analyzed relative to days after treatment using a repeated-measures ANOVA [using the AR(1) covariance structure] in Proc Mixed (SAS 9.3, SAS Institute, Cary, North Carolina). Linear regression of regrowth cotton plant height and width versus degree-days and of the ratio of plant width to row spacing and estimated canopy cover were calculated using Proc Reg (SAS Institute, Cary, North Carolina). 3.ResultsA sequence of nine airborne color images of the experimental regrowth cotton field displays the visual characteristics of the plots before and after the shredding treatments (Fig. 1). Based on the images taken on 29 June and 16 July [Figs. 1(a) and 1(b)], which correspond with the pretreatment phase of the study, vegetative growth appears to be uniform in and among all plots. There were no significant differences of mean plant height (; ; ), plant width (; ; ), red (; ; ), green (; ; ), blue (; ; ), or NIR (; ; ) reflectance, GNDVI (; ; ), or NDVI (; ; ) between plots on the pretreatment date of 29 June. Fig. 1Airborne color images of regrowth cotton plots and reflectance calibration tarps in Burleson County, Texas, in 2012.  Subsequently, plots were sequentially defoliated and shredded for completion of all shredding treatments by 22 August. Table 1 summarizes the mean spectral reflectance and reflectance indices for the four post-treatment dates (6 September, 20 September, 4 October, and 19 October). Table 1Mean spectral reflectance and reflectance indices of regrowth cotton plots (after defoliation and shredding) in Burleson County, Texas, on 6 September, 20 September, 4 October, and 19 October 2012.
Note: Row means identified with the same letter are not significantly different at α=0.05. Mean reflectance and reflectance indices changed significantly relative to days after treatment for red (; ; ), green (; ; ), blue (; ; ), and NIR reflectance (; ; ), NDVI (; ; ), and GNDVI (; ; ). The interaction of shredding treatment-by-days after treatment was significant for red (; ; ), green (; ; ), and blue reflectance (; ; ), NDVI (; ; ), and GNDVI (; ; ), but not for NIR reflectance (; ; ). Trends in the four reflectance bands and two reflectance indices were consistent among shredding dates for the regrowth cotton plots. Red, green, and blue reflectance decreased throughout the regrowth period. Conversely, NDVI and GNDVI increased throughout the regrowth period. NIR reflectance decreased from 6 September to 20 September and increased thereafter. These results reveal similar trends in the spectral characteristics of cotton plots after shredding, although one must account for shredding date when estimating the mean size of regrowth cotton plants by LSU analysis of the four spectral bands. Regrowth cotton plants in the shredding treatments generally increased in height and width throughout the study (Table 2). Plant height (; ; ) and plant width (; ; ) changed significantly relative to days after treatment. However, changes of plant height (; ; ) and plant width (; ; ) over time were consistent among shredding treatments. The mean height of regrowth cotton plants for all shredding treatments differed significantly from the control plots throughout the study. The mean height of regrowth cotton plants for all shredding treatments was significantly different only on 20 September. The mean width of regrowth cotton plants differed significantly from the control plots except on 4 October for the first shredding treatment. Table 2Mean plant height and plant width in regrowth cotton plots in Burleson County, Texas, in 2012.
Note: Row means identified with the same letter are not significantly different at α=0.05. By separately plotting the height and width of the cotton plants versus cumulative degree-days () after the shredding date, the rate of regrowth appeared to be similar among shredding treatments (Fig. 2). Regression of mean height (and mean width) versus degree-days accurately estimated (, , for height; , , for width) the rate of regrowth following shredding, where each point in the charts was derived as a mean value of each treatment composed of four replicated plots for each post-treatment date (Fig. 3). Fig. 2Mean height (a) and width (b) of regrowth cotton plants versus cumulative degree-days () relative to shredding dates of 30 July, 13 August, and 27 August 2012.  Fig. 3Linear regression of mean height (a) and width (b) of regrowth cotton plants versus cumulative degree-days () relative to shredding dates of 30 July, 13 August, and 27 August 2012. 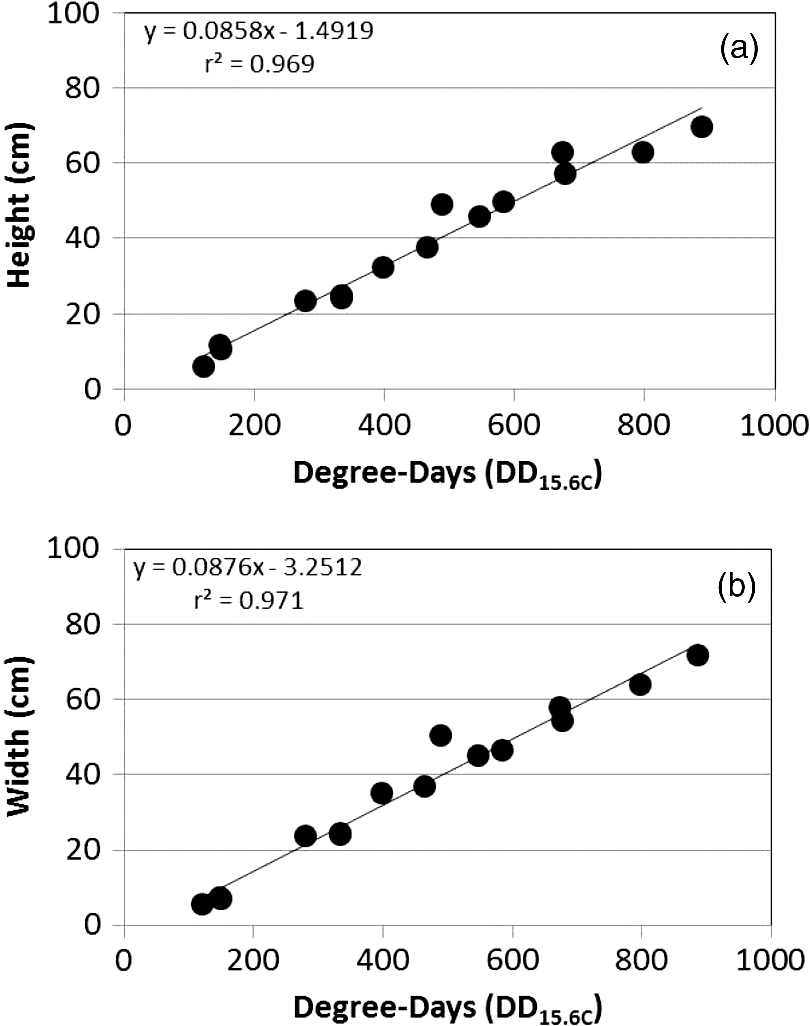 The proportion of canopy cover within the regrowth cotton plots and control plots was estimated using the LSU technique. The estimated canopy cover for the three shredding treatments followed the expected pattern of a steep decrease in canopy cover after defoliation and shredding, and a steep increase in canopy cover during the regrowth phase (Fig. 4). By the end of the study (19 October), the estimated canopy cover ranged from about 0.45 to 0.55 for the regrowth plots compared to about 0.75 for the control plots. The estimated canopy cover for the control plots declined from a peak of about 0.90 on 9 August and leveled out at about 0.60 until increasing to about 0.75 on 19 October. Fig. 4Linear spectral unmixing (LSU) estimates of experimental plots of regrowth cotton plants in Burleson County, Texas, in 2012.  The linear regression fit of the mean ratio of plant width to row spacing and the LSU estimate of canopy cover for all shredding treatments and control plots was significant (, , ) (Fig. 5). However, the estimated canopy cover substantially underestimated the mean ratio of plant width to row spacing when the plant width was less than about 20% of the row width, or about 0.2 m. Estimated canopy cover more closely matched the mean ratio of plant width to row spacing when the plant width exceeded 20% of the row width. Fig. 5Linear regression of the mean ratio of plant width to row spacing versus LSU estimates of canopy cover in regrowth cotton plots in Burleson County, Texas, in 2012.  A comparison of hyperspectral spectra for cotton plots in the three shredding treatments and the control plot on 6 September is shown in Fig. 6. The reflectance spectrum for the 27 August shredding date was distinctly different from that of the other two shredding treatments and the control, especially in the visible range (400 to 700 nm). An abundance of cotton lint in the plots that were shredded on 27 August likely contributed to increased reflectance in the visible range. 4.DiscussionThe results show that airborne multispectral imagery (0.1-m pixel resolution) can be used to estimate the development of regrowth cotton fields when cotton plant width is approximately equal to or greater than 0.2 m. Although the LSU technique provided a direct estimate of percent canopy cover from mixed pixel reflectance,14 estimates of the mean ratio of plant width to row spacing (a surrogate for percent canopy cover in row crops) in regrowth cotton plots were ill-defined when plant width was (i.e., twice the multispectral image pixel resolution of 0.1 m). Although plots were cultivated before each remote sensing flight, weeds may have inflated LSU estimates of mean cotton plant width especially during the early stage of cotton regrowth. The variability of estimated canopy cover was likely due to nonuniformity (skippiness and asymmetric shape) of the regrowth plants at the onset of the regrowth stage, which inflated the measured ratio of plant width to row spacing. These factors could be accounted for by collecting more plant samples along a fixed length of row or by the use of the leaf area index. Similar difficulty has been reported in quantifying the plant density of prefruiting cotton fields.15 Acquisition of thermal infrared reflectance16 or fluorescence spectra17 may enhance the ability to distinguish vegetation from soil due to different absorption processes. Incorporation of additional reflectance signatures (e.g., cotton lint) in the LSU analysis may improve the accuracy of canopy cover estimates and may help distinguish cotton plants from weeds and other vegetation. Spatial resolution of the imagery is also important for distinguishing among plant types,18 however, radiometric resolution is not as important as spatial resolution.19 Regardless, the LSU estimates of the development of regrowth cotton plants will provide boll weevil eradication program managers with a tool for timely detection of regrowth cotton in previously harvested fields for which cotton stalks have not been destroyed due to limited access (e.g., flooding) or neglect. Most consumer-grade color cameras (including the Canon 5-D Mark II) acquire three-band images using a Bayer filter pattern that interpolates reflectance values between measured pixels for each spectral band. However, pixel interpolation degrades the spatial resolution of each band image. Alternatively, cameras that acquire noninterpolated images for each spectral band can enhance spectral, radiometric, and spatial resolution, which will enhance the capability to distinguish between cotton plants and other vegetation. Changes in image pixel interpolation techniques or the use of multiple monochromatic cameras may require the acquisition of new spectral endmember data, especially when the remote sensing objective is to detect and distinguish individual cotton plants from other crops and weeds. Additional information about the physical dimensions of plants can be obtained by incorporating laser (lidar) height measurements or by deriving the bidirectional reflectance distribution function from multiangle airborne images.20 Alternatively, it may be possible to analyze shadows in single, two-dimensional airborne images from which to reconstruct three-dimensional plant structures. Complementary use of oblique imaging angles21 and various solar angles22 may improve the detection of individual plants, diverse plant types, and shade. 5.ConclusionsLSU analysis of high-resolution (0.1-m) aerial multispectral images was shown to effectively monitor the mean size of regrowth cotton plants in field plots when plant width exceeded 0.2 m. However, the shredding date was found to influence the spectral reflectance properties used for identifying canopy cover of regrowth cotton plots. Our results also show that the mean width of regrowth cotton plants is highly correlated with degree-day () accumulations regardless of the shredding date. Consequently, predicted degree-day accumulations can be used to project the mean width of regrowth cotton plants after their detection using LSU analysis of multispectral images or after events such as the onset of spring warming, substantial precipitation after drought, or harvest and stalk destruction. However, LSU analysis of aerial multispectral images was not applied to the detection of individual regrowth cotton plants, which often grow singularly or in clusters depending on the effectiveness of stalk destruction and the suitability of growing conditions. Further research is needed to associate the development of fruiting structures (i.e., cotton squares and bolls) with various widths of regrowth cotton plants. Estimating the likelihood that remotely sensed cotton plants are of a specific size and growth stage will aid boll weevil eradication program managers in identifying which fields are most likely to be, or will soon become, hostable for boll weevil infestations. AcknowledgmentsWe thank the Cotton Foundation (general project #5002-009-00) and Cotton Inc. (core project #10-776) for funding this project, and Mike O’Neil, Parker Knutson, Fred Gomez, Lee Denham, and Cody Wall for their technical assistance. Mention of trade names or commercial products in this article is solely for the purpose of providing specific information and does not imply recommendation or endorsement by the U.S. Department of Agriculture. USDA is an equal opportunity provider and employer. ReferencesK. R. Summy et al.,
“Control of boll weevils (Coleoptera: Curculionidae) through crop residue disposal: destruction of subtropical cotton under inclement conditions,”
J. Econ. Entomol., 79
(6), 1662
–1665
(1986). http://dx.doi.org/10.1093/jee/79.6.1662 JEENAI 0022-0493 Google Scholar
P. Patel and H. S. Srivastava,
“RADARSAT-2 announcement of opportunity project on soil moisture, surface roughness and vegetation parameter retrieval using SAR polarimetry,”
81
(2013). Google Scholar
H. S. Srivastava et al.,
“Multi-frequency and multi-polarized SAR response to thin vegetation and scattered trees,”
Curr. Sci., 97
(3), 425
–429
(2009). CUSCAM 0011-3891 Google Scholar
H. S. Srivastava, P. Patel and R. R. Navalgund,
“Application potentials of synthetic aperture radar interferometry for land-cover mapping and crop-height estimation,”
Curr. Sci., 91
(6), 783
–788
(2006). CUSCAM 0011-3891 Google Scholar
P. Patel, H. S. Srivastava and R. R. Navalgund,
“Estimating wheat yield: an approach for estimating number of grains using cross-polarised ENVISAT-1 ASAR data,”
Proc. SPIE, 6410 641009
(2006). http://dx.doi.org/10.1117/12.693930 PSISDG 0277-786X Google Scholar
H. Zhang et al.,
“Differentiation of cotton from other crops at different growth stages using spectral properties and discriminant analysis,”
Trans. ASABE, 55
(4), 1623
–1630
(2012). http://dx.doi.org/10.13031/2013.42229 TARSBB Google Scholar
H. Zhang et al.,
“Fusion of remotely sensed data from airborne and ground-based sensors to enhance detection of cotton plants,”
Comput. Electron. Agric., 93 55
–59
(2013). http://dx.doi.org/10.1016/j.compag.2013.02.001 CEAGE6 0168-1699 Google Scholar
C. Yang, J. H. Everitt and J. M. Bradford,
“Using multispectral imagery and linear spectral unmixing techniques for estimating crop yield variability,”
Trans. ASABE, 50
(2), 667
–674
(2007). http://dx.doi.org/10.13031/2013.22658 TARSBB Google Scholar
C. Yang, J. H. Everitt and J. M. Bradford,
“Airborne hyperspectral imagery and linear spectral unmixing for mapping variation in crop yield,”
Precis. Agric., 8
(6), 279
–296
(2007). http://dx.doi.org/10.1007/s11119-007-9045-x 1385-2256 Google Scholar
C. Yang, J. H. Everitt and Q. Du,
“Errata: applying linear spectral unmixing to airborne hyperspectral imagery for mapping yield variability in grain sorghum and cotton fields,”
J. Appl. Rem. Sens., 4
(1), 041887
(2010). http://dx.doi.org/10.1117/1.3484252 1931-3195 Google Scholar
C. Yang et al.,
“Assessing cotton defoliation, regrowth control and root rot infection using remote sensing technology,”
Int. J. Agric. Biol. Eng., 4
(4), 1
–11
(2011). http://dx.doi.org/10.3965/j.issn.1934-6344.2011.04.001-011 IJABBL 1934-6344 Google Scholar
D. D. Fromme et al.,
“Effect of an upper temperature threshold on heat unit calculations, defoliation timing, lint yield, and fiber quality in cotton,”
J. Cotton Sci., 18
(2), 108
–121
(2014). JCOSF6 1524-3303 Google Scholar
T. G. Teague et al.,
“COTMAN in cotton research,”
in Proc. Beltwide Cotton Conf.,
(2000). Google Scholar
G. J. Fitzgerald, S. J. Maas and W. R. Detar,
“Spider mite detection and canopy component mapping in cotton using hyperspectral imagery and spectral mixture analysis,”
Precision Agric., 5
(3), 275
–289
(2004). http://dx.doi.org/10.1023/B:PRAG.0000032766.88787.5f 1385-2256 Google Scholar
J. Bai, J. Li and S. Li,
“Monitoring the plant density of cotton with remotely sensed data,”
in Computer and Computing Technologies in Agriculture IV,
90
–101
(2011). http://dx.doi.org/10.1007/978-3-642-18336-2 Google Scholar
S. Moran et al.,
“Sensor development and radiometric correction for agricultural applications,”
Photogram. Eng. Rem. Sens., 69
(6), 705
–718
(2003). http://dx.doi.org/10.14358/PERS.69.6.705 PGMEA9 0099-1112 Google Scholar
C. S. T. Daughtry et al.,
“Potential for discriminating crop residues from soil by reflectance and fluorescence,”
Agron. J., 87
(2), 165
–171
(1995). http://dx.doi.org/10.2134/agronj1995.00021962008700020005x AGJOAT 0002-1962 Google Scholar
D. W. Lamb and R. B. Brown,
“PA – Precision agriculture: remote-sensing and mapping of weeds in crops,”
J. Agric. Eng. Res., 78
(2), 117
–125
(2001). http://dx.doi.org/10.1006/jaer.2000.0630 JAERA2 0021-8634 Google Scholar
C. Yang et al.,
“Effects of image spatial and radiometric resolutions on the detection of cotton plants,”
in Proc. Beltwide Cotton Conference, 500-506, National Cotton Council,
(2013). Google Scholar
C.-Y. Huang and G. P. Asner,
“Applications of remote sensing to alien invasive plant studies,”
Sensors, 9
(6), 4869
–4889
(2009). http://dx.doi.org/10.3390/s90604869 SNSRES 0746-9462 Google Scholar
W. C. Bausch and K. Diker,
“Innovative remote sensing techniques to increase nitrogen use efficiency of corn,”
Commun. Soil Sci. Plant Anal., 32
(7–8), 1371
–1390
(2001). http://dx.doi.org/10.1081/CSS-100104117 CSOSA2 0010-3624 Google Scholar
P. J. PinterJr. et al.,
“Diurnal patterns of wheat spectral reflectances,”
IEEE Trans. Geosci. Rem. Sens., GE-21
(2), 156
–163
(1983). http://dx.doi.org/10.1109/TGRS.1983.350484 IGRSD2 0196-2892 Google Scholar
BiographyJohn K. Westbrook is a research meteorologist at the U.S. Department of Agriculture. He received his BS degree in meteorology at California State University at San Jose in 1977, and MS and PhD degrees in biometeorology from Utah State University in 1980 and 1982, respectively. He is the author of more than 60 journal papers and has written seven book chapters. His current research interests include airborne multispectral imaging of crops and weeds. |
||||||||||||||||||||||||||||||||||||||||||||||||||||||||||||||||||||||||||||||||||||||||||||||||||||||||||||||||||||||||||||||||||||||||||||||||||||||||||||||||||||||||||||||||||||||||||||


