|
|
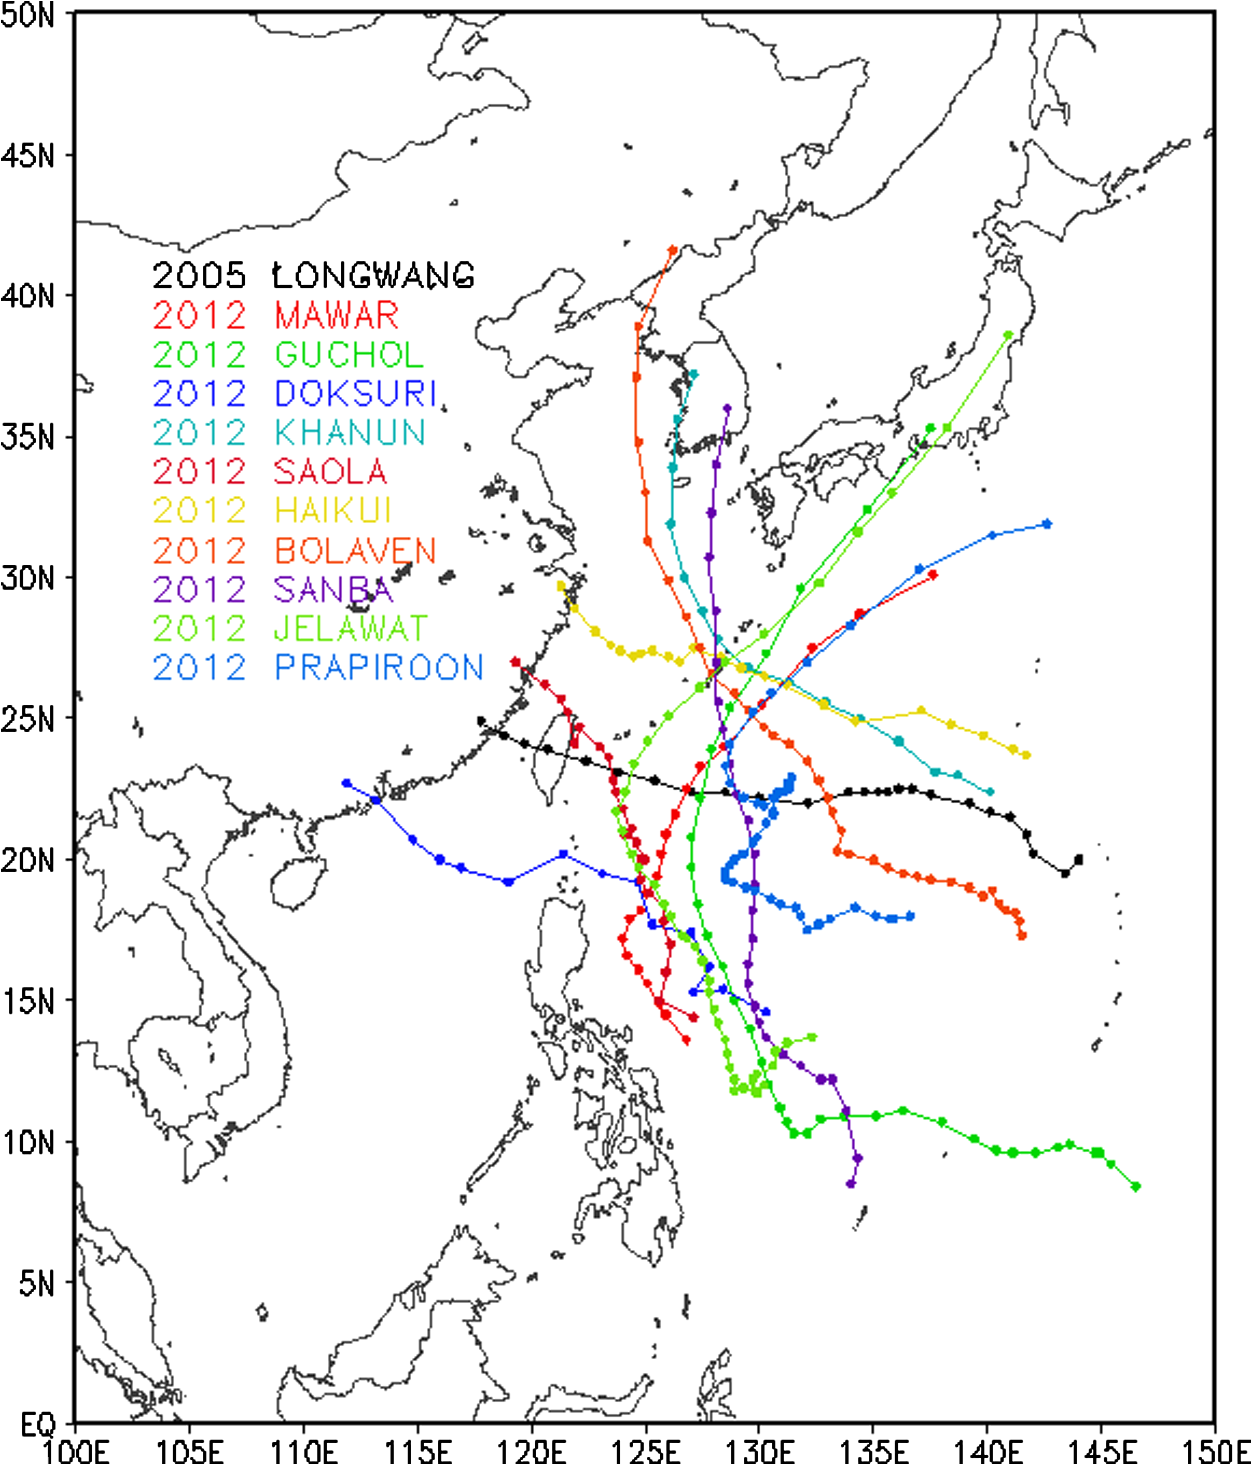
1.IntroductionTropical cyclones are one of the nature’s most destructive weather systems. Identifying and forecasting tropical cyclone intensity changes have been a challenge for forecasters. As most of these powerful storms initially develop over an ocean, direct in situ measurements are scarce.1–3 Given the high spatial and temporal resolutions of satellites, satellite remote sensing has become a tool that heavily relies on tropical cyclone monitoring to provide pertinent vital data. In the past, a few techniques had been developed to estimate the intensity of tropical cyclones through satellite remote sensing data. Some of the techniques estimate intensity using microwave data from the advanced microwave sounding unit,4–6 the special sensor microwave imager,7,8 and tropical rainfall measuring mission/microwave imager (TRMM/TMI).9 Yet, as most microwave instruments are placed on board polar-orbiting satellites, it is difficult to obtain hourly data regarding tropical cyclone intensity changes, even though the global precipitation measurement mission could provide frequent observations (every 2 to 3 h) of Earth’s precipitation. In contrast to the microwave data, the optical observations from geostationary meteorological satellites are considered more suitable source data in characterizing hourly intensity variations. The scientists at the National Oceanic and Atmospheric Administration/National Environmental Satellite, Data and Information System, led by Vernon Dvorak, developed satellite applications specifically aimed toward operational forecasting of tropical cyclones. During the early years of satellite observations, they proposed an algorithm to determine the intensity of tropical cyclones through subjective cloud pattern recognition,10 which is known as the Dvorak technique; this method was later supplemented with the enhanced infrared method.11 The technique has been employed by tropical forecast centers around the world for over 30 years, which utilizes intensity units known as T numbers. However, the downside of the Dvorak algorithm is that it is subjective. To remove the subjective manual process from the original Dvorak method, an objective Dvorak technique was developed.12,13 A technique involving different water vapor and infrared window channel brightness temperature (TB) values to identify and quantify intense convection in tropical cyclones using bispectral geostationary satellite imagery was proposed by Olander and Velden.14 They first made a cross-section analysis of TB values of water vapor and infrared window channels for Hurricane Wilma (2005). They found that the most negative values (the infrared minus water vapor) are concentrated within the eyewall regions, while outside of the eyewall regions, the values are near zero or positive, indicating less vigorous convection. Moreover, when compared with three infrared enhancements and radar images, the differencing imagery showed the possibility to aid in tropical cyclone center identification. Other recent studies on delineating tropical cyclone intensity have been conducted via the optical channels of geostationary satellites. In particular, Mueller et al. objectively estimated the tropical cyclone wind structure using satellite infrared data.15 Kossin et al. described a satellite-based technique, in which the tropical cyclone radius of the respective maximum winds and the two-dimensional surface wind field were derived from satellite infrared data.16 Chao et al. tried to offer an approach by calculating the angular speed of a typhoon’s cloud band rotation using geostationary satellite data. The results of that study demonstrated the viability of using geostationary satellite image data in estimating the maximum wind speed of a typhoon.17 Piñeros et al.18–20 and Ritchie et al.21 discussed the tropical cyclone axi-symmetry and estimated tropical cyclone intensity from infrared images. Rouse et al. calculated a normalized ratio of the near-infrared and red bands and proposed an index called the normalized difference vegetation index.22 It was then used in many fields, such as estimations of vegetation biomass, leaf area, the proportion of absorbed photosynthetically active radiation, etc.23–27 In addition, the normalized difference vegetation index is also an important parameter in various types of models, such as general circulation and biogeochemical models. The normalized ratio has the advantages of showing the value range of a relatively concentrated normalized difference vegetation index and a nonlinearly enhanced contrast nonlinearly. Moreover, it provides opportunities for time-series analyses.28 The aim of this study was to combine the concepts of differencing imagery from infrared and water vapor channels14 and the skill in calculating a normalized ratio,22 then to define a new parameter based on TBs of infrared and water vapor channels and apply it to analyze the positions of the centers, overshooting areas, and intensity of typhoons. The structure of this paper is as follows. The data collection and processing are shown in Sec. 2. The methodology for the establishment of the normalized difference convection index (NDCI) is described in Sec. 3. The results and discussion are shown in Sec. 4. Finally, a conclusion is given in Sec. 5. 2.DataThe satellite data used in this study were from the GOES-9 and MTSAT geostationary meteorological satellites, which provided hourly observations of visible data, as well as two infrared observations (over channels IR1, 10.5 to and IR2, 11.5 to ) and a set of water vapor observations (over channel WV, 6.5 to ). The TB data of the original IR1 channel and WV channel, which were resampled into 0.05° by 0.05° longitude-latitude grid data for calculation purposes, provided by Weather Home, Kochi University, Japan, were employed in this research. The best tracking typhoon data from Joint Typhoon Warning Center (JTWC) were used to identify the change in intensity and the overall typhoon movement. The life periods of typhoons were classified into four stages (tropical depression period, mild typhoon period, moderate typhoon period, and severe typhoon period) in this study based on the maximum sustained wind speed (Table 1). The wind speed of a tropical depression was (tropical depression in Saffir-Simpson Scale). The wind speed of a mild-strength typhoon was and (tropical storm in Saffir-Simpson Scale). Typhoons with a wind speed and are in their moderate typhoon stage (categories 1 and 2 in Saffir-Simpson Scale) and those with a wind speed were classified as in the severe typhoon stage (categories 3, 4, and 5 in Saffir-Simpson Scale). Eleven typhoon cases (shown in Table 2), including two mild typhoons, four moderate typhoons, and five severe typhoons in the Northwest Pacific Basin were used in this research. The position and 1-min mean sustained wind speeds of JTWC’s best track data were used to acquire the hourly positions of the typhoon’s center using a linear interpolation technique, identify the intensity change, and monitor the overall typhoon movement. Figure 1 showed the best tracks of typhoon cases in Table 2. Table 1The four stages during the life period of a typhoon are based on the maximum sustained wind speed.
Table 2The typhoon cases used in this research.
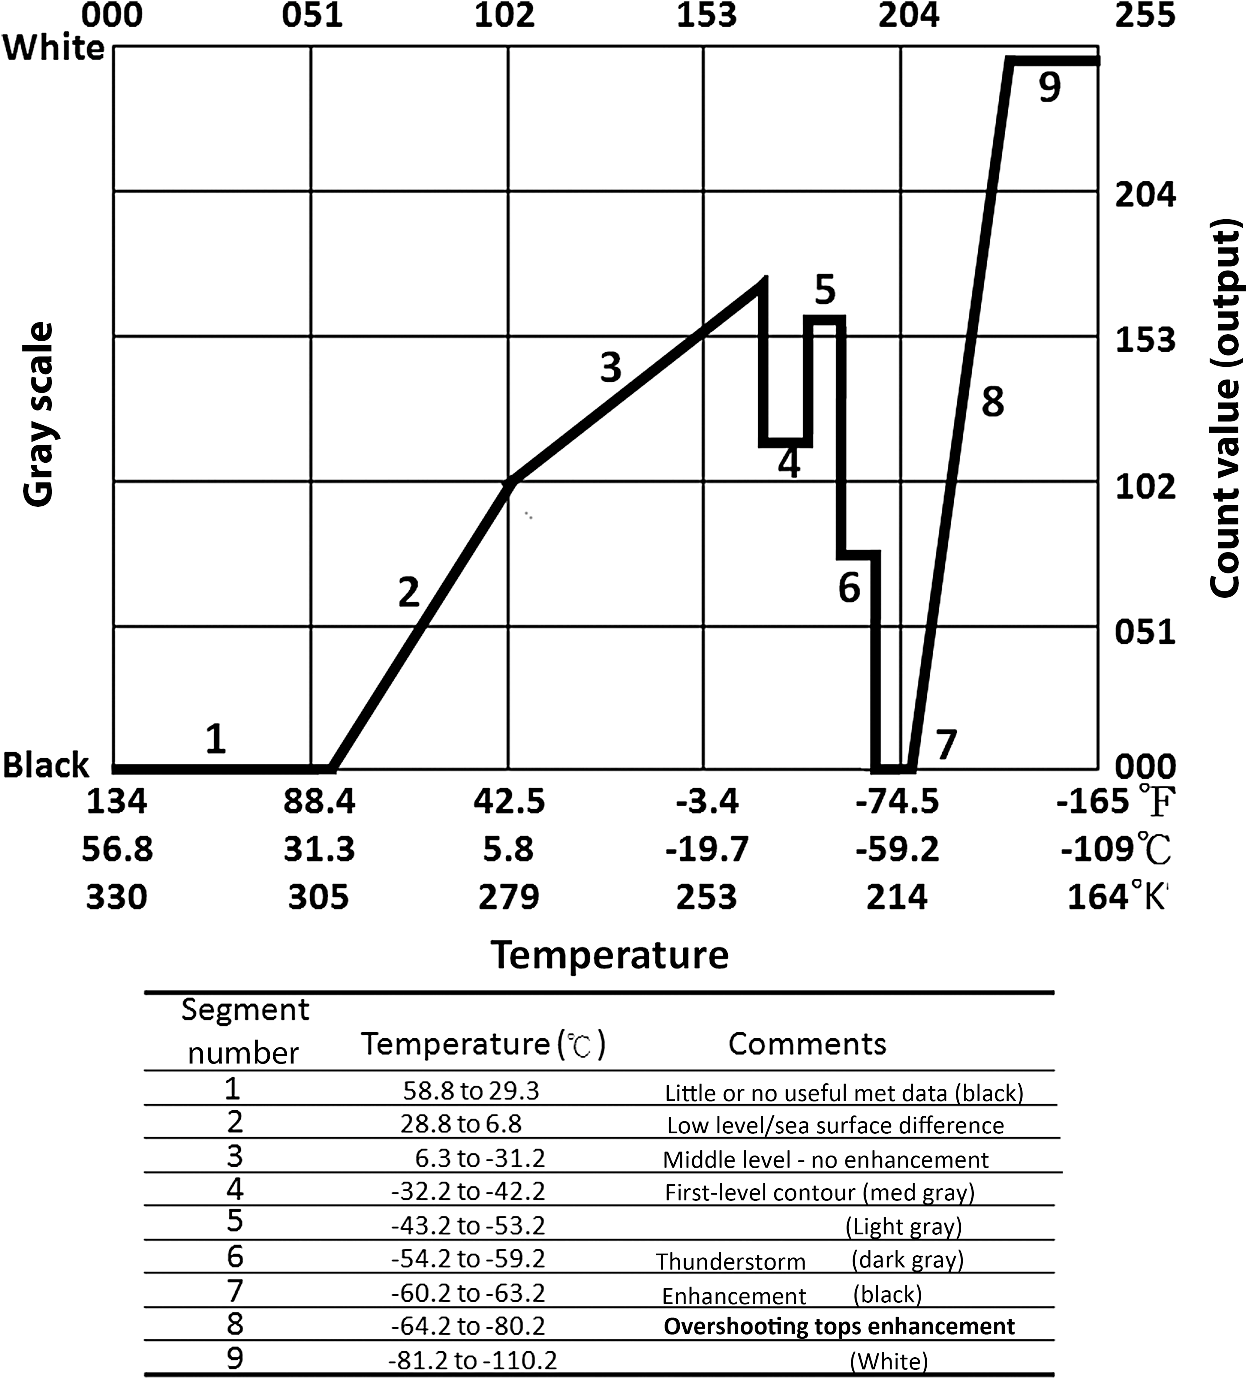
3.MethodologyThe spectral response peak of the IR1 channel was near the surface, while the peak of the WV channel was at the middle or upper troposphere (). Therefore, in general, TBs of IR1 images were larger than WV images under tropospheric clear-sky conditions. However, some convective cloud systems developed vertically so the TBs of the IR1 channel were relatively low, while the TBs of the WV channel were relatively high. Thus, the values of the TB of the IR1 channel minus the TB of the WV channel were positive for a tropospheric clear-sky condition, but negative for a convection condition. The reverse of the measured difference between the two channels was due to the reemitted absorbed radiation from the upper tropospheric to the lower stratospheric water vapor.29 It could also be explained by the contrast between the colder background of the IR1 TBs associated with the overshooting deep convection and warmer WV TB due to the emission from water vapor in the warmer stratosphere.30 In general, a typhoon has an eye situated at its geometric center. It may be clear or have spotty low clouds near the center, or it may be obscured by a cirrus canopy. There is, however, very little moisture, wind, and rain due to the sinking airflow. Therefore, there are different spectral features observed by IR1 and WV channels. These features then make it possible to identify the positions of overshooting areas in typhoon cloud systems and the centers and intensities of typhoons. The present study used the spectral features of the IR1 and WV channels of the satellite to define a new index, the TB of the infrared window channel minus the TB of the water vapor channel divided by the TB of the infrared window channel plus the TB of the water vapor channel. The values obtained by this equation are called the NDCI values. The mathematical form of the equation is where IR1 is the TB of the infrared window channel, WV is the TB of the water vapor channel, and the NDCI value is between and 1. The NDCI value at is the highest, 1, while that at is the lowest, . In the cases of a clear sky or an atmosphere with thin cloud and dry air, NDCI values should be . In the cases of a convective cloud system, NDCI values should be . In addition, the newly defined NDCI does show a significant difference from the simple difference of . For example, the NDCI value is at and , while the NDCI value is at and . The two times differences of NDCI values show that the features of clouds with an NDCI value of are quite different from those with an NDCI value of . The former may be low-level clouds, but the latter may be deep convections. However, the simple difference of cannot be used to distinguish the difference.The formation and development of a tropical cyclone is under the influences of both thermodynamic and dynamic conditions. In recent years, there have been several studies analyzing tropical cyclones from the thermodynamic viewpoint. Emanuel showed that the intensity of tropical cyclones depends strongly on air–sea interaction through a basic theory and numerical experiments.31,32 A decrease in the sea surface temperature gradient between the eye of a tropical cyclone and the surrounding water is also considered to be able to increase the maximum wind speed.33,34 Moreover, Hendricks et al. proposed the concept of vortical hot towers, which are strong cumulus updrafts. Vortical hot towers generate strong vorticity anomalies of both plus and minus signs and play an important role in the genesis of tropical cyclones.35 Montgomery et al. and Tory et al. continued the investigation of the vortical hot towers and found that the dominant force for intensification of tropical cyclones was latent heat release in convection associated with the ensemble vortical hot towers.36,37 Houze et al. explored the development of the Typhoon Ophelia (2005) and suggested that the vortical hot towers were favorable for the formation of the typhoon.38 Tao and Jiang examined the global distribution of hot towers in tropical cyclones using 11 years of TRMM data. Their results showed that there is a good linear relationship between the intensification of tropical cyclones and the percentage of hot towers in the inner core region of tropical cyclones.39 Thus, this study also tried to adopt NDCI and took the energy standpoint to analyze the development of typhoons. In addition, in order to simplify the identification of a convective cloud system so that discussions could be simple, this study used a TB of 192.8 to 208.8 K from the MB curve (shown as Fig. 2) as the deep convection area (overshooting area).40 4.Analysis and DiscussionTyphoon Longwang (2005) was first identified as a tropical depression on September 25, north of the Mariana Islands. Moving along a general westward track, the system quickly intensified and reached a mild typhoon stage (the maximum sustained wind speed ) at the longitude of 143.05°E and the latitude of 19.67°N at 03:00 UTC on September 26. After that, its intensity kept increasing and it reached the standard of a moderate typhoon stage (the maximum sustained wind speed ) at the longitude of 141.35°E and the latitude of 21.20°N at 21:00 UTC on September 26. The wind speed of the tropical cyclone reached the severe-intensity typhoon wind speed (maximum sustained wind speed ) at the longitude of 138.21°E and the latitude of 22.17°N at 19:00 UTC on September 27. As can be clearly seen in the satellite infrared images, the convective cloud systems had become more and more symmetric and the structure denser and denser with time. The typhoon eye showed up when the typhoon developed into a severe-strength typhoon stage (shown in Fig. 3). Fig. 3Images in infrared window of the GOES-9 geostationary meteorological satellite at (a) 03:00 UTC on September 26, (b) 21:00 UTC on September 26, and (c) 19:00 UTC on September 27, 2005.  Olander and Velden once performed a cross-section analysis regarding the infrared window channel and water vapor channel TBs in a tropical cyclone case. Their results showed that the difference values () were near zero or negative, indicating the presence of a vigorous convection overshooting cloud.14 This study first performed an NDCI cross-section analysis for the three stages of different wind speeds of the typhoon in Fig. 3. In the outside regions of the circulation of Typhoon Longwang, the clouds were typically less opaque or missing entirely, resulting in the difference in TB between IR1 and WV channels being positive. In other words, the NDCI values were positive under conditions with less opaque cloud. However, in the regions covering the clouds of Longwang, this relationship was reversed as the water vapor above the convection was forced through the troposphere and into the stratosphere. Therefore, the NDCI values were negative under the conditions with opaque cloud associated with intense, active, and deep convection. Figures 4 and 5 show the NDCI value changes with longitude (latitude) with the hatched lines based on the latitude (longitude) of the center of the typhoon at 03:00 UTC (mild-strength stage) and 21:00 UTC (moderate-strength stage) on September 26, respectively. According to Figs. 4 and 5, the NDCI values within the range of the 250 km radius of Typhoon Longwang center were mostly , and the values closer to the center of the circulation were smaller. Yet, when the typhoon eye was formed at 19:00 UTC on September 27 (severe-strength stage), the NDCI values within the eye suddenly increased (as shown in Fig. 6). The reason was that near the eye, the cloud layers were rather thin and the air was relatively dry. As a result, the IR1 and WV channel TBs were close. This result was similar to the result obtained by Olander and Velden using the cross-section analysis with difference values ().14 However, in this study, in the cross-section analysis of the NDCI values, the area of near-zero or negative pixels covered both the stratiform cloud systems and the convective cloud systems with deep vertical development or the overshooting areas. The latter cannot be depicted clearly and separately. Here we first used the IR1 TBs between 192.8 and 208.8 K of the MB curve as the criterion for determining the overshooting areas.40 According to Fig. 7(a), when Typhoon Longwang was formed, there was a round area around the center of the typhoon, which could be considered as the overshooting area, and the main deep convection area was at the south of the center of the typhoon. When the wind speed of Typhoon Longwang reached the standard for a moderate typhoon [shown in Fig. 7(b)], the overshooting area expanded significantly. Deep convective cloud systems were significant, especially at all the sides of the center of the typhoon. Thus, the overshooting areas across the center of the typhoon were symmetric with rotation. When the wind speed of Longwang reached the standard of the severe typhoon stage [as shown in Fig. 7(c)], in addition to the area where the typhoon eye was located, the overshooting cloud systems also distributed around the eye with the apparent rotation. According to the JTWC wind speed data, when Typhoon Longwang became a severe typhoon, because it was still above the sea, so there was sufficient energy supplied to Longwang for development. Therefore, its maximum sustained wind continued to increase. The typhoon kept on moving west with severe intensity. When this study conducted the tracking of the hourly data of the overshooting areas (figures not shown), it was found that the coverage of the overshooting areas did not necessarily increase as the intensity of the typhoon increased (compared with JTWC’s maximum sustained wind); on the contrary, it sometimes even decreased. For example, according to the distribution at 06:00 UTC on September 29, the overshooting areas even contracted and the coverage decreased [as shown in Fig. 7(d)]. Yet, during the development of the typhoon, the overshooting areas were all around the typhoon center. This may be considered a significant feature to be noted about the distributions of overshooting areas. Fig. 4The normalized difference convection index (NDCI) changes along the (a) latitude and (b) longitude within the range of a 250 km radius of the center of Typhoon Longwang (143.05°E and 19.67°N) at 03:00 UTC on September 26 (mild-strength stage). 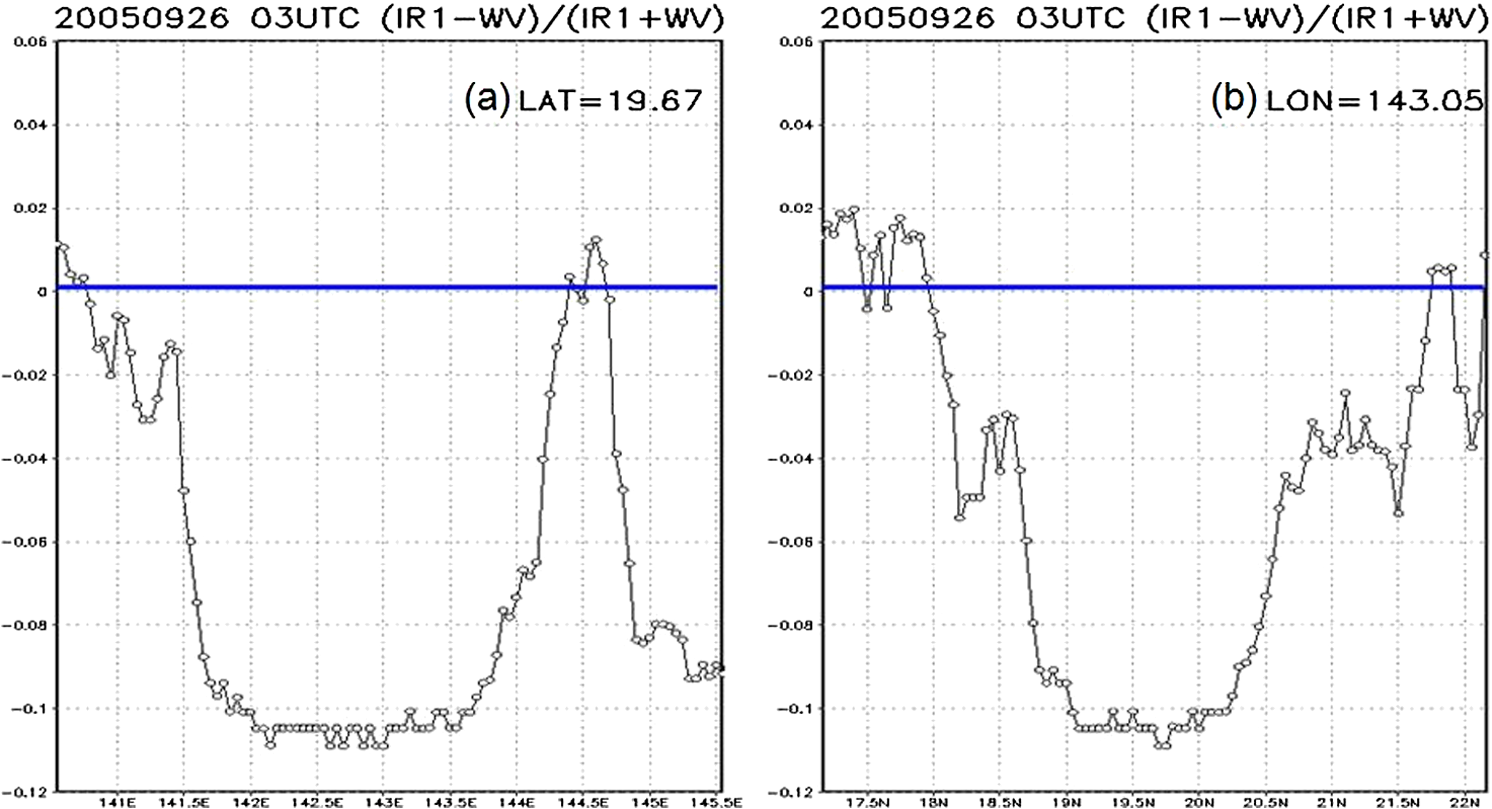 Fig. 5The NDCI changes along the (a) latitude and (b) longitude within the range of a 250 km radius of the center of Typhoon Longwang (141.35°E and 21.20°N) at 21:00 UTC on September 26 (moderate-strength stage). 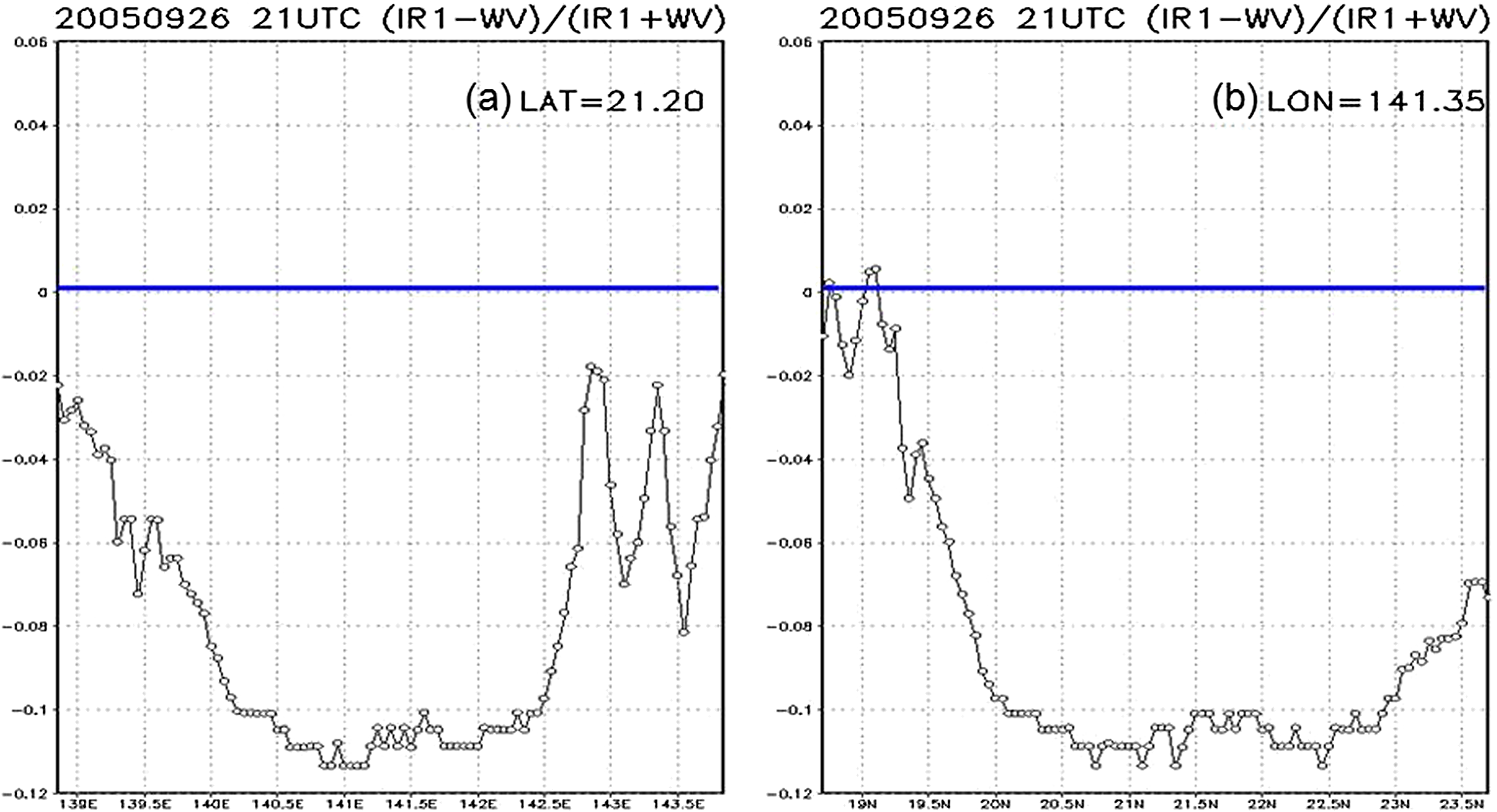 Fig. 6The NDCI changes along the (a) latitude and (b) longitude within the range of a 250 km radius of the center of Typhoon Longwang (138.21°E and 22.17°N) at 19:00 UTC on September 27 (severe-strength stage).  Fig. 7The overshooting areas (with the IR1 TB and ) at (a) 03:00 UTC on September 26 (mild-strength stage); (b) 21:00 UTC on September 26 (moderate-strength stage); (c) 19:00 UTC on September 27; and (d) 06:00 UTC on September 29 (severe-strength stage). 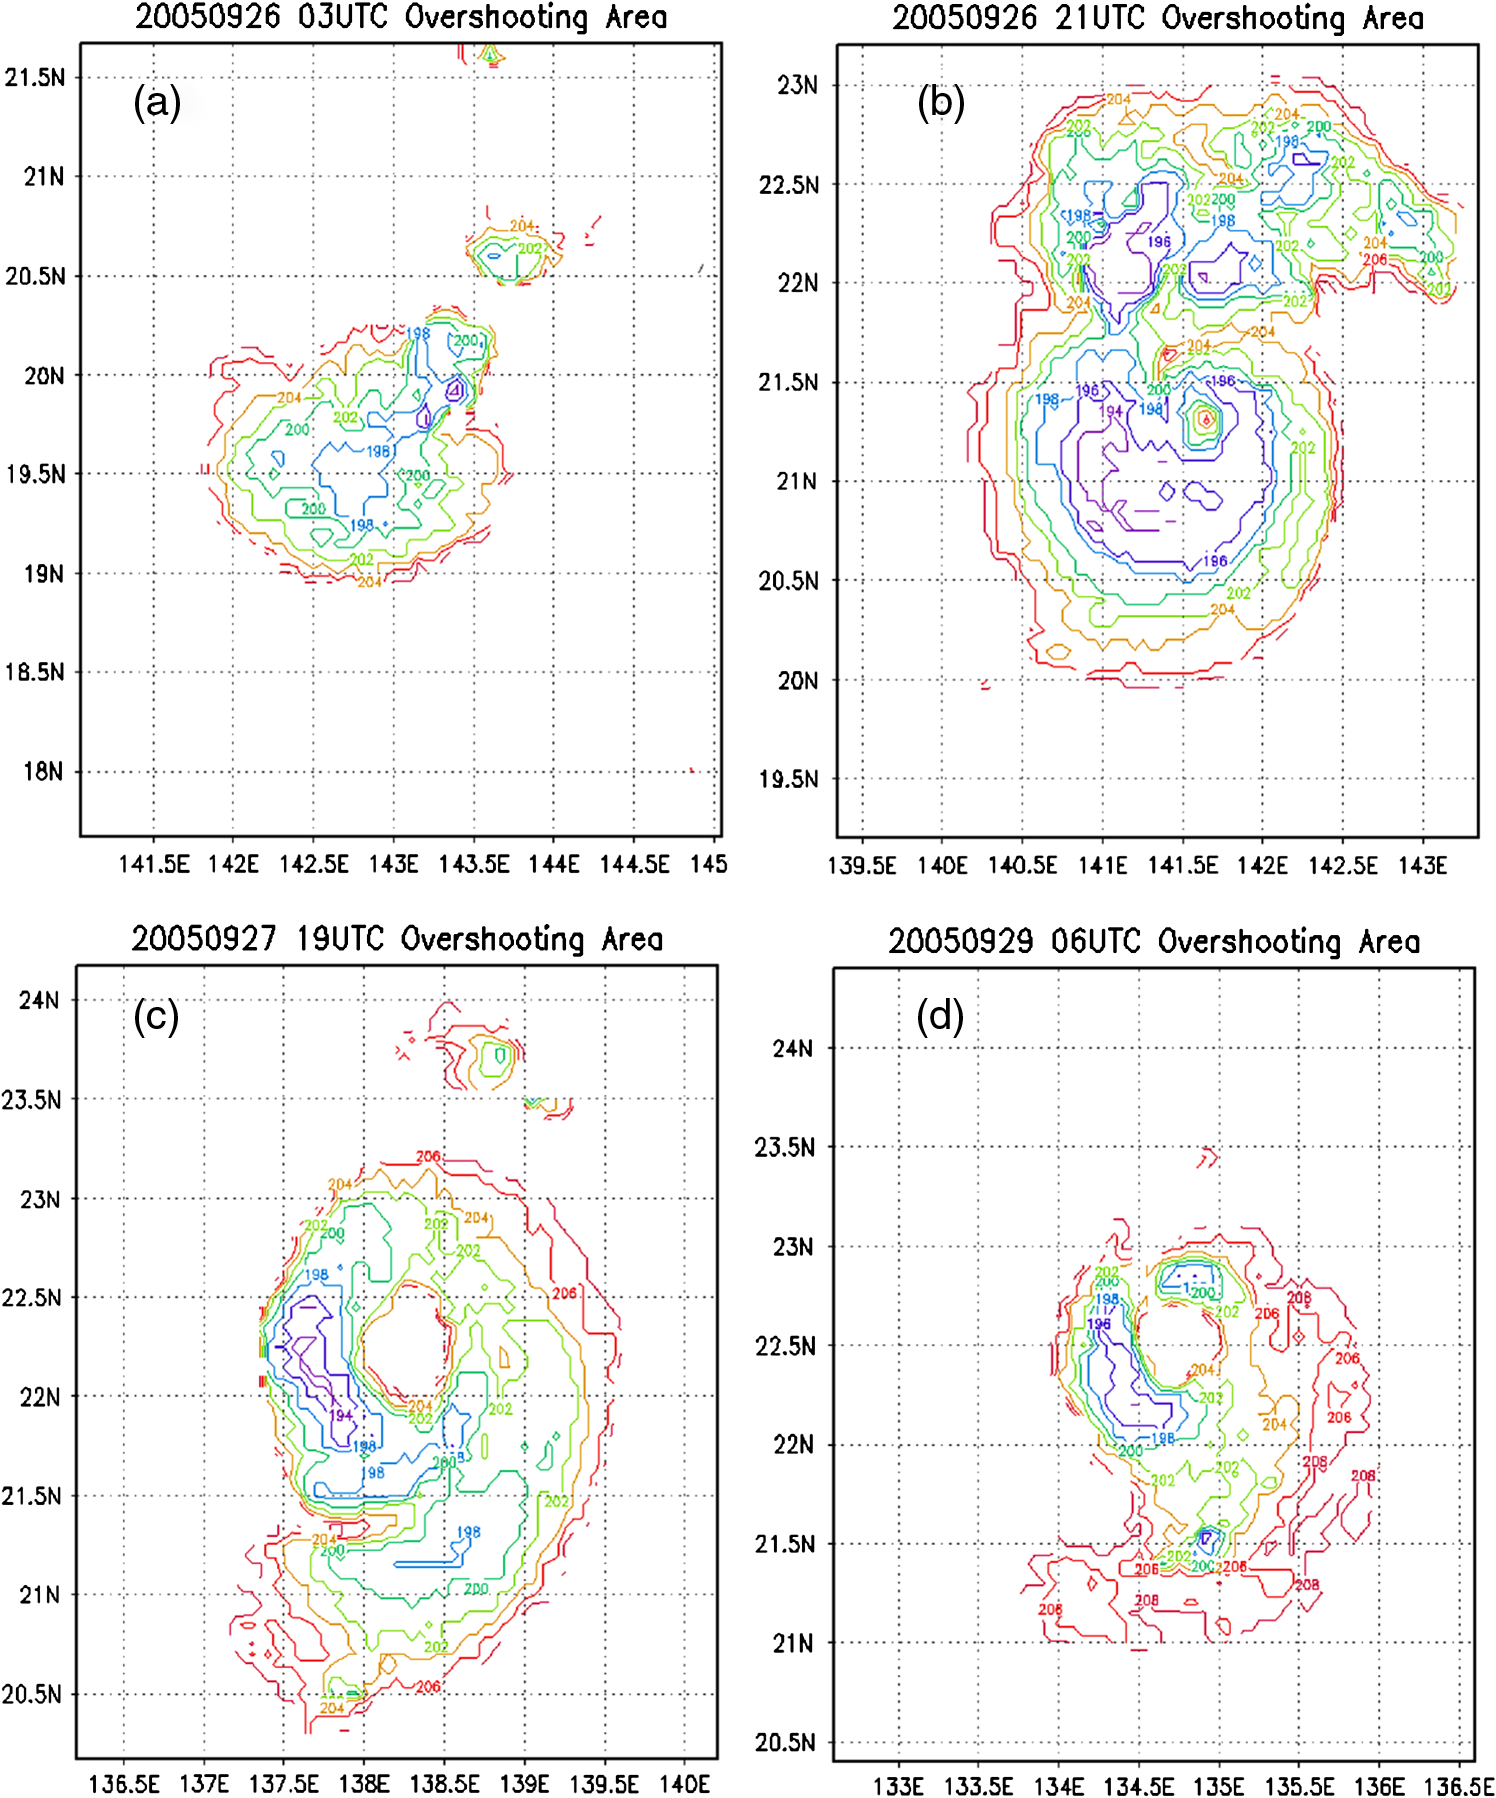 In order to find out if it was possible to identify overshooting areas in a typhoon circulation using NDCI, this study performed not only a cross-section analysis in a way similar to the method adopted by Olander and Velden,14 but also a two-dimensional NDCI analysis within the range of the 500 km radius around the center of the typhoon (as shown in Fig. 8). It was found that the areas with an NDCI value were similar to the overshooting areas (shown in Fig. 7). Figure 9 is the scatter plot analysis with all the numbers of pixels with an NDCI value and those with the IR1 TB values between 192.8 and 208.8 K during Typhoon Longwang’s lifespan. As shown in the figure, the areas with the NDCI value were highly related to the overshooting areas. The relationship between the counts of NDCI () and overshooting () was also shown in Table 3. Two measures were computed for categorical verification data. The first one is called the probability of detection (POD). The POD is simply the fraction of those occasions when overshooting events () occurred in which NDCI () also occurred. The other one is the false alarm rate (FAR), the proportion of the NDCI () events that failed to materialize (overshooting events). As seen from Table 3, of the overshooting events were determined by the NDCI index (), and of nonovershooting events were misjudged (). Thus, the NDCI could be used to identify the distribution of deep convective cloud systems. NDCI values indicated the presence of vigorous convection. Fig. 8The distribution of the NDCI values within the range of a 500 km radius around the center of Typhoon Longwang (the areas marked in purple were areas with the NDCI value ) at (a) 03:00 UTC on September 26 (mild-strength stage), (b) 2100 UTC on September 26 (moderate-strength stage), and (c) 19:00 UTC on September 27 (severe-strength stage).  Fig. 9The scatter plot of the counts of pixels of the areas with all the hourly NDCI values and IR1 TB values between 192.8 and 208.8 K within the range of a 500 km radius around the center of Typhoon Longwang during the life period of the typhoon.  Table 3The 2×2 categorical verification data of normalized difference convection index (NDCI) (<−0.1) and overshooting (192.8<IR1−water vapor≤208.8) during the life period of Typhoon Longwang (2005).
The intensity of a typhoon changes with its cloud system structure and the thermodynamic and dynamic conditions in the environment. Generally, it has been believed that the latent heat release plays an important role in the development of a typhoon.35–38 Some works have depicted a convective ring model of tropical cyclone intensification that suggests that intensification and contraction of the radius of maximum winds occur simultaneously or contraction occurs just prior to intensification.41–43 In this paradigm, eyewall heating leads to both contraction and spin-up through radial advection of absolute angular momentum. These important collective effects of the rotating deep convection that drive the spin-up process have also been stressed in recent research.44–47 When Typhoon Longwang turned into a severe typhoon from a moderate one [as shown in Figs. 7(a) and 7(b)], the overshooting areas expanded gradually. Yet, in the severe typhoon stage [as shown in Figs. 7(c) and 7(d)], the overshooting areas began to reduce. Because the size of the overshooting areas represented the amount of deep convective cloud systems and the amount of latent heat release, it could be inferred based on Fig. 7 that the amount of latent heat release from the convective cloud systems increased gradually during the earlier stage of the development of Typhoon Longwang and the latent heat released from the convective cloud systems may have played an important role in the development of the early stage of the typhoon while the dynamic conditions played a role in the later stage development. This conclusion was similar to the result of the development process of Typhoon Ophelia (2005) obtained by Houze et al.38 The present study also tried to perform an analysis on the relationship between the NDCI values and the maximum sustained wind speed values (as shown in Fig. 10). The result showed that within the range of the 200 to 250 km radius, there was a good relationship between the number of pixels with the NDCI value and the maximum sustained wind speed (correlation coefficient ). Thus, NDCI could be a referential index to determine the intensity of a typhoon during its development. Fig. 10The correlation between the NDCI values and the JTWC’s maximum sustained wind speeds with different radii. 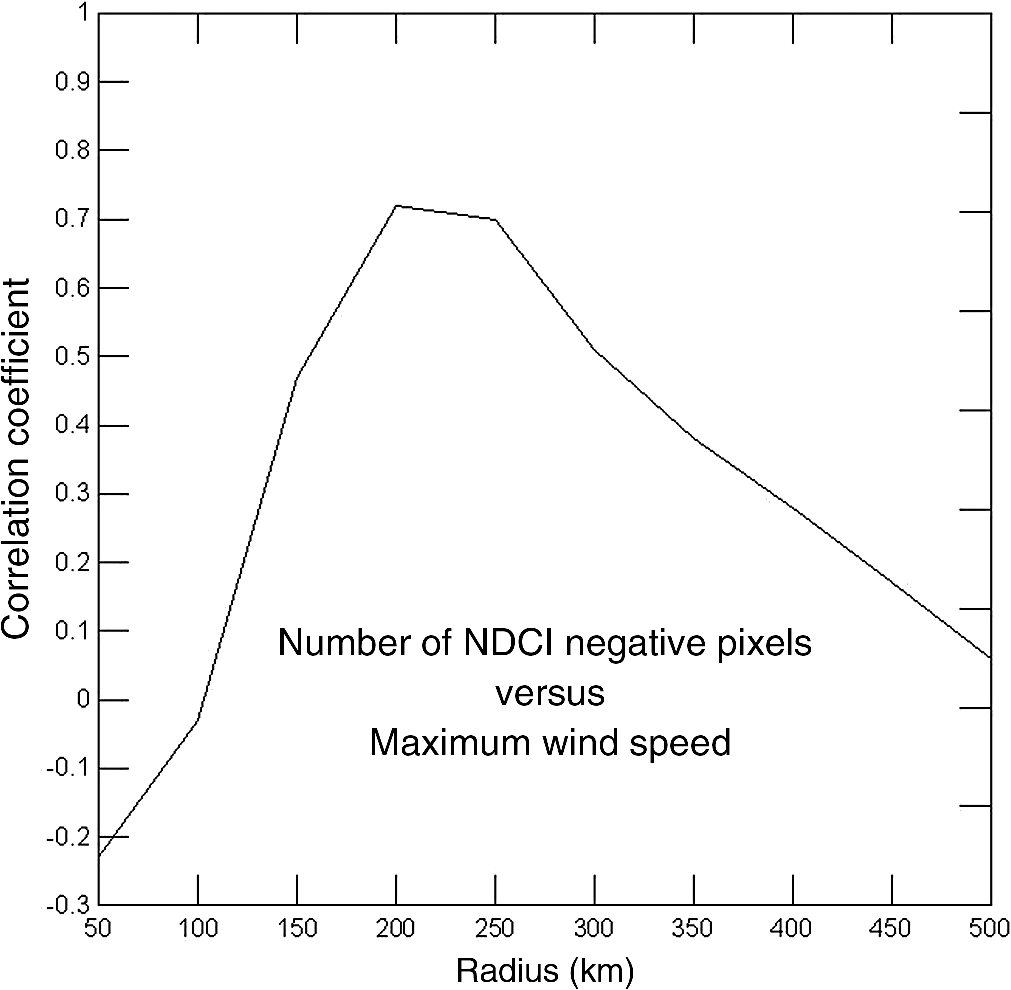 In addition, because NDCI values could be used not only for a cross-section analysis for a specific position but also a two-dimensional analysis, they could be useful to help determine the center of a typhoon. Figure 11 shows the infrared satellite images every 6 h from 00:00 UTC on September 29 to 18:00 UTC on September 30. In these figures, from 18:00 UTC on September 29 to 12:00 UTC on September 30, the eye of the typhoon was covered by anvils or high cirrus layers. It was impossible to clearly identify the center of the typhoon only using the IR1 images. Figure 12 shows the distribution of the NDCI values every 6 h from 00:00 UTC on September 29 to 18:00 UTC on September 30. According to Fig. 12, even though the eye of the typhoon could be clearly seen in the IR1 infrared satellite image (as shown in Fig. 11), the distribution of the NDCI values was a good auxiliary tool for locating the center of the typhoon. Fig. 11The infrared satellite images every 6 h from 00:00 UTC on September 29 to 18:00 UTC on September 30, 2005. 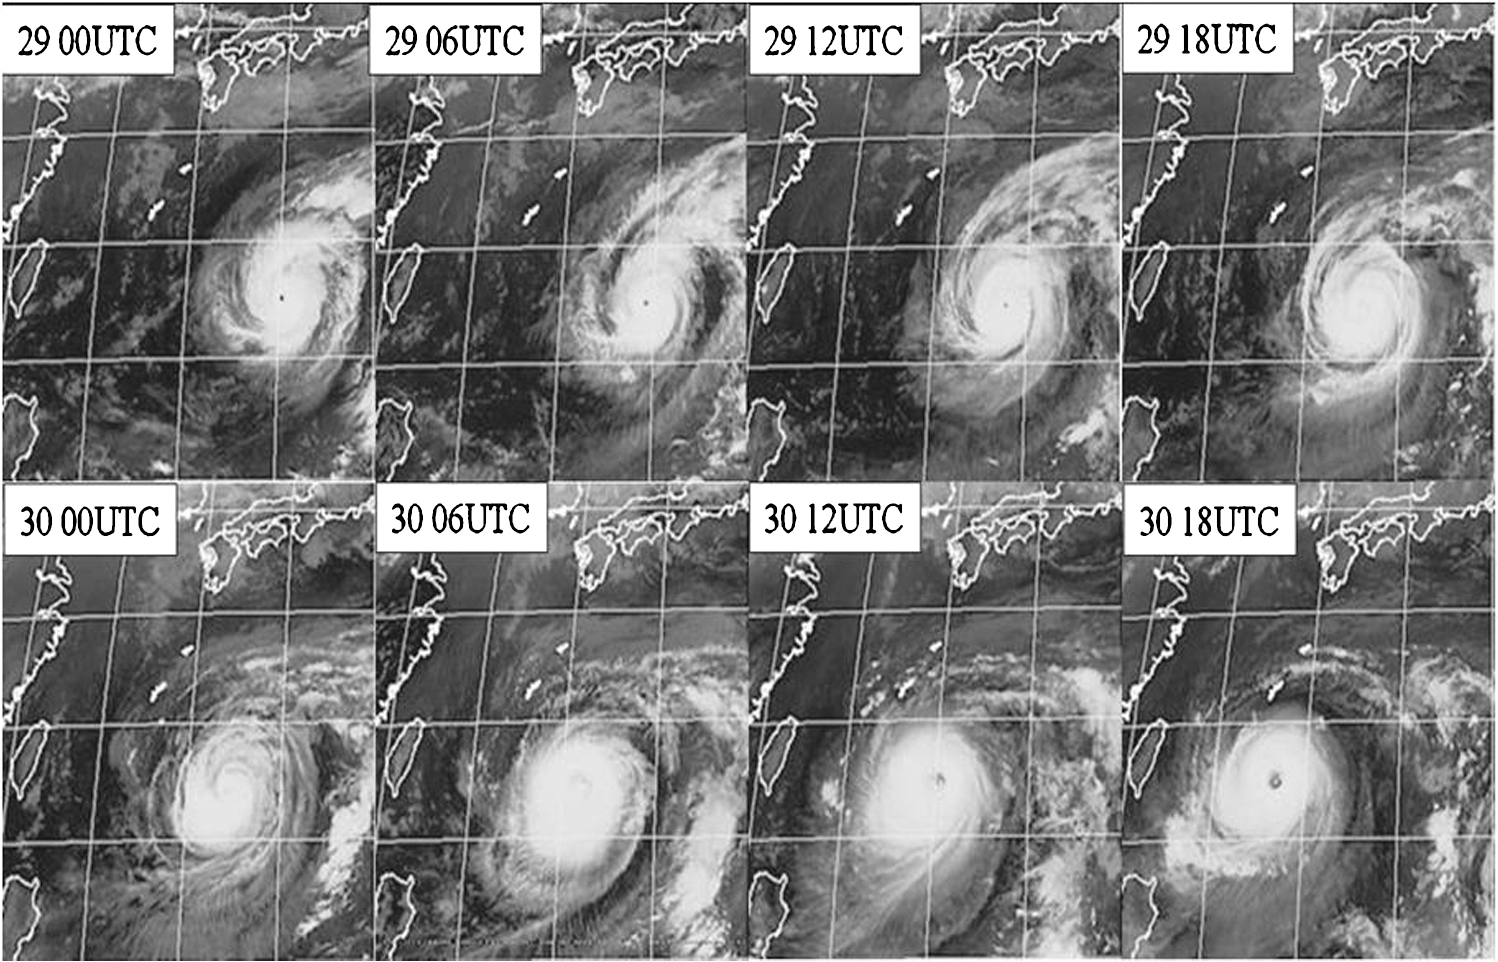 Fig. 12Same as Fig. 11, but for the distribution of the NDCI values within the range of a 500 km radius around the center of Typhoon Longwang (the areas marked in purple were areas with a NDCI value ). 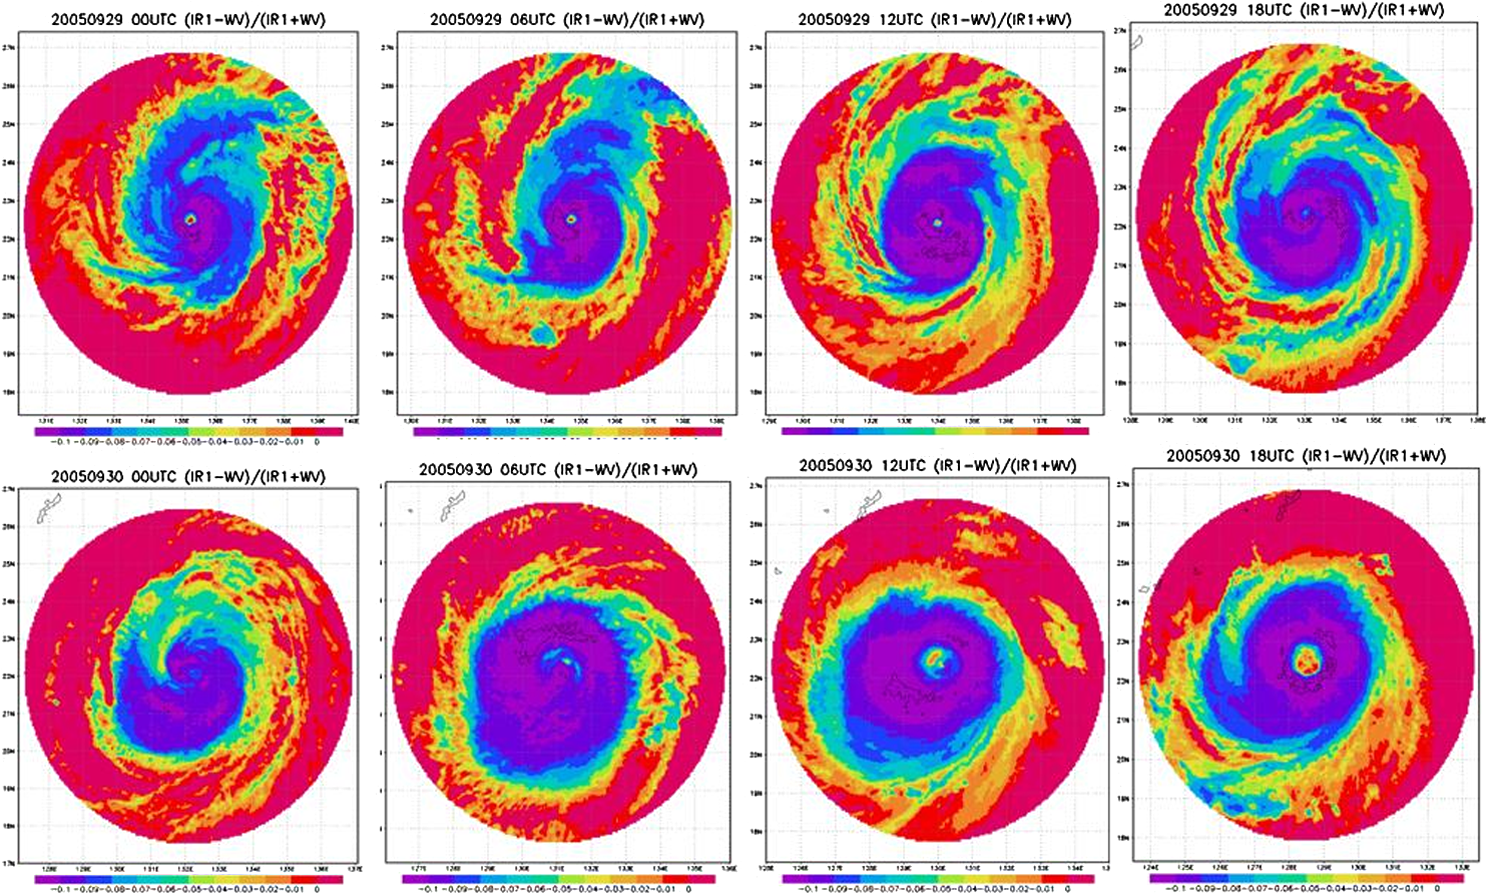 This study conducted analyses on 10 typhoons during 2012 to further demonstrate that NDCI may be applied to determine the positions of the centers (shown in Fig. 1). The wind speed of Typhoon Doksuri (2012) and Typhoon Khanun (2012) reached the mild-strength typhoon stage at 17UTC on June 26 and 11UTC on July 16, respectively. Figure 13 showed the distribution of NDCI values of Typhoon Doksuri and Typhoon Khanun and the interpolated positions of JTWC’s typhoon center at that time. Some typhoons in 2012 (Hawar, Saola, Kaikui, and Prapiroon) reached the wind speed of a moderate-strength typhoon stage, and their distributions of NDCI values as well as the interpolated positions of JTWC’s typhoon center were exhibited in Fig. 14. Figure 15 depicted the distribution of NDCI values of the severe-strength typhoons in 2012 (Guchol, Bolaven, Sanba, and Jelawat) when they reached the wind speed of the severe-strength typhoon stage and their interpolated positions of JTWC’s typhoon center. From Figs. 13–15, it was demonstrated that no matter what the intensity of a typhoon is or whether or not the typhoon eye is formed, NDCI is a good tool to determine the positions of the centers of typhoons. Fig. 13The distribution of the NDCI values and corresponding interpolated positions of JTWC’s typhoon center (black +) of (a) Typhoon Doksuri (2012) at 17:00 UTC on June 26 and (b) Typhoon Khanun (2012) at 11:00 UTC on July 16. 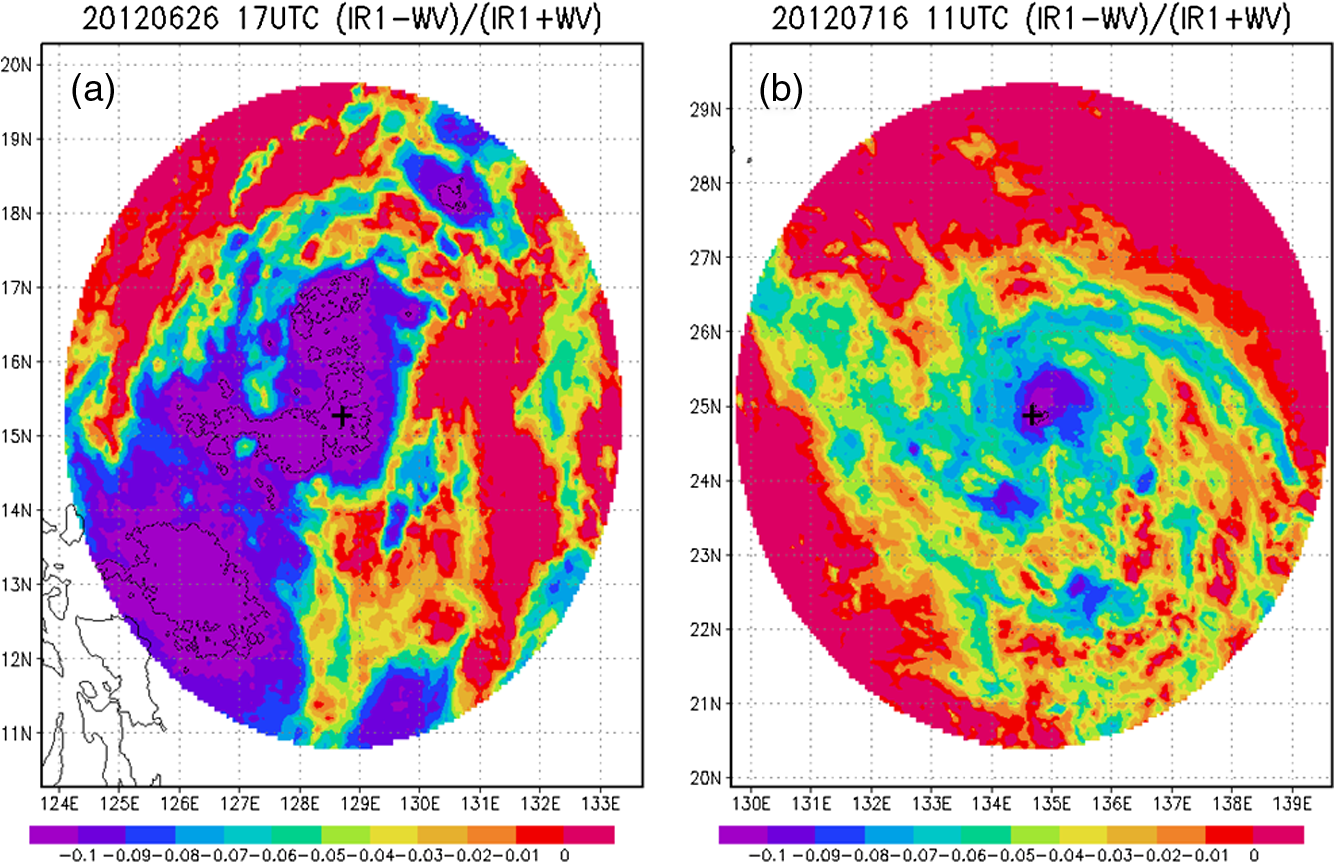 Fig. 14The distribution of the NDCI values and corresponding interpolated positions of JTWC’s typhoon center (black +) of (a) Typhoon Hawar (2012) at 06:00 UTC on June 2; (b) Typhoon Saola (2012) at 12:00 UTC on July 13; (c) Typhoon Haikui (2012) at 12:00 UTC on August 6; and (d)Typhoon Prapiroon (2012) at 06:00 UTC on October 9.  Fig. 15The distribution of the NDCI values and corresponding interpolated positions of JTWC’s typhoon center (black +) of (a) Typhoon Guchol (2012) at 01:00 UTC on June 01; (b) Typhoon Bolaven (2012) at 14:00 UTC on August 14; (c) Typhoon Sanba (2012) at 03:00 UTC on September 13; and (d) Typhoon Jelawat (2012) at 07:00 UTC on October 23.  The average PODs (FARs) of mild-strength typhoons, moderate-strength typhoons, and severe-strength typhoons are 0.78, 0.75, and 0.78 (0.07, 0.16, and 0.04), respectively (shown in Fig. 16). Therefore, it was proved that NDCI is effective in determining overshooting areas in typhoon cloud systems. Furthermore, Fig. 16 also showed the close relationship between the counts of NDCI () and typhoon intensity. The stronger the typhoons are, the larger the NDCI () in the ranges within the circles of 500 km with a typhoon eye as the center. That is, NDCI could be a referential index to determine the intensity of a typhoon during its development. Fig. 16The probability of detection (POD) and false alarm rate (FAR) for the relationship between counts of NDCI () and overshooting () of typhoons shown in Fig. 1 and the relationship between the counts of NDCI () and typhoon intensity. 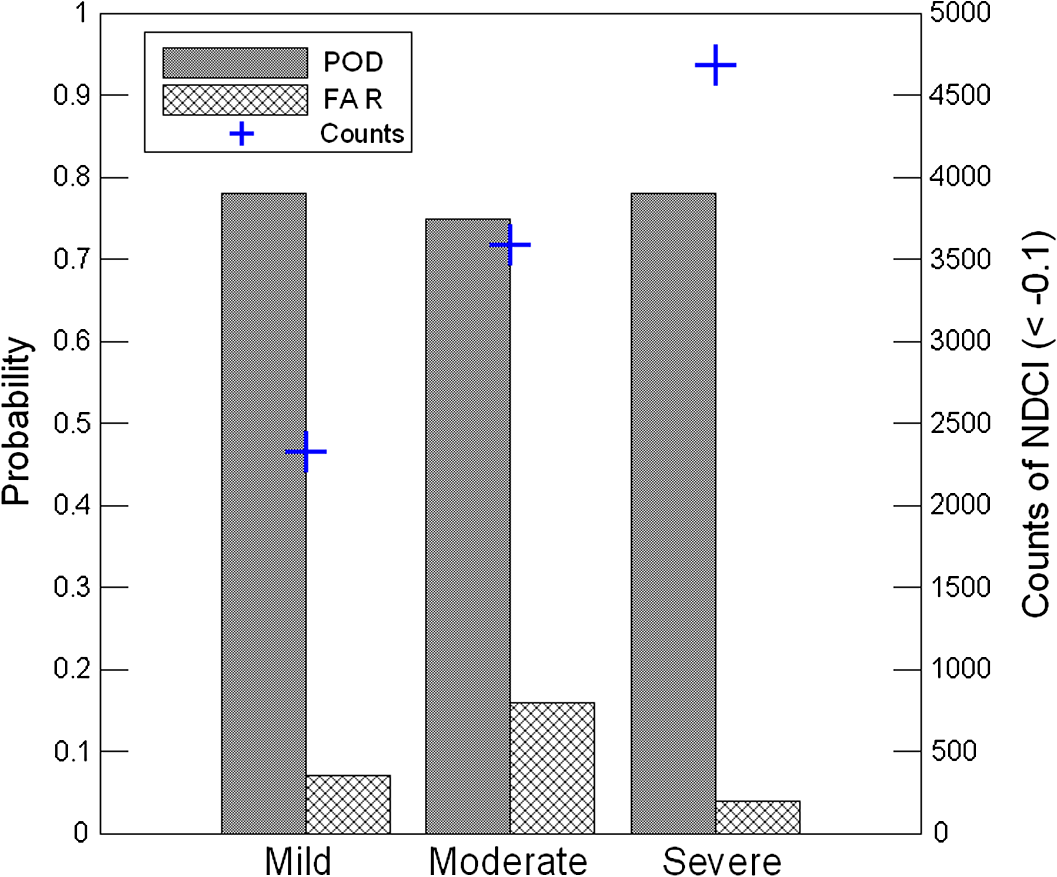 Although the NDCI has the advantages of showing the value range of a relatively concentrated normalized index, an enhanced nonlinear contrast, and opportunities for time-series analyses, the main disadvantage of the NDCI is the inherent nonlinearity of the influence of additive noise effects, such as atmospheric path radiances. The NDCI also exhibits saturated signals. This means that NDCI based on the infrared and water vapor portions of the electromagnetic spectrum approach a saturation level beyond a certain deep convection. 5.ConclusionsIn this study, we used the infrared window and water vapor channel TB values from the geostationary satellite to create a new parameter, NDCI, to determine the overshooting areas in typhoon cloud systems. Then this study discussed the distributions of the convective cloud system of the typhoon based on the NDCI cross-section analysis and the two-dimensional analysis with the NDCI values. The result showed that, according to the two-dimensional NDCI distribution, the areas with the NDCI value were similar to the areas covered by the typhoon cloud systems, while the areas with the NDCI value were similar to the overshooting areas. In addition, because the NDCI values from the satellite images could be used not only for the cross-section analysis of a specific position, but also the two-dimensional analysis, these values could be useful in determining the center of the typhoon. When the eye of the typhoon was formed, the result of the cross-section analysis showed that the NDCI values near the eye increased rapidly. Even though the center of the typhoon was covered by the high anvils and cirrus layers, it could still be found through the two-dimensional analysis of the NDCI values. Thus, NDCI was a good auxiliary tool to find the center of a typhoon. As for how to determine the intensity of a typhoon, this study also tried to use the NDCI values derived from the satellite images and the maximum sustained wind speeds to perform a correlation analysis. The result showed that within the range of a 200 to 250 km radius, there was a good relationship between the number of pixels with an NDCI value and the maximum sustained wind speed. Thus, the NDCI value could be a referential index used to determine a typhoon’s intensity. According to the overall result of this study, NDCI shows promise for the monitoring of the position and intensity of a typhoon and the overshooting areas in circulation cloud systems of the typhoon. Because the geostationary satellite provided a high spatial and temporal resolution, NDCI maps could be derived very easily. We have presented results of the preliminary study on the feasibility of the typhoon characterization using an NDCI index. On the basis of this initial work, we believe that NDCI may be a useful tool with a potential for both quantitative and qualitative typhoon intensity analyses and assessment. This includes the position of a typhoon center and monitoring the deep convection areas in typhoon cloud systems. In the future, we will apply the evaluation of NDCI as a typhoon predicting parameter to more case studies to assess its robustness. AcknowledgmentsThe authors wish to thank the constructive comments and suggestions from the reviewers. This work was supported in part by grants NSC-101-2625-M-159-001 and NSC-102-2625-M-159-001. ReferencesW. M. Gray,
“Hurricanes: their formation, structure and likely role in the tropical circulation,”
Meteorology Over Tropical Oceans, 155
–218 Royal Meteorological Society, Bracknell, Berkshire
(1997). Google Scholar
J. McBride,
“Tropical cyclone formation. A global view of tropical cyclones,”
63
–105 Geneva
(1995). Google Scholar
C. C. Liu et al.,
“Analysis on Typhoon Longwang intensity changes over the ocean via satellite data,”
J. Mar. Sci. Technol., 17
(1), 23
–28
(2009). Google Scholar
R. Spencer and W. D. Braswell,
“Atlantic tropical cyclone monitoring with AMSU-A: estimation of maximum sustained wind speeds,”
Mon. Weather Rev., 129 1518
–1532
(2001). http://dx.doi.org/10.1175/1520-0493(2001)129<1518:ATCMWA>2.0.CO;2 MWREAB 0027-0644 Google Scholar
J. L. Demuth et al.,
“Evaluation of advanced microwave sounding unit tropical-cyclone intensity and size estimation algorithms,”
J. Appl. Meteorol., 43 282
–296
(2004). http://dx.doi.org/10.1175/1520-0450(2004)043<0282:EOAMSU>2.0.CO;2 JAMOAX 0894-8763 Google Scholar
K. Bessho, M. DeMaria and J. A. Knaff,
“Tropical cyclone wind retrievals from the advanced microwave sounder unit (AMSU): application to surface wind analysis,”
J. Appl. Meteor. Climatol., 45 399
–415
(2006). http://dx.doi.org/10.1175/JAM2352.1 1558-8424 Google Scholar
R. L. Bankert and P. M. Tag,
“An automated method to estimate tropical cyclone intensity using SSM/I imagery,”
J. Appl. Meteorol., 41 461
–472
(2002). http://dx.doi.org/10.1175/1520-0450(2002)041<0461:AAMTET>2.0.CO;2 JAMOAX 0894-8763 Google Scholar
J. D. Hawkins et al.,
“Observations of tropical cyclones with the SSMIS,”
IEEE Trans. Geosci. Remote Sens., 46 901
–912
(2008). http://dx.doi.org/10.1109/TGRS.2008.915753 IGRSD2 0196-2892 Google Scholar
S. Hoshino and T. Nakazawa,
“Estimation of tropical cyclone’s intensity using TRMM/TMI brightness temperature data,”
J. Meteorol. Soc. Japan, 85 437
–454
(2007). http://dx.doi.org/10.2151/jmsj.85.437 JMSJAU 0026-1165 Google Scholar
V. F. Dvorak,
“Tropical cyclone intensity analysis and forecasting from imagery,”
Mon. Weather Rev., 103 420
–430
(1975). http://dx.doi.org/10.1175/1520-0493(1975)103<0420:TCIAAF>2.0.CO;2 MWREAB 0027-0644 Google Scholar
V. F. Dvorak,
“Tropical cyclone intensity analysis using satellite data,”
(1984). Google Scholar
T. L. Olander, C. S. Velden and M. A. Turk,
“Development of the advanced objective Dvorak technique (AODT)—current progress and future directions,”
in 25th Conf. on Hurricanes and Tropical Meteorology,
585
–586
(2002). Google Scholar
T. L. Olander and C. S. Velden,
“The advanced Dvorak technique: continued development of an objective scheme to estimate tropical cyclone intensity using geostationary infrared satellite imagery,”
Weather Forecast., 22 287
–298
(2007). http://dx.doi.org/10.1175/WAF975.1 0882-8156 Google Scholar
L. T. Olander and C. S. Velden,
“Tropical cyclone convection and intensity analysis using differenced infrared and water vapor imagery,”
Weather Forecast., 24 1558
–1572
(2009). http://dx.doi.org/10.1175/2009WAF2222284.1 0882-8156 Google Scholar
K. J. Mueller et al.,
“Objective estimation of tropical cyclone wind structure from infrared satellite data,”
Weather Forecast., 21 907
–922
(2006). http://dx.doi.org/10.1175/WAF955.1 0882-8156 Google Scholar
J. P. Kossin et al.,
“Estimating hurricane wind structure in the absence of aircraft reconnaissance,”
Weather Forecast., 22 89
–101
(2007). http://dx.doi.org/10.1175/WAF985.1 0882-8156 Google Scholar
C.-C. Chao, G.-R. Liu and C.-C. Liu,
“Estimation of the upper-layer rotation and maximum wind speed of tropical cyclones via satellite imagery,”
J. Appl. Meteor. Climatol., 50 750
–766
(2011). http://dx.doi.org/10.1175/2010JAMC2519.1 1558-8424 Google Scholar
M. F. Piñeros, E. A. Ritchie and J. S. Tyo,
“Objective measures of tropical cyclone structure and intensity change from remotely sensed infrared image data,”
IEEE Trans. Geosci. Remote Sens., 46 3574
–3580
(2008). http://dx.doi.org/10.1109/TGRS.2008.2000819 IGRSD2 0196-2892 Google Scholar
M. F. Piñeros, E. A. Ritchie and J. S. Tyo,
“Detecting tropical cyclone genesis from remotely-sensed infrared image data,”
IEEE Trans. Geosci. Remote Sens. Lett., 7 826
–830
(2010). http://dx.doi.org/10.1109/LGRS.2010.2048694 IGRSBY 1545-598X Google Scholar
M. F. Piñeros, E. A. Ritchie and J. S. Tyo,
“Estimating tropical cyclone intensity from infrared image data,”
Weather Forecast., 26 690
–698
(2011). http://dx.doi.org/10.1175/WAF-D-10-05062.1 0882-8156 Google Scholar
E. A. Ritchie et al.,
“Tropical cyclone intensity estimation in the North Atlantic Basin using an improved deviation angle variance technique,”
Weather Forecast., 27 1264
–1277
(2012). http://dx.doi.org/10.1175/WAF-D-11-00156.1 0882-8156 Google Scholar
J. W. Rouse et al.,
“Monitoring vegetation systems in the Great Plains with ERTS,”
in Proc. of Third Earth Resources Technology Satellite-1 Symp.,
3010
–3017
(1974). Google Scholar
R. B. Myneni and D. L. Williams,
“On the relationship between FAPAR and NDVI,”
Remote Sens. Environ., 49 200
–211
(1994). http://dx.doi.org/10.1016/0034-4257(94)90016-7 RSEEA7 0034-4257 Google Scholar
S. Gopal, C. E. Woodcock and A. H. Strahler,
“Fuzzy neural network classification of global land cover from a 1° AVHRR data set,”
Remote Sens. Environ., 67 230
–243
(1999). http://dx.doi.org/10.1016/S0034-4257(98)00088-1 RSEEA7 0034-4257 Google Scholar
G. B. Senay and R. L. Elliott,
“Combining AVHRR-NDVI and landuse data to describe temporal and spatial dynamics of vegetation,”
For. Ecol. Manage., 128 83
–91
(2000). http://dx.doi.org/10.1016/S0378-1127(99)00275-3 FECMDW 0378-1127 Google Scholar
P. R. J. North,
“Estimation of fAPAR, LAI, and vegetation fractional cover from ATSR-2 imagery,”
Remote Sens. Environ., 80 114
–121
(2002). http://dx.doi.org/10.1016/S0034-4257(01)00292-9 RSEEA7 0034-4257 Google Scholar
N. Pettorelli et al.,
“Using the satellite-derived NDVI to assess ecological responses to environmental change,”
Trends Ecol. Evol., 20 503
–510
(2005). http://dx.doi.org/10.1016/j.tree.2005.05.011 TREEEQ 0169-5347 Google Scholar
D. O. Fuller,
“Trends in NDVI time-series and their relation to rangeland and crop production in Senegal, 1987–1993,”
Int. J. Remote Sens., 19 2013
–2018
(1998). http://dx.doi.org/10.1080/014311698215135 IJSEDK 0143-1161 Google Scholar
J. Schmetz et al.,
“Monitoring deep convection and convective overshooting with METEOSAT,”
Adv. Space Res., 19 433
–441
(1997). http://dx.doi.org/10.1016/S0273-1177(97)00051-3 ASRSDW 0273-1177 Google Scholar
E.-S. Chung, B.-J. Sohn and J. Schmetz,
“CloudSat shedding new light on high-reaching tropical deep convection observed with Meteosat,”
Geophys. Res. Lett., 35 L02814
(2008). http://dx.doi.org/10.1029/2007GL032516 GPRLAJ 0094-8276 Google Scholar
K. A. Emanuel,
“An air–sea interaction theory for tropical cyclones. Part I: steady-state maintenance,”
J. Atmos. Sci., 43 585
–604
(1986). http://dx.doi.org/10.1175/1520-0469(1986)043<0585:AASITF>2.0.CO;2 JAHSAK 0022-4928 Google Scholar
K. A. Emanuel,
“Sensitivity of tropical cyclones to surface exchange coefficients and a revised steady-state model incorporating eye dynamics,”
J. Atmos. Sci., 52 3969
–3976
(1995). http://dx.doi.org/10.1175/1520-0469(1995)052<3969:SOTCTS>2.0.CO;2 JAHSAK 0022-4928 Google Scholar
L. R. Schade,
“Tropical cyclone intensity and sea surface temperature,”
J. Atmos. Sci., 57 3122
–3130
(2000). http://dx.doi.org/10.1175/1520-0469(2000)057<3122:TCIASS>2.0.CO;2 JAHSAK 0022-4928 Google Scholar
K. A. Emanuel,
“Comment on ‘Sea-surface temperatures and tropical cyclones in the Atlantic basin’ by Patrick J. Michaels, Paul C. Knappenberger, and Robert E. Davis,”
Geophys. Res. Lett., 34
(6), L06702
(2007). http://dx.doi.org/10.1029/2006GL026942 GPRLAJ 0094-8276 Google Scholar
E. A. Hendricks, M. T. Montgomery and C. A. Davis,
“The role of ‘vortical’ hot towers in the formation of tropical cyclone Diana,”
J. Atmos. Sci., 61 1209
–1232
(2004). http://dx.doi.org/10.1175/1520-0469(2004)061<1209:TROVHT>2.0.CO;2 JAHSAK 0022-4928 Google Scholar
M. T. Montgomery et al.,
“A vortical hot tower route to tropical cyclogenesis,”
J. Atmos. Sci., 63 355
–386
(2006). http://dx.doi.org/10.1175/JAS3604.1 JAHSAK 0022-4928 Google Scholar
K. J. Tory, N. E. Davidson and M. T. Montgomery,
“Prediction and diagnosis of tropical cyclone formation in an NWP system. Part III: developing and non-developing storms,”
J. Atmos. Sci., 64 3195
–3213
(2007). http://dx.doi.org/10.1175/JAS4023.1 JAHSAK 0022-4928 Google Scholar
R. A. HouzeJr., W.-C. Lee and M. M. Bell,
“Convective contribution to the genesis of Hurricane Ophelia,”
Mon. Weather Rev., 137 2778
–2800
(2009). http://dx.doi.org/10.1175/2009MWR2727.1 MWREAB 0027-0644 Google Scholar
C. Tao and H. Jiang,
“Global distribution of hot towers in tropical cyclones based on 11-yr TRMM data,”
J. Climate, 26 1371
–1386
(2013). http://dx.doi.org/10.1175/JCLI-D-12-00291.1 JLCLEL 0894-8755 Google Scholar
R. P. Corbell, C. J. Callahan and W. J. Kotch, The GOES/SMS User’s Guide, National Environmental Satellite Service, Suitland, MD
(1976). Google Scholar
L. J. Shapiro and H. E. Willoughby,
“The response of balanced hurricanes to local sources of heat and momentum,”
J. Atmos. Sci., 39 378
–394
(1982). http://dx.doi.org/10.1175/1520-0469(1982)039<0378:TROBHT>2.0.CO;2 JAHSAK 0022-4928 Google Scholar
H. E. Willoughby,
“Temporal changes of the primary circulation in tropical cyclones,”
J. Atmos. Sci., 47 242
–264
(1990). http://dx.doi.org/10.1175/1520-0469(1990)047<0242:TCOTPC>2.0.CO;2 JAHSAK 0022-4928 Google Scholar
D. P. Stern and D. S. Nolan,
“On the vertical decay rate of the maximum tangential winds in tropical cyclones,”
J. Atmos. Sci., 68 2073
–2094
(2011). http://dx.doi.org/10.1175/2011JAS3682.1 JAHSAK 0022-4928 Google Scholar
S. V. Nguyen, R. K. Smith and M. T. Montgomery,
“Tropical cyclone intensification and predictability in three dimensions,”
Q. J. R. Meteorol. Soc., 134 563
–582
(2008). http://dx.doi.org/10.1002/(ISSN)1477-870X QJRMAM 0035-9009 Google Scholar
R. K. Smith, M. T. Montgomery and N. Van Sang,
“Tropical cyclone spin-up revisited,”
Q. J. R. Meteorol. Soc., 135 1321
–1335
(2009). http://dx.doi.org/10.1002/qj.v135:642 QJRMAM 0035-9009 Google Scholar
M. T. Montgomery, S. V. Nguyen and R. K. Smith,
“Do tropical cyclones intensify by WISHE?,”
Q. J. R. Meteorol. Soc., 135 1697
–1714
(2009). http://dx.doi.org/10.1002/qj.v135:644 QJRMAM 0035-9009 Google Scholar
H. H. Bui et al.,
“Balanced and unbalanced aspects of tropical cyclone intensification,”
Q. J. R. Meteorol. Soc., 135 1715
–1731
(2009). http://dx.doi.org/10.1002/qj.v135:644 QJRMAM 0035-9009 Google Scholar
BiographyChung-Chih Liu received his PhD degree from the Institute of Atmospheric Physics and Center for Space and Remote Sensing Research, National Central University (NCU), Taiwan, in 2001. He is an associate professor at the Teaching Center of Natural Science, Minghsin University of Science and Technology, Taiwan. His primary research topics are the utilization of satellite data in remote sensing of the physical properties of the ocean-atmosphere and their applications in weather forecasting. Tian-Yow Shyu received his PhD degree from the Department of Geography, Chinese Culture University. His primary research topics are satellite metrology and weather analysis. Tang-Huang Lin received his PhD degree from the Institute of Space Science, National Central University, Taiwan, in 2001. He has been an associate professor at National Central University since 2006. His research interests include the detection/monitoring of dust storms, biomass burning and anthropogenic pollutants, aerosol mixing effects, and atmospheric environment (air quality) by means of remote sensing, as well as the drought and rainfall with air-sea parameters with satellite observations and ground-based measurements. Chian-Yi Liu received his PhD degree from the Department of Atmospheric and Oceanic Sciences, University of Wisconsin–Madison, United States. He is currently an assistant professor at National Central University. His current research includes meteorological satellite remote sensing and high-impact weather remote sensing. He also is interested in the applications of using satellite data in numerical weather prediction through data assimilation technique. He works on the cloud microphysical parameter retrievals and their impacts to the environment. |
||||||||||||||||||||||||||||||||||||||||||||||||||||||||||||||