
|
|
1.IntroductionSpeckle denoising for synthetic aperture radar (SAR) images has been a critical and difficult problem for several decades. Current typical denoising approaches can be classified into two categories: temporal domain filtering and transform domain filtering. Representative temporal domain filters include the average filter, median filter, Lee filter,1 maximum a posteriori-class filters,2–4 and so on; and representative transform domain filters include the low-pass filter, wavelet-based filter,5–8 and so on. Due to the high-frequency characteristics of noise and edges which are difficult to distinguish, the overall effect of low-pass filters is not prominent. A wavelet transform, which introduces multiple scale subimages, will improve the filtering effect. Over the last few years, partial differential equation (PDE)-based denoising methodologies9–13 have become an important type of denoising. Typical algorithms include the Perona–Malik (PM) algorithm9 and its variants. The main advantage of these anisotropic diffusion algorithms is to denoise while minimizing the loss of information on the edges which yields satisfactory results. Minimum biased diffusion (MinBAD) is a very useful approach, introduced by Kim et al.14–17 Excellent denoising abilities have been illustrated on artificial scenes and standard test images such as the Lena image. Denoising abilities also fit to optical images very well. However, SAR images have multiplicative noise and a large dynamic range. Denoising is affected by the direct MinBAD method. Additionally, preservation of the means of SAR subimages is very important for applications, such as target detection, classification, and so on. Because the means represent the radiation densities of the scene in SAR images, changing the means affects the results after denoising. Most nonlinear filters, including median filters, MinBAD filters, and so on, will change the energy and the means of subimages while denoising, and the radiation accuracy is affected too. The previously mentioned speckle reducing methods mainly aim to decrease the noise level, which is evaluated by the equivalent number of looks (ENL) and edge preserving ability. We have found that edge preserving and radiation accuracy are more significant than ENL when the ENL is at a high level for actual applications of SAR images. Our aim is to find an approach with good edge and radiation preserving abilities while denoising. This paper develops the MinBAD method for SAR image speckle denoising. The characteristics and postprocessing demands of SAR images are also considered. The improved steps include normalization, homomorphic transform and inverse transform, and average-preserving processing. The paper is organized as follows. In Sec. 2, the classic denoising PDEs models are presented, including PM and MinBAD models. Section 3 introduces the unbiased-average MinBAD approach schemes, and explains the three improved steps and the key numerical time parameters for locally one-dimensional (1-D) methods. In Sec. 4, three evaluation indices including ENL, edge preserving index (EPI), and radiation accuracy error (RAE) are defined. We then present the experimental results for both artificial and real SAR images which validate the performance of the proposed unbiased-average MinBAD speckle denoising approach. Finally, a conclusion is given in Sec. 5. 2.PreliminariesAnisotropic diffusion PDEs have been a popular tool for denoising since the PM model was introduced in 1990.9 In this section, we briefly introduce the simplest linear diffusion PDEs, PM anisotropic diffusion PDEs, and variants, and the MinBAD PDEs with some key parameters. 2.1.Perona–Malik and Its VariantsLinear filtering operators can be expressed by the linear diffusion form where and is the space domain of the image, and is the noised image and the initial diffusion image. Clearly, the average operator satisfies this model. The linear diffusion model unavoidably smears sharp edges embedded in while filtering out noise. To remedy this shortcoming, Perona and Malik allowed the diffusivity coefficient to be adapted to the image itself instead of being prefixed:In general, the desirable diffusivity coefficient must qualitatively attain edge selectivity. That is, is large when is small on intraregions and is large when is large on intraregions or near edges. Then, the following nonlinear diffusion model can be defined by where is the diffusion function, and as . Usually, one of the following expressions may be chosen or where is the threshold of the image gradient magnitude. This traditional anisotropic diffusion approach can filter the additive noise and preserve the edges of the image, but the actual challenge is how to robustly compute the diffusion coefficient or the threshold at the very beginning of the initial value problem if is highly oscillatory. Another challenge is being able to distinguish speckle noises and edges for SAR images.However, Perona and Malik presented an anisotropic diffusion approach, and this nonlinear diffusion model has been recently developed. Speckle reducing anisotropic diffusion13 is a good approach as well. Also, the general adaptive speckle filters such as the Lee filter and Frost filter18 are proven to be some of the forms of the PM model in Ref. 13. 2.2.Minimum Biased Anisotropic Diffusion ApproachIn Refs. 1415.16.–17, Kim et al. presented an anisotropic diffusion model where and is the minimum biased anisotropic diffusion (MinBAD) term, and can be calculated by the following schemes. Given a grid point , let be one of the eight neighboring points. Let where , . Let the above eight differences be ordered as where , represent the eight neighboring points. Then, the essentially minimum-biased finite-difference scheme for at is defined as and the minimum slope (Min-Slope) scheme is defined asThe MinBAD and Min-Slope scheme can be understood as follows: (1) for a flat area inside of the target or the background, the eight differences are very small, and one iteration will keep most of the information; (2) for the edge lines, at least two of the eight differences are very small. Then after one iteration, the edge will preserve; and (3) for single noise points, almost eight differences are sufficiently large, and the noise will be removed quickly after one iteration. The denoising results were excellent after a few iterations. Figure 1 shows one set of results filtered by the MinBAD method. Figures 1(a), 1(c), and 1(e) are images with random pulse additional noise and Figs. 1(b), 1(d), and 1(f) are the corresponding denoised images. In Fig. 1, the peak signal-to-noise ratio (PSNR) is defined as where and are the denoised image pixel and original image pixel at , and and are the image width and height. We can see the MinBAD method can remove noise and preserve the edge well for optical images, especially for high-SNR images.Fig. 1Denoise results by minimum biased diffusion (MinBAD) method: (a) image with 10% additional noise (); (b) denoised image (, three iterations); (c) image with 50% additional noise (); (d) the denoised image (, five iterations); (e) Lena image with 60% additional noise (); and (f) the denoised Lena image (, five iterations).  3.Unbiased-Average Minimum Biased Diffusion ApproachFrom the above filtered images, we can find that the MinBAD approach has excellent denoising ability, and the edge retention is also better. However, if the means of the SAR image blocks change, the radiation resolution and accuracy will change. Our goal is to find a mean-preserving anisotropic diffusion approach for SAR images while denoising. This methodology should retain the radiation relationship between the SAR image and the actual scene. The MinBAD model is also a nonlinear filter. The energy of filtered images is usually not equal to that of the original image. The postapplications of SAR images are mainly based on the image grayscales, which represent the energy of the images. Additionally, the speckle noise is quite different from the general noise of optical images. Based on the basic approach of MinBAD, some improved steps are provided. Figure 2 presents the improved MinBAD denoise scheme. The main improving steps are detailed in the following subsections. 3.1.NormalizationBecause the dynamic range of SAR images is usually very large, in order to improve the denoising approach’s generality, normalization is suggested before filtering processing where is the original image. The superscripts 0 and following here and below represent the discrete time or , where is the iteration time step, and the subscripts normal and ln below following represent the image data in normalization or logarithm scale.3.2.Homomorphic Transformation and Inverse TransformThe speckle noise of SAR images is multiplicative noise, and the general denoising methods are mostly suitable for additional noise. Logarithm calculation on the normalization image will change the multiplicative noise to additional noise. Also, this homomorphic transformation will compress the dynamic range of the SAR image during the filtering process Here, we add 1 to avoid the negative values in the image . Then the denoising processing with the MinBAD approach will be implemented on the image . After the anisotropic diffusion on , the denoised image is defined as . The dataset should be transformed to the original time domain:3.3.Average-Preserving ProcessingPDE-based approaches including anisotropic diffusion methods are usually nonlinear algorithms. Therefore, the energy of the processed image is different from that of the original image. In other words, the grayscale will change after filtering. As we know, the grayscale corresponds to the radar cross section of the scene. Therefore, this filtering process will affect the actual radiometry of the SAR image. These filters are average-biased in some sense. In order to decrease the average difference between the original image and filtered image, a mean adjust processing should be added. A detailed approach is as follows. Before the above normalization and logarithm processing, the mean of the original image is calculated and recorded. After filtering processing and inversion of logarithm and normalization processing, we update the mean to the old one. That is 3.4.Locally One-Dimensional Methods SchemeGenerally, the numerical solutions of PDEs are implemented by the iterations of differential equations where the iteration efficiency and convergence are very important. According the conclusion of Ref. 15, the alternating direction implicit (ADI)19 method was recommended instead of the fractional step20 and additive operator splitting21 methods for the locally 1-D iteration where is the intermediate image. The two operators and are defined as where and are the differential coefficients along with and , respectively.Usually, the smaller the iteration time step , the more accurate the results and the slower the convergence. Sometimes a proper time step is needed and determined by experimenting. Following Wachspress,22 a single frequency parameter and the cyclic parameters of length and are calculated by the following expressions, respectively:15 where , is the length of number of grid points in the -direction, is the diffusion operator matrix and the time step 1 can be chosen during the initial calculation, is determined by the noise level, , , and . For the actual SAR image, we cannot obtain the accurate noise parameters such as SNR; however, is not sensitive to the time step and it can be calculated approximately by the following expression:Then we can obtain the optimum ADI time parameters as follows: The time step calculated by Eq. (22) can be used while the same time step is chosen for Eq. (16), and the different times calculated by Eq. (23) are used for the above equation and the below equation of Eq. (16), respectively. In practice, the iteration of ADI with the above time steps is very fast. Two or three iterations may yield a very small error. 4.Experiments and Analysis4.1.Evaluation IndicesIn order to evaluate the speckle denoising effect, three indices including ENL, EPI, and RAE are defined. ENL is the most common index to describe the noise level for SAR images, and it is defined as where and are the mean and variance of the block image , and is the resultant image after iterations.EPI is used to measure the edge preserving ability. In this paper, the definition is where the subscripts and indicate the row and column numbers of an image pixel, is the original image, and is the resultant image after iterations.Namely, RAE is used to measure the radiation difference between the filtered image and the original image. RAE is defined as where is the original image, and is the result image after iterations.4.2.Results and AnalysisThree datasets including an artificial scene and two real SAR images are utilized in this paper. The artificial image is composed of four distributed blocks with different backscatter coefficients and speckle noise. The first real SAR image is an airborne image from spotlight SAR image with 0.6 m resolution from the UK Defence Evaluation and Research Agency enhanced surveillance radar. The second real SAR image is a highspot SAR image from TerraSAR, whose pixel space is . Figure 3 illustrates the speckle denoising effect via the MinBAD approach and unbiased-average approach for the artificial scene first. This scene includes four distributed targets, whose means are 8, 4, 2, and 1 times the minimum subimages located in the rightdown position. The evaluation indices for four block images are listed in Table 1. Fig. 3Simulation results for artificial scene synthetic aperture radar (SAR) image: (a) original image, (b) filtered image via MinBAD approach, and (c) filtered image via unbiased-average MinBAD approach.  Table 1Denoise evaluation indices for artificial scene.
Note: MinBAD, minimum biased diffusion; ENL, equivalent number of looks; EPI, edge preserving index; and RAE, radiation accuracy error. In Table 1, the means for the original subimages are listed, and the RAEs of the filtered images are listed directly. According to the evaluation indices, we find that the improved approach retains the means for all the gray levels while having good denoising performance. The absolute RAEs of MinBAD are up to 0.390 dB, and those of unbiased-average MinBAD are less than 0.018 dB. In addition, the ENL and EPI indices of the corresponding areas are similar by the two approaches. Comparing to these indices, the excellent RAE is obvious. Furthermore, Fig. 4 illustrates the speckle denoising effect via the MinBAD approach and unbiased-average MinBAD approach for the real airborne SAR image. And the evaluation indices for five blocks of images are listed in Table 2. Fig. 4Simulation results for real SAR image: (a) original image, (b) filtered image via MinBAD approach, and (c) filtered image via unbiased-average MinBAD approach. 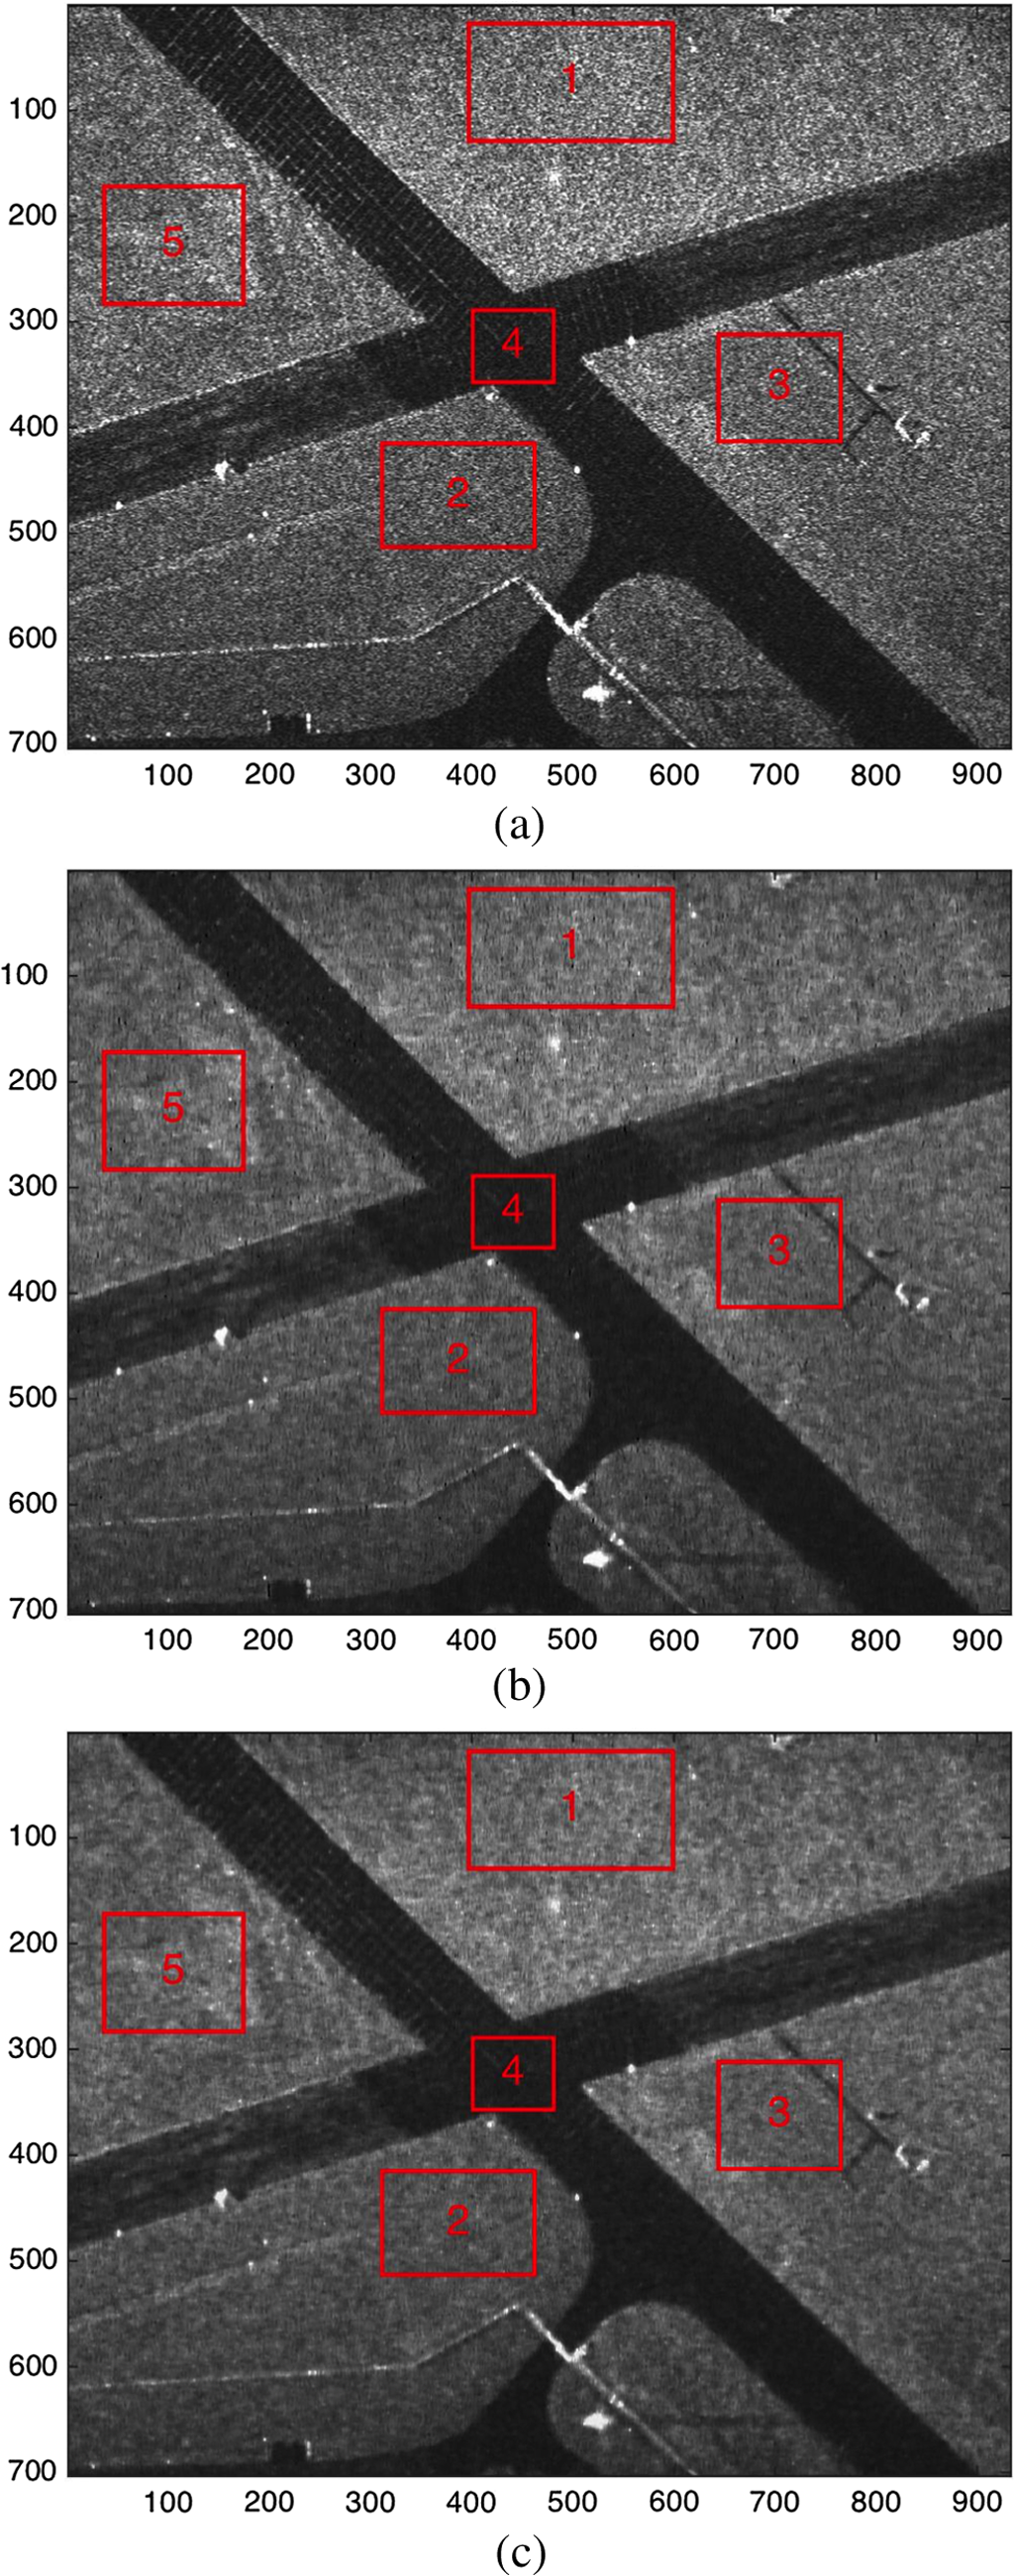 Table 2Denoise evaluation indices for airborne synthetic aperture radar (SAR) image.
According to Table 2, we find a similar phenomenon as the simulated artificial scene. For this SAR image, the values of tested subimages range from 2103 to 19,624. The absolute RAEs of MinBAD are greater than 0.369 dB, and those of unbiased-average MinBAD are no more than 0.157 dB. In other words, the unbiased-average MinBAD approach has perfect applicability for different scenarios in average preserving. This approach could be called an unbiased-average approach. The third experiment illustrates the denoising results on the TerraSAR image in Fig. 5. We also choose five subimages from the image. The evaluation indices for the five blocks of images are listed in Table 3. Fig. 5Simulation results for real TerraSAR image: (a) original image, (b) filtered image via MinBAD approach, and (c) filtered image via unbiased-average MinBAD approach.  Table 3Denoise evaluation indices for TerraSAR image.
According to Table 3, the absolute RAEs of MinBAD are greater than 1.083 dB, and those of unbiased-average MinBAD are no more than 0.267 dB. Additionally, the ENL and EPI indices of our approach are better than those of MinBAD. For all of the above simulations, two iterations and Eq. (23) were implemented, and the ENL indices are sufficiently high for all the subimages. Thus, we find that the proposed approach has perfect efficiency. 5.ConclusionsRadiation accuracy is very important for SAR systems and applications. To find a good edge and radiation preserving approach while denoising SAR images, we proposed an improved unbiased-average MinBAD approach for SAR image speckle denoising from the MinBAD method. Three significant steps including normalization, homomorphic transform and inverse transform, and the average-preserving processing are introduced in the unbiased-average MinBAD methods. Also, the RAE index is defined to evaluate average preserving while ENL and EPI are analyzed for speckle denoising. Simulation results demonstrate the effectiveness of the proposed approach for different scenes and different grayscales. The performance of RAE via the unbiased-average MinBAD approach is much better than that of MinBAD. AcknowledgmentsThe authors thank Lgence Ltd.’s real spotlight SAR images and Airbus Defense and Space for the highspot TerraSAR image. This work is supported by the National Science Fund of China (61301187 and 61328103). ReferencesJ.-S. Lee,
“Digital image enhancement and noise filtering by use of local statistics,”
IEEE Trans. Pattern Anal. Mach. Intell., 2
(2), 165
–168
(1980). http://dx.doi.org/10.1109/TPAMI.1980.4766994 ITPIDJ 0162-8828 Google Scholar
C. Li et al.,
“Speckle reduction for high resolution one-look space borne SAR images,”
Acta Electron. Sin., 28
(3), 13
–16
(2000). http://dx.doi.org/10.3321/j.issn:0372-2112.2000.03.004 TTHPAG 0372-2112 Google Scholar
A. Baraldi and F. Parmiggiani,
“A refined gamma map SAR speckle filter with improved geometrical adaptivity,”
IEEE Trans. Geosci. Remote Sens., 33
(5), 1245
–1257
(1995). http://dx.doi.org/10.1109/36.469489 IGRSD2 0196-2892 Google Scholar
S. Foucher, G. Benie and J. M. Boucher,
“Multiscale map filtering of SAR images,”
IEEE Trans. Image Process., 10
(1), 49
–60
(2001). http://dx.doi.org/10.1109/83.892442 IIPRE4 1057-7149 Google Scholar
M. Simard et al.,
“Analysis of speckle noise contribution on wavelet decomposition of SAR images,”
IEEE Trans. Geosci. Remote Sens., 36
(6), 1953
–1962
(1998). http://dx.doi.org/10.1109/36.729367 IGRSD2 0196-2892 Google Scholar
F. Argenti and L. Alparone,
“Speckle removal from SAR images in the undecimated wavelet domain,”
IEEE Trans. Geosci. Remote Sens., 40
(11), 2363
–2374
(2002). http://dx.doi.org/10.1109/TGRS.2002.805083 IGRSD2 0196-2892 Google Scholar
H. Xie, L. E. Pierce and F. T. Ulaby,
“SAR speckle reduction using wavelet denoising and Markov random field modeling,”
IEEE Trans. Geosci. Remote Sens., 40
(10), 2196
–2212
(2002). http://dx.doi.org/10.1109/TGRS.2002.802473 IGRSD2 0196-2892 Google Scholar
T. Chan and J. Shen, Image Processing and Analysis: Variational, PDE, Wavelet, and Stochastic Methods, SIAM, Philadelphia, Pennsylvania
(2005). Google Scholar
P. Perona and J. Malik,
“Scale-space and edge detection using anisotropic diffusion,”
IEEE Trans. Pattern Anal. Mach. Intell., 12
(7), 629
–639
(1990). http://dx.doi.org/10.1109/34.56205 ITPIDJ 0162-8828 Google Scholar
P. Perona, T. Shiota and J. Malik,
“Anisotropic diffusion,”
Geometry-Driven Diffusion in Computer Vision, 73
–92 Springer, Utrecht, The Netherlands
(1994). Google Scholar
J. Weickert, Anisotropic Diffusion in Image Processing, B. G. Teubner, Stuttgart, Germany
(1998). Google Scholar
Y. Chen, C. A. Z. Barcelos and B. A. Mair,
“Smoothing and edge detection by time-varying coupled nonlinear diffusion equations,”
Comput. Vision Image Understanding, 82
(2), 85
–100
(2001). http://dx.doi.org/10.1006/cviu.2001.0903 CVIUF4 1077-3142 Google Scholar
Y. Yu and S. T. Acton,
“Speckle reducing anisotropic diffusion,”
IEEE Trans. Image Process., 11
(11), 1260
–1270
(2002). http://dx.doi.org/10.1109/TIP.2002.804276 IIPRE4 1057-7149 Google Scholar
S. Kim, I. E. Iacob and M. Tynan,
“Minbad: the minimum-biased anisotropic diffusion for noise removal,”
(2002). Google Scholar
K. Joo and S. Kim,
“PDE-based image restoration, I: antistaircasing and anti-diffusion,”
(2003). Google Scholar
K. Joo and S. Kim,
“PDE-based image restoration, II: numerical schemes and color image denoising,”
(2003). Google Scholar
S. Kim,
“PDE-based image restoration: a hybrid model and color image denoising,”
IEEE Trans. Image Process., 15
(5), 1163
–1170
(2006). http://dx.doi.org/10.1109/TIP.2005.864184 IIPRE4 1057-7149 Google Scholar
V. S. Frost et al.,
“A model for radar images and its application to adaptive digital filtering of multiplicative noise,”
IEEE Trans. Pattern Anal. Mach. Intell., 4
(2), 157
–166
(1982). Google Scholar
J. DouglasJr.,
“On the numerical integration of implicit methods,”
J. Soc. Ind. Appl. Math., 3
(1), 42
–65
(1955). http://dx.doi.org/10.1137/0103004 JSIMAV 0368-4245 Google Scholar
E. D’yakonov,
“Difference schemes with split operators for multidimensional unsteady problems (English translation),”
USSR Comp. Math., 3 581
–607
(1963). http://dx.doi.org/10.1016/0041-5553(63)90531-7 0041-5553 Google Scholar
J. Weickert, B. T. H. Romeny and M. A. Viergever,
“Efficient and reliable schemes for nonlinear diffusion filtering,”
IEEE Trans. Image Process., 7
(3), 398
–410
(1998). http://dx.doi.org/10.1109/83.661190 IIPRE4 1057-7149 Google Scholar
E. L. Wachspress,
“Optimum alternating-direction-implicit iteration parameters for a model problem,”
J. Soc. Ind. Appl. Math., 10
(2), 339
–350
(1962). http://dx.doi.org/10.1137/0110025 JSIMAV 0368-4245 Google Scholar
BiographyBing Sun received his BS and PhD degrees from Beihang University, China, in 2003 and 2008, respectively. He was a postdoctorate after 2008. Currently, he has been with the School of Electronics and Information Engineering, Beihang University, since 2010. From November 2013 to November 2014, he was a visiting scholar in the Department of Mathematics, University of Texas-Pan American. His current activities are synthetic aperture radar system design, imaging algorithm, and image processing. Jie Chen received his BS and PhD degrees in information and communication engineering from Beihang University, China, in 1996 and 2002, respectively. From 2009 to 2010, he was a visiting researcher with the School of Mathematics and Statistics, University of Sheffield, United Kingdom. Currently, he is with the School of Electronics and Information Engineering, Beihang University, where he has been a full professor since 2011. His current research interests include data fusion, topside ionosphere exploration, and so on. Eric Tovar received his BS degree in applied mathematics at the University of Texas-Pan American in 2013. He has been an MS student in the Department of Mathematics at the University of Texas-Pan American since 2013. His current research interest is nonlinear partial differential equations. Zhijun Qiao received his PhD degree in applied mathematics from the Institute of Mathematics, Fudan University, China, in 1997. From 1999 to 2001, he was a Humboldt research fellow at the University of Kassel, Germany. From 2001 to 2004, he was a researcher in Los Alamos National Laboratory. Currently, he is with the Department of Mathematics, University of Texas-Pan American. His research interests include nonlinear partial differential equations and their application in radar imaging. |
|||||||||||||||||||||||||||||||||||||||||||||||||||||||||||||||||||||||||||||||||||||||||||||||||||||||||||||||||||||||||||||||||||||||||||||||||||||||||||||||||||||||||||||||||||||||||||||||||||||


