
|
|
1.IntroductionAerosol particles play an important role in atmospheric processes affecting climate, air quality, rain formation, biogeochemical cycles, representing a challenging subject of analysis in climate research, weather forecast, and, in particular, in the remote sensing retrieval of surface properties. Among the various aerosol types, mineral dust can be considered one of the major sources of tropospheric aerosol loading, and it has been extensively studied for its impact on the radiative balance by the absorption and scattering of sunlight1,2 and on the hydrological cycle by means of their role as cloud condensation nuclei.3 The optical and physical properties of dust aerosol depend on the different sources and the changes they undergo to during their transport in the atmosphere. Dust aerosols are blown into the atmosphere mainly from arid regions and are subject to long-range transport at an intercontinental scale. Among the main dust transport patterns, it is worth mentioning those from North Africa over the Atlantic Ocean, from Arabian Peninsula toward Arabian Sea and Indian Ocean, and from East Asia over the Pacific Ocean. Concerning the European areas, the major transport patterns of Saharan dust are those originating in the North African toward the Southern European regions.4 Desert dust transport events can also affect air quality and its management. The European Commission (EC) directive of 2008 on “Ambient air quality and cleaner air for Europe”5 allows to subtract the number of occurrences of concentration exceedances above the daily limit of when due to natural source. Thus, an increased attention to monitor the dust transport, also by means of remote sensing,6,7 is hence required. Moreover, the Saharan dust deposition in the oligotrophic Mediterranean Sea is a source of nutrients for phytoplankton due to the presence of trace metal as Fe, Al, and Si.8,9 As a typical feature, due to the presence of iron oxides (hematite) and phosphorus, which mainly in oligotrophic stratified waters could be limiting factors for phytoplankton growth, dust depositing on water surface could affect the abundance of phytoplankton,10 making nutrients available for primary production. Several studies in very low trophic waters also showed summer algal blooms as response to N and P depositions after dust events.11,12 This effect has been successfully investigated using satellite observations in the Mediterranean Sea by Refs. 1314.15.16.–17, which allow a frequent retrieval of water quality parameters and thus analyzing time pattern with a synoptic vision on the entire case study area. Aerosol particles, being both of natural or anthropogenic origin, are characterized by optical properties varying in the spectral range from visible (VIS) to near-infrared (NIR) wavelengths.18–20 Desert dust aerosol displays the strongest absorption features in the ultraviolet (UV) through the VIS wavelengths,18 with respect to other aerosol types. This behavior is due to dust mineralogical composition (mainly hematite and silica) affecting dust radiative properties also in the thermal infrared (IR) spectral region. In particular, the presence of clays and quartz in the mineral composition increases the sensitivity of the IR spectral brightness temperature (BT) to desert dust.19,20 Thus, in order to highlight the presence of desert dust in the atmosphere, the spectral features from the UV to the thermal-IR can be profitably exploited using observations carried out by optical satellite sensors. Among active spaceborne instruments, lidar devoted to aerosols and clouds observation such as Cloud-Aerosol Lidar with Orthogonal Polarization (CALIOP), on board the Cloud-Aerosol Lidar and Infrared Pathfinder Satellite Observations (CALIPSO) satellite, which is a joint program of National Aeronautics and Space Administration/NASA and Centre National d’Etudes Spatiales/CNES, furnishes vertical profile of aerosols and clouds optical properties. Respect to the passive instruments, the main advantages presented by CALIOP are the capability to discriminate between dust and other types of aerosol by means of the depolarization measurements at 532 nm and the possibility to perform measurements both during day and night. However, due to its repetition cycle of 16 days, CALIOP observations are limited in temporal coverage and, then, mainly adopted for a seasonal climatology of the desert aerosol.21 The objectives of this study are twofold. At first, a synergistic use of multispectral remote sensing observation acquired by different satellite passive sensors is applied to detect and track the transport of desert dust toward the Lake Garda area, i.e., the study area located in Northern Italy, and then the effect of the identified dust deposition in the lake is estimated through the monitoring of the trend of chlorophyll-a (chl-a) concentration as proxy of phytoplankton abundance. The first aim is reached by (i) analyzing the brightness temperature differences (BTD) between 8 and channels versus BTD between 11 and channels coming from radiance measured by the EUMETSAT/MSG Spinning Enhanced Visible and Infrared Imager (SEVIRI) with a 15 min repetition cycle; (ii) employing the spectral trend of aerosol optical properties (AOP) retrieved from the observations of NASA/Aura Ozone Monitoring Instrument (OMI) in the spectral range (300 to 500) nm; and (iii) exploiting the high capability of NASA/Terra, Aqua Moderate Resolution Imaging Spectroradiometer (MODIS) to retrieve the dust optical properties in the VIS–NIR spectral range and discriminating the presence of clouds mainly thanks to spectra simultaneously registered in the IR channels. The second aim is reached by processing the ESA/Envisat Medium Resolution Imaging Spectrometer (MERIS) full resolution (FR) level 1 data to retrieve chl-a concentration values, at spatial resolution of 300 m, in the time window of each event analyzed and by completing the analysis with ancillary in situ measurements, which allows validating the actual effect of dust deposition. The synergistic approach adopted in this study is finally analyzed in view of the future European sentinels missions, namely Sentinel 3 and 5P, combined with MTG-I (Imager) and MTG-S (the UV-VIS-NIR Sounder, named UVN, boarding the Sentinel 4), which would be successfully and properly utilized in the next years. 2.Materials and Methods2.1.Study Area and Case Studies SelectionThis study has been focused on Lake Garda but for taking into account desert dust transport events, which are characterized by typical large geographical pattern, in situ data have been collected on a wider area (Fig. 1): from Bormio (46.5°N; 10.4°E) to Modena (44.6°N; 10.9°E), in the north–south direction, and from Ispra (45.8°N; 8.6°E) to Venice (45.4°N; 12.3°E) in west–east direction. Fig. 1The study area. The dark area inside the white box is the Lake Garda. Chl-a was analyzed in the area highlighted in the small red box over the lake (MERIS image). Red symbols indicate AERONET sites; green symbols indicate ARPA Lombardy meteorological stations. 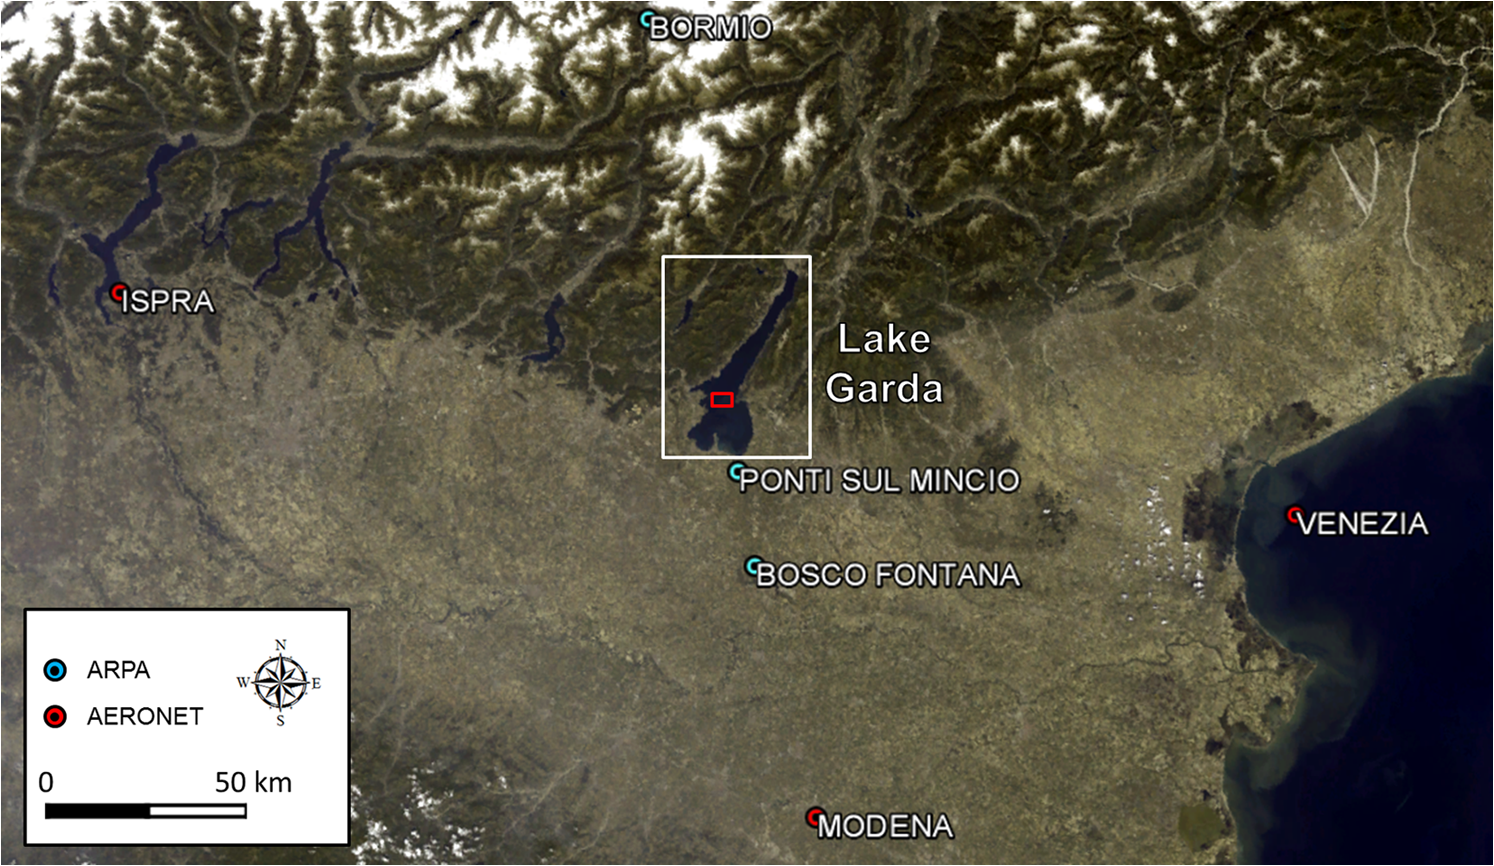 Lake Garda is the largest lake in Italy (), on average 133-m deep, located at 65 m above sea level in the subalpine area in Northern Italy. It is a glacial oligo-mesotrophic oligomictic lake; phosphorus concentration in the epilimnion is comprised between 4 and , chl-a mean concentration22 varies between 0.5 and , and it has a high residence time (26.6 years).23 A strong variability affects chl-a trend during the year; higher values are recorded between the end of the winter and the beginning of spring (and in some cases in autumn), when algal blooms mainly occur, while more stable conditions are recorded in summer season, with lower concentration values.24–26 Complete circulation, which brings up nutrients from the bottom, does not occur every year; during MERIS operational lifetime it was recorded in 2004, 2005, and 2006.27 The four case studies analyzed in this work, parted in dust and no-dust events and also representative of different seasons, are presented in Table 1 together with the corresponding satellite- and ground-based data available. Table 1Case studies in the domain of interest analyzed in this study, parted in “dust” and “no-dust” events, together with satellite- and ground-based observations available in the different seasons/periods. Ispra, Modena, and Venice refer to AERONET sites. For the MERIS/Envisat observations, useful not cloudy days relative to satellite overpass are indicated. In the event (iii) useful MERIS data were not available (see text).
Time series of and (particulate matter with aerodynamic diameter less than 2.5 and , respectively) concentrations were used to single out dust events. In particular, the daily data were sampled in Bormio (alpine site), Bosco Fontana (B. Fontana, rural site), and Ponti sul Mincio (Ponti S.M., urban site). Together with these data, aerosol optical depth (AOD) at 440 nm and Ångström parameter (), calculated between 440 and 870 nm, measured at the AERONET stations in Ispra, Modena, and Venice (Fig. 1) was analyzed to recognize the presence of desert aerosol being representative of the suspended aerosol particles size distribution. Values around or greater than 2 indicate the presence of fine particles, mainly originated by anthropogenic activities and biomass burning, while values lower than or near 1 indicate the presence of coarse particles such as desert dust; intermediate values indicate a mix of both sizes.18 Evidences of desert dust event occurrence were given by the concomitance of high values of daily samplings of (e.g., daily values exceeding the monthly average value added to its corresponding standard deviation), of high values (with the same criteria used for ) of AOD (typically greater than 0.4) as well as by low values of (typically near 1). Table 1 shows the two dust events singled out based on these criteria: event (i) July 27 to July 29, 2005 and event (ii) October 4 to October 10, 2007 as reported in Table 1. On July 28, 2005, doy (day of the year) 209, and in B. Fontana increased reaching the maximum values of 66 and , respectively. Simultaneously, AOD measured in Ispra (Modena, Venise) site was 1.77 (0.53, 0.50), being the relative threshold equal to 0.61 (0.35, 0.38), with a corresponding value of 0.8 (0.95, 1.0). From October 4 to October 10, 2007 (doy from 277 to 283), in Ponti S.M., and increased to 80 and (20% over the relative threshold), respectively, while in Modena (Ispra, Venice) site AOD and were around 1.03 (0.41, 0.59), being the relative thresholds equal to 0.61 (0.35, 0.31) and 0.49 (1.03, 1.10), respectively. In the analysis of the aerosol behavior, also a no-dust event [event (iii) in Table 1] related to June 1 to June 14, 2005 period was analyzed. Beside the absence of transported dust, this event is also characterized by a relatively small presence of anthropogenic pollution. In Ponti S.M., the average over the period for was with a standard deviation equal to about , resulting below the annual mean value of . The mean values of AOD and over the period at Ispra (Modena, Venise) were 0.42 (0.32, 0.28) and 1.59 (1.62, 1.78), respectively. Concerning this no-dust event the analysis of satellite observations has been performed in terms of UV–VIS–NIR AOP, as cloud covers hindered the use of MERIS to investigate the chl-a dynamics. To minimize the risk of erroneous interpretation of the effect of dust on phytoplankton growth, a second no-dust event relative to a period during which AOD and PM concentrations increased due to anthropogenic activities was selected: i.e., event (iv) of Table 1, October 30 to November 30, 2006. In this period, AERONET data were not available for Modena but in Ispra (Venice) site AOD and presented monthly averaged values equal to 0.15 (0.45) and 1.33 (1.56), respectively. Data from Ponti S.M. were not available but in Bormio the average was with standard deviation of . On November 11, 14, 15, 16, 17, 23, 24, and 25, 2006 (doy: 315, 318, 319, 320, 321, 327, 328, 329) concentrations were above the threshold (), being 46, 32, 34, 27, 28, 26, 26, and , respectively. For this reason, analysis on phytoplankton abundance was carried out around this time window. 2.2.Satellite DataDesert dust transport events are very often characterized by very large plumes traceable with Earth Observation (EO) satellites. In this context, EO imagery was used to track Saharan dust plumes traveling toward Italian coasts and up to register the presence of dust over Northern Italy and, in particular, the Lake Garda. For this purpose, in the next sections, we consider data analysis techniques using IR observations coming from EUMETSAT MSG geostationary platform, and UV–VIS–NIR observations coming from daily observations from satellite sensors on board NASA Aura, Aqua, and Terra Sun-synchronous platforms. AOP level 2 data from OMI and MODIS observations have been adopted to highlight the presence of desert dust in the atmospheric column and to derive a level 3 data of satellite-based map of PM concentrations at surface, respectively. 2.2.1.SEVIRI/MSG IR spectra analysisThe detection of desert dust is based on the analysis of the radiance sampled by SEVIRI on board MSG-1 (Meteosat-8) meteorological satellite28 with capability to observe the high temporal frequency and also in the night. IR observations in the atmospheric windows between 8 and have been exploited considering the different spectral trend of desert dust optical properties with respect to those of clouds and in clear conditions (i.e., without the presence of dust or clouds). In particular, BTs are calculated from the SEVIRI level 1.5 data in the 8.7, 10.8, and channels.29 Then, two BTDs are derived as ( to ) and ( to ) enabling the enhancement of the presence of desert dust [Fig. 2(a)]. Fig. 2(a) Brightness temperature differences plot discriminating the presence of desert dust (solid squares in magenta) and (b) composite false color RGB image (see also Sec. 3.1.1), relative to IR SEVIRI observation at 8.7, 10.8, and on July 27, 2005, 01:00 UTC. Data refer to the event (i) in Table 1. 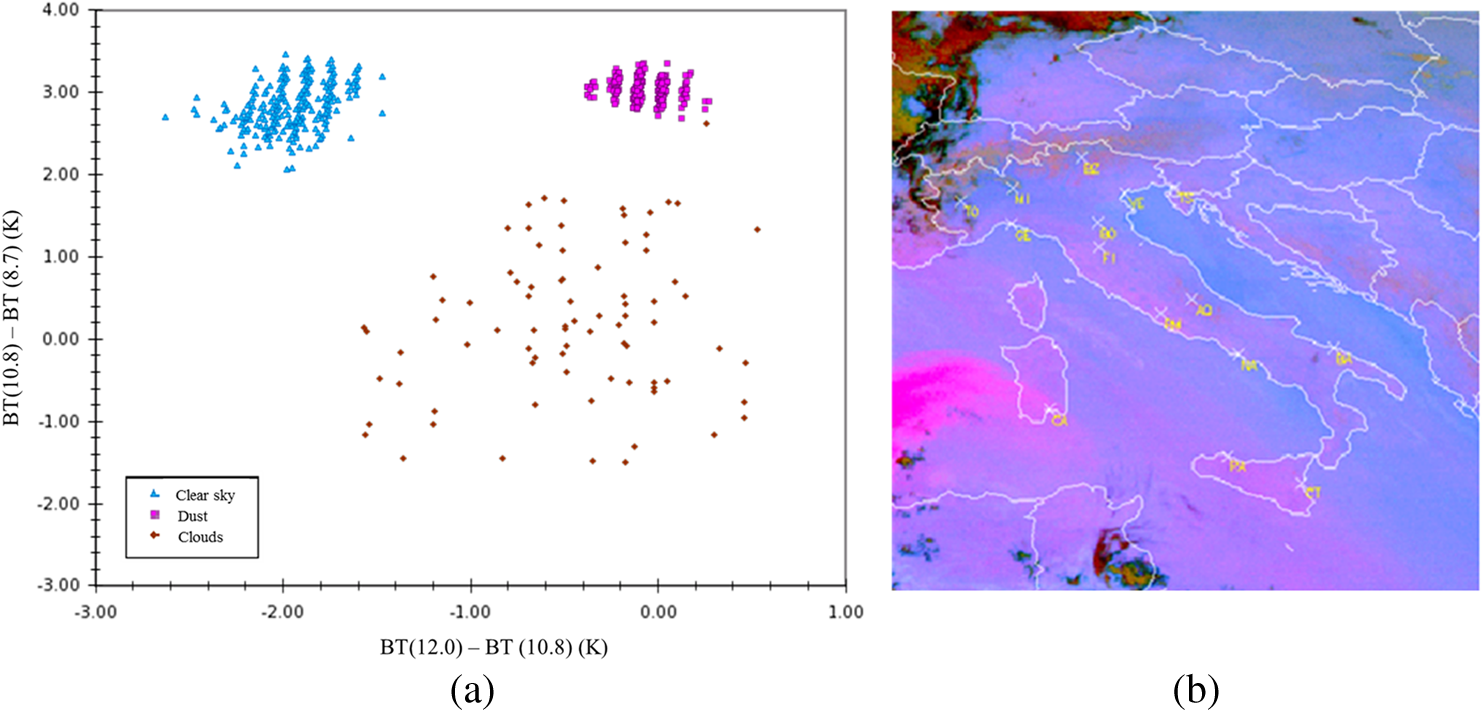 2.2.2.UV–VIS aerosol optical properties and OMI/Aura observationsDesert AOP as single-scattering albedo (SSA) and AOD present spectral trends that can be profitably used to highlight the presence of desert dust.18,19 Within the UV–VIS spectral range, SSA relative to this type of particles increases with wavelength. Accordingly, the absorbing AOD (AAOD) decreases while the extinction AOD (EAOD) typically decreases slowly with respect to the other types of atmospheric aerosols. For seven different types of aerosols, Fig. 3 shows the spectral trend of the SSA and the normalized EAOD, being () the aerosol-specific extinction coefficient derived from the AOP DB of Ref. 30. The aerosol microphysical properties needed to compute the optical properties of selected aerosol types of Fig. 3 are taken from Ref. 19 for the desert CV, urban, and biomass burning aerosols, from Ref. 31 for the desert background (desert back) and desert wind-carry aerosols, and from Ref. 32 for the rural/clean continental and maritime aerosols. As it can be noticed, in Fig. 3(a), excepted for the maritime aerosol, the three desert aerosol types can be discriminated with respect to the other aerosol classes.Fig. 3(a) Spectral trend of normalized extinction aerosol optical depth, Eq. (1) and (b) single-scattering albedo derived from Ref. 30 for three desert dust and for other aerosol types. 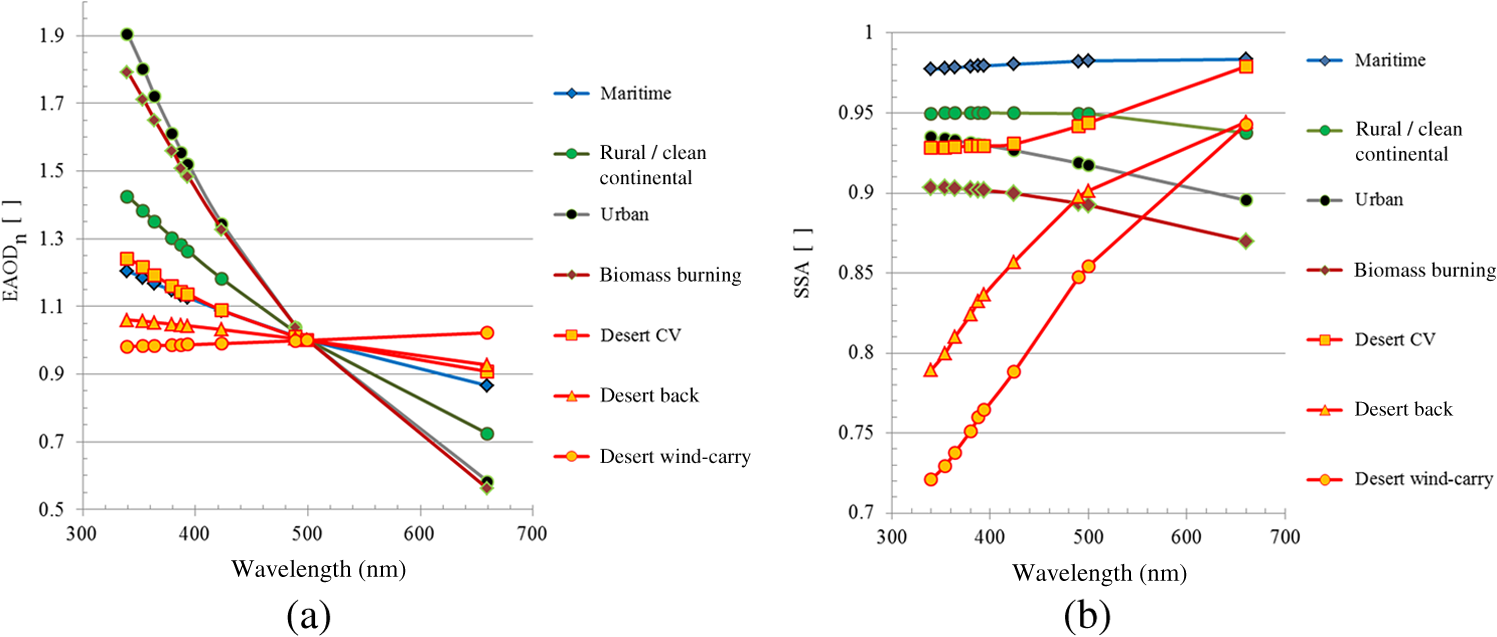 By considering the optical absorbing features [i.e., the SSA plot of Fig. 3(b)], the significant increasing spectral trend of the desert aerosols SSA with respect to the other aerosol types can also confirm the dust presence. UV–VIS spectra registered by OMI sensor onboard the Finnish–Dutch EOS Aura spacecraft are usefully employed. A spectral analysis of the AOP (level 2G gridded data products, OMAERUVG.003) from OMI/Aura data products (15 orbits/day; spatial resolution at nadir) into global grids products have been carried out to recognize the presence of the dust over the study area for the selected periods (cf. Table 1). 2.2.3.MODIS satellite-based PM using VIS–NIR observationsA Northern Italy synoptic view of and concentrations is reconstructed33 from MODIS/Terra and Aqua aerosol level 2 data (C005 collections) at spatial resolution, meteorological mixing layer, relative humidity fields simulated by MM534 model at spatial resolution of , and in situ and as described in Ref. 35. MODIS-based PM data (Fig. 4) are here selected to compute maps of to concentrations ratio averaged over the period of the selected events (Table 1). This ratio assumes typical values around or higher than 0.75 in case of anthropogenic pollution and around or lower than 0.6 in highlighting the presence of coarse particles, such as desert dust aerosol.37 Fig. 42008 yearly average of MODIS-based particulate matter concentrations at surface over Northern Italy: (a) map and (b) map. Reproduced with permission, courtesy of Alessandra Cacciari.36 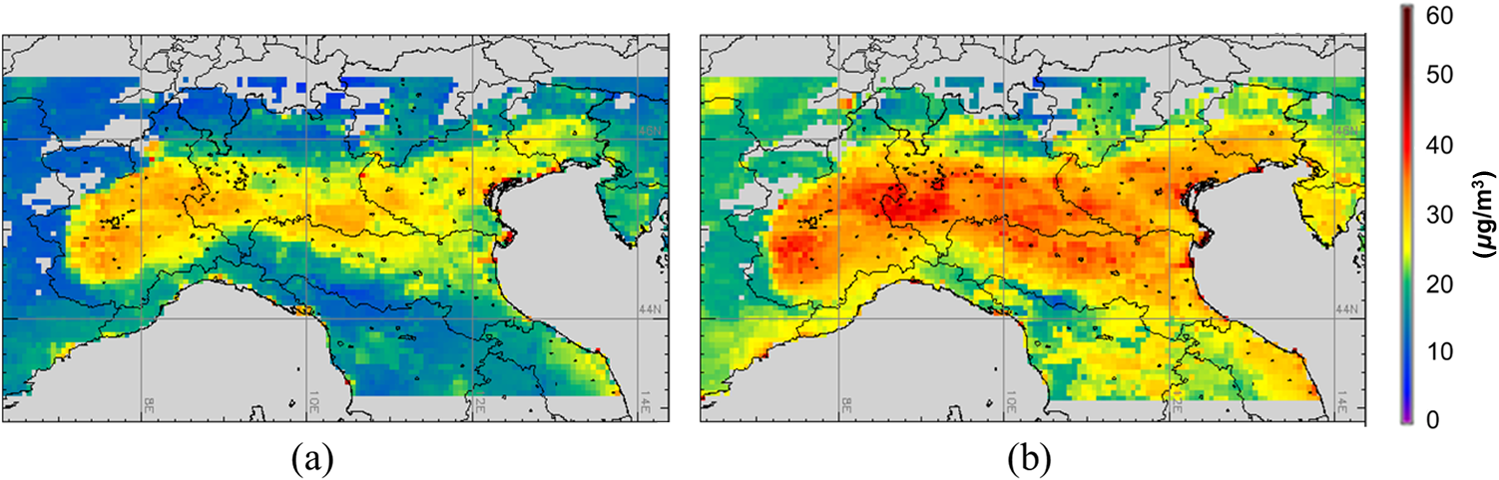 2.2.4.Retrieval of chl-a concentrations from MERIS dataTo assess the effect of dust deposition on Lake Garda waters, 26 MERIS level 1B FR (300 m) images relative to years 2005 to 2007 (Table 1) were used. The images were processed through the ESA-BEAM toolbox, in order to remove radiometric disturbances as well as atmospheric and adjacency effects. In particular, the BEAM Smile correction was applied to all images.38 The Smile corrected images were processed with the BEAM plug-in Improved Contrast between Ocean and Land (ICOL), to remove the adjacency effects of land on water.39 To retrieve chl-a concentrations, the MERIS case 2 water BEAM processor (C2R)40 was used as it was successfully adopted to produce MERIS-derived chl-a concentration in Lake Garda.41,42 MERIS level-1 and C2R level-2 flags were used for excluding pixels with risk of clouds and glint. The trend of chl-a concentration was finally evaluated in a pelagic area (about in Fig. 1) as it is most likely the least affected by residual adjacency effects. 3.Results and Discussion3.1.Detecting Desert Dust and Retrieval of Desert Optical Properties Using Satellite-Based ObservationsIn this section, the results for the four case studies (Sec. 2.1) according to remote sensing techniques presented in Sec. 2.2 are reported. 3.1.1.SEVIRI/MSG dust trackingAs introduced in Sec. 2.2.1, BTDs analysis of the SEVIRI data has been applied to the selected events (Table 1) for tracking and evaluating the origin of the desert dust plume. Sequences of RGB (red, green, blue) composite images (; ; ) are produced using the SEVIRI/MSG BTD at spatial and temporal resolutions of 4 km and 15 min, respectively. SEVIRI BTDs showed a significant transport of dust over the Mediterranean area and toward Italy for the dust events (i) and (ii) (cf. Table 1). In Fig. 2(b) desert dust plume over Mediterranean Sea toward the Italian coasts appears pink or magenta, while thick high-level clouds are red-brown, thin high-level clouds appear very dark, and clear sky pixels are blue.43,44 As the plume approaches Italy and also considering a decrease of particle concentrations during its transport, the dust comes less distinguishable. 3.1.2.Aerosol optical properties derived from OMI and MODIS-based PM2.5 to PM10 ratioFigure 5 presents 3-days averaged maps of three spectral values of AOP relative to the first dust event (cf. Table 1 and Fig. 2). The averaged values of EAOD and SSA are shown at 354, 388, and 500 nm. As typical properties of desert dust aerosol, the increasing spectral trend of SSA values can be clearly recognized in the values presented by the pixels located between the two main islands of Italy (southwestern part of the country). Within the desert plume over the sea, SSA values averaged in the Mediterranean area (from 39.3°N–8.3°E to 37.3°N–13.6°E) turn to be , , and at 354, 388, and 500 nm wavelengths, respectively. Fig. 5UV–VIS desert dust detection over Mediterranean Sea as retrieved from OMI/Aura satellite data processing. All maps show 3-days averaged values from July 27 to July 29, 2005 of (a–c) the extinction AOD (EAOD) and (d–f) single-scattering albedo (SSA) at the wavelengths of (a, d) 354, (b, e) 388, and (c, f) 500 nm.  These SSA values and the corresponding spectral values, calculated averaging over the same Mediterranean area the spectral EAOD (Fig. 5, first row) and using Eq. (1), are plotted in Fig. 6 for a comparison with the relative spectral AOP showed in Fig. 3. It can be noticed that there is very good agreement of the retrieved OMI values (blue square) with respect to the desert background aerosol model (red triangle). Fig. 6Comparison between aerosol models of Fig. 3 (rural/clean continental, urban, desert CV, and desert back) and OMI-retrieved spectral averaged AOP (squared symbols) over Mediterranean (Fig. 5) and over Lake Garda areas (Fig. 7), for the event (i), and for Lake Garda area for events (ii, iii, and iv); (a) spectral trend of and (b) SSA values. Medit-event and LG-event indicate Mediterranean and Lake Garda areas, respectively. 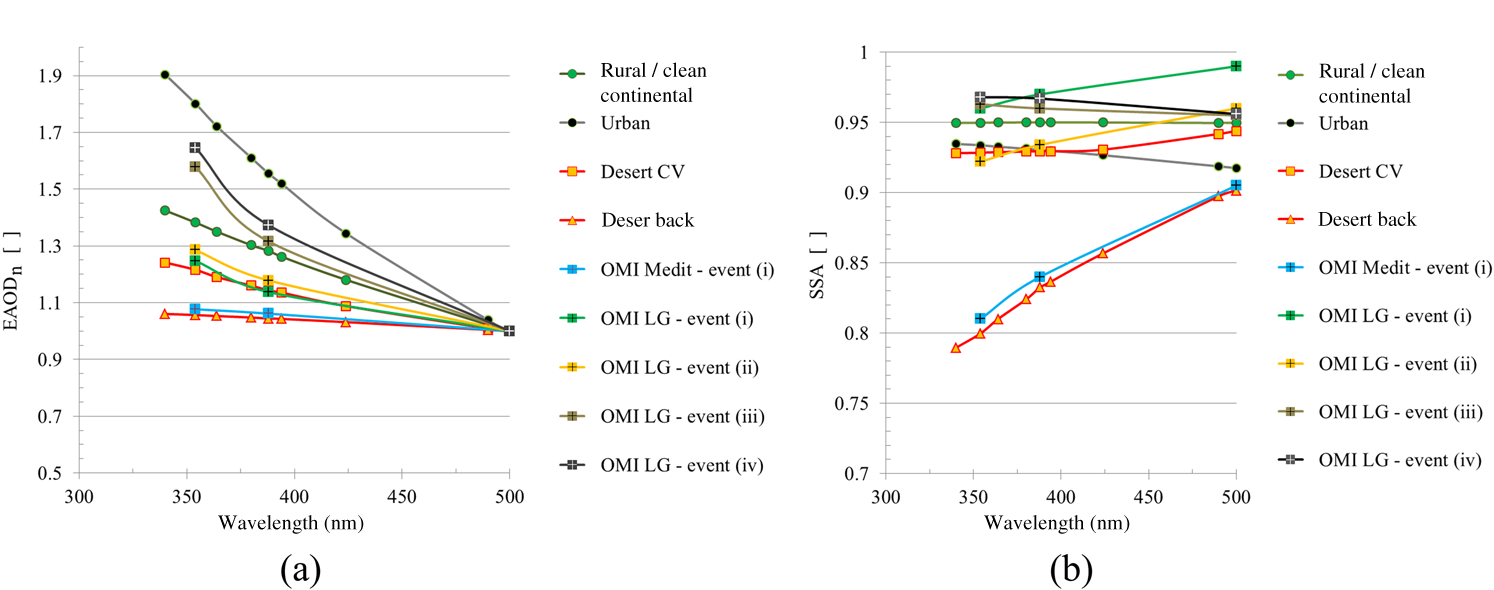 Since the study area is Lake Garda, a zoom in Northern Italy of maps in Fig. 5 is showed in Fig. 7. In the last row of Fig. 7, the OMI SSA of Lake Garda presents averaged values of , , and at 354, 388, and 500 nm, respectively. The mapped AOP spectral values confirm that the desert dust outbreak at the end of July 2005 reached also Northern Italy. These SSA values and the corresponding spectral [Eq. (1)], calculated averaging over the Lake Garda area the spectral EAOD of Fig. 7, are also included in Fig. 6 (squared green symbols) to compare them with the modeled spectral AOP depending on aerosol types rural/clean continental, urban, desert CV, and desert background. Fig. 7Zoom over Northern Italy (Lake Garda area) of the same period of averaged maps presented in Fig 5. (a–c) the extinction AOD (EAOD) and (d–f) SSA at the wavelengths of (a, d) 354, (b, e) 388, and (c, f) 500 nm. Data refer to the dust event (i) of Table 1.  In this event, the spectral trend of retrieved OMI AOP ( and SSA) confirms the presence of a significant component of dust in the study area. Figure 6 shows that the increasing spectral trend of OMI SSA and is very similar to those ones of desert CV aerosol model (square red symbols, yellow filled). Nonetheless, the higher values of retrieved OMI SSA and the slight difference of retrieved with respect to the SSA and values, respectively, of desert CV aerosol type can be justified considering a proper mixing with a more scattering aerosol type as the rural. In particular, for these hydrophilic aerosol particles, high values of the relative humidity also contribute to increase the scattering features of the aerosol particles.45 To provide an exhaustive picture of the desert dust case study, a selection of satellite-based information is presented in Fig. 8. In particular, tropospheric column amount is shown [Fig. 8(a)] as derived from daily OMI data processing46 and averaged over the period of the event (i), July 23 to July 31, 2005. The values highlight a relatively small contribution of human activities to air pollution around the study area. Fig. 8On the top: average of period July 23 to July 31, 2005, dust event (i), of (a) OMI tropospheric concentrations and (b) MODIS-based to ratio values. On the bottom: averaged values for October 4 to October 10, 2007 period, dust event (ii), of (c) OMI tropospheric map and (d) MODIS-based to ratio map. 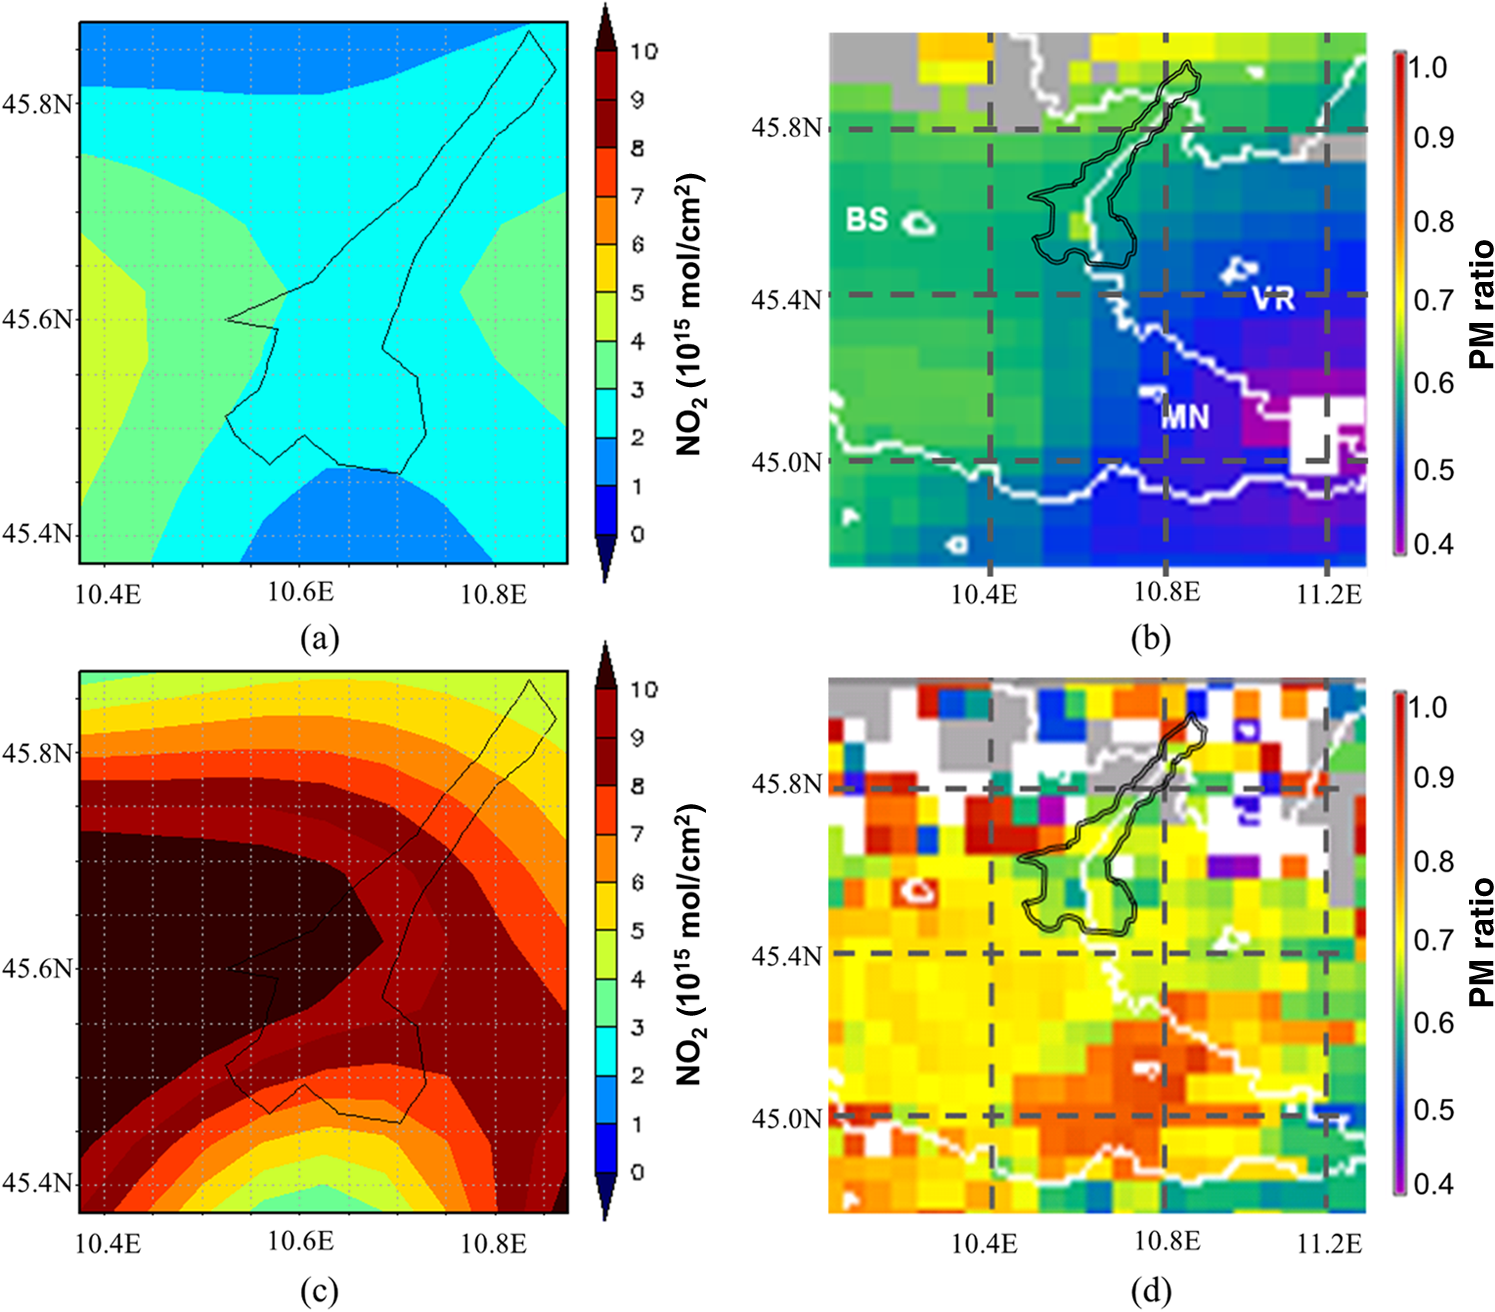 MODIS-based and daily concentrations for the investigated periods (cf. Table 1) have been used to compute maps of the MODIS-based to ratio and then averaged over the dust and no-dust periods. An example of this map averaged over the July 23 to July 31, 2005 time period comprising the first event (i) and referred to the Lake Garda area is reported in Fig. 8(b). The average value of the ratio over Lake Garda is , highlighting a significant presence of coarse particles and thus confirming the dust transport in the study area. This analysis applied to the entire satellite data for detecting the desert dust transport has been applied also to the second case study—event (ii)—listed in Table 1. Similarly, OMI-derived AOP presented in Fig. 7 is computed as averaged over the October 4 to October 10, 2007 time window. In particular, the SSA values averaged over Lake Garda result equal to , , and at 354, 388, and 500 nm, respectively [cf. Fig. 6(b), square yellow symbol], also providing a spectral increasing behavior for pixels where desert dust aerosol occurs. Corresponding data are shown in the left plot of the same figure [Fig. 6(a)]; these values are compatible with a presence of local aerosol (rural and/or urban) mixed with a dust-transported component. Similarly to what has been performed in the analysis of the first dust event, Fig. 8 presents satellite-based information used to provide an exhaustive picture of the second event. Thus, tropospheric column amount is shown [Fig. 8(c)] as derived from OMI observations over the October 4 to October 10, 2007 period. The geographical distribution of the columnar content reflects the well-known very high pollution due to anthropogenic activities of the area. Together with this, the MODIS-based ratio [Fig. 8(d)] in the Lake Garda area provided values around 0.6 and 0.7, highlighting the presence of coarse particles and thus confirming the presence of dust transported in this area. The two no-dust case studies, events (iii) and (iv) (cf. Table 1), are presented with the aim of providing a benchmark for the comparison with the dust events singled out, confirming the capability of the satellite data to reliably detect and monitor the desert dust transport from the sources toward the domain of interest. The OMI AOP spectral data relative to Lake Garda area and related to the first half of June 2005—event (iii)—are represented in Fig. 6. In this case, the retrieved and SSA data (square gray symbols) have been averaged between June 1 and June 14, 2005 for the three OMI aerosol wavelengths. The spectral trend displayed by these parameters is characteristic of a scattering aerosol polydispersion suspended in the troposphere with the spectral extinction () decreasing and typical of a mixing of urban (black circle) and mainly rural (green circle) aerosols components. In particular, the OMI-retrieved SSA values averaged over Lake Garda slightly decrease with wavelength with a value of at the three OMI wavelengths and are very similar to SSA values of rural/clean continental aerosol model (values around 0.95 of green circles). vertical column [Fig. 9(a)] and MODIS-based ratio [Fig. 9(b)] highlight the presence of anthropogenic pollution in the analyzed period of June 2005. In particular, the ratio over Lake Garda was around 0.7 and 0.8. Fig. 9On the top: average of period June 1 to June 15, 2005, no-dust event (iii), of (a) OMI tropospheric concentrations and (b) MODIS-based to ratio values. On the bottom: averaged values for October 30 to November 30, 2006 period, no-dust event (iv), of (c) OMI tropospheric map and (d) MODIS-based to ratio map. 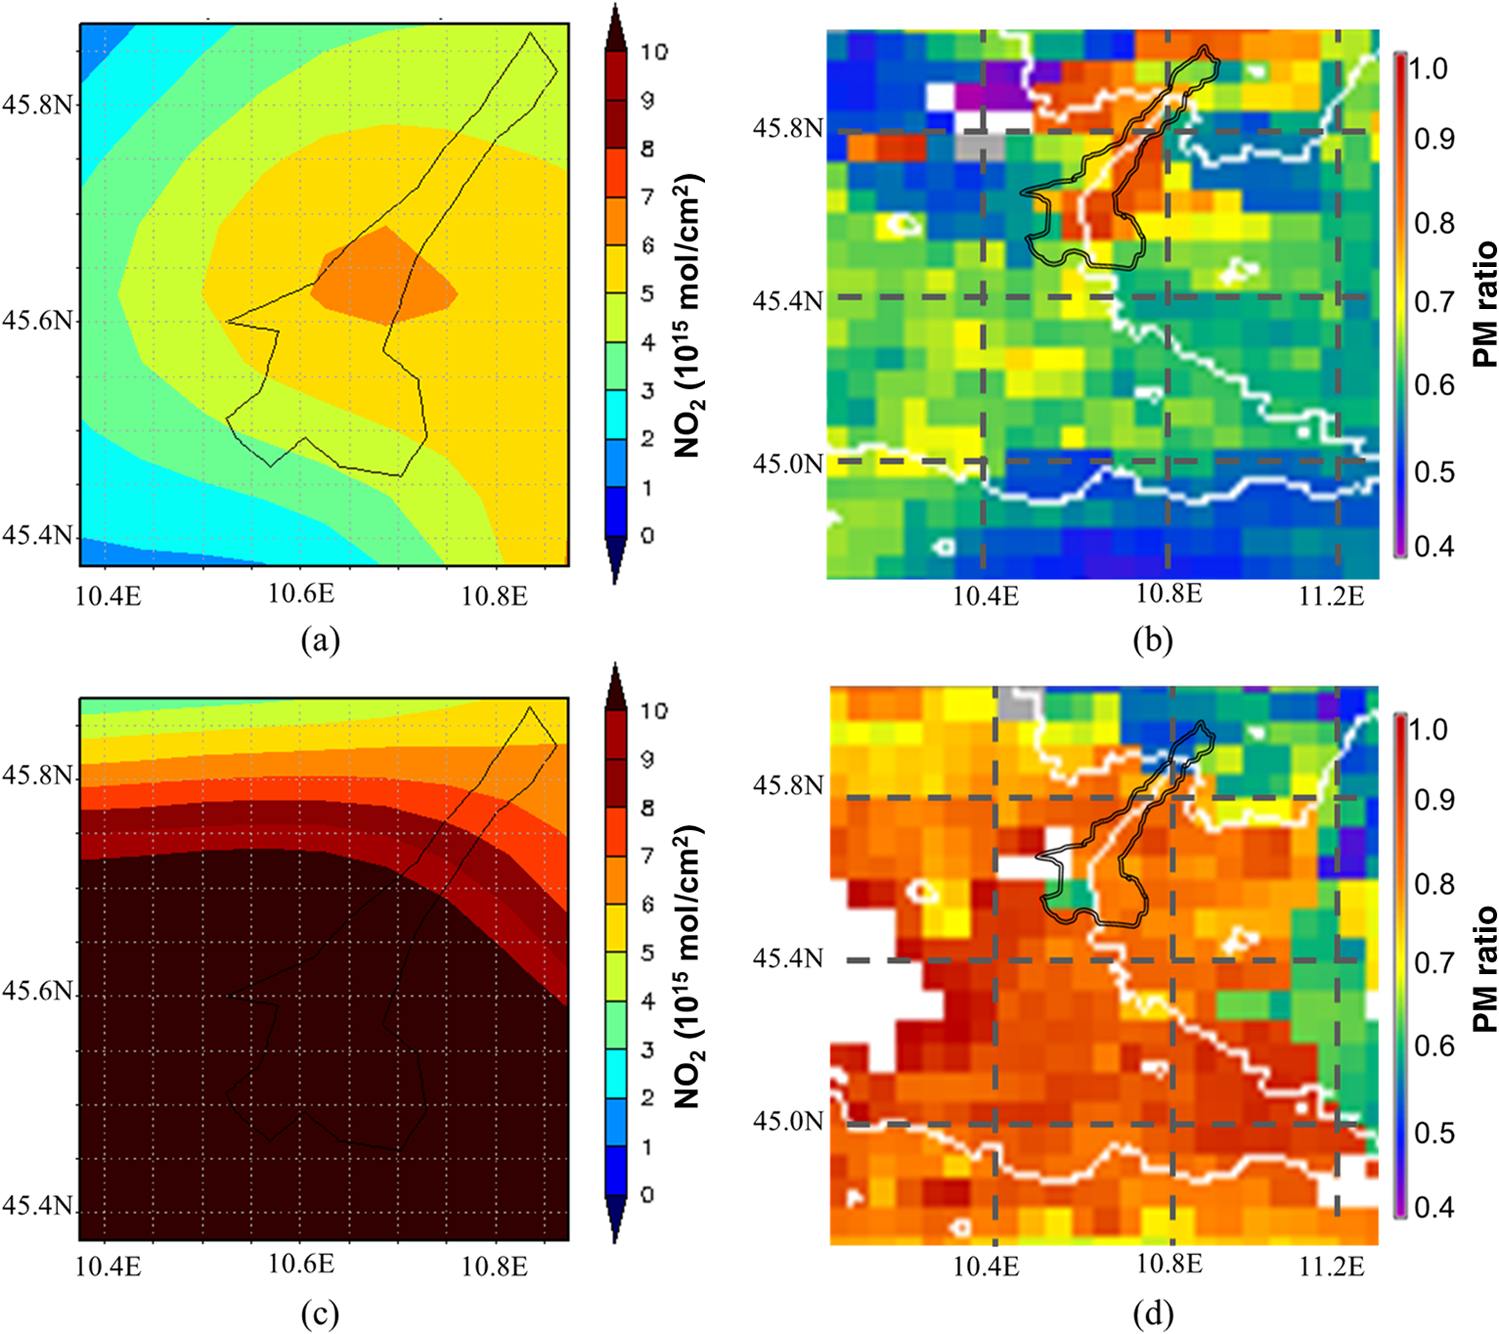 The month of November 2006—event (iv)—has been selected as the second case study for a no-dust analysis. Similarly to the previous cases, Fig. 6 shows the averaged values of the period for Lake Garda of and SSA (black squares) at the three wavelengths. Again, the spectral trend of the parameters confirms the presence in the troposphere of a basically scattering aerosol polydispersion, with a significant presence of urban aerosol type (black circles in Fig. 6). The satellite-based observations in Fig. 9(c) show values of columnar amount, highlighting a significant contribution of human activities to air pollution. The MODIS-based ratio [Fig. 9(d)] provides averaged values higher than 0.8, indicating a main presence of fine particles in the study area. The first five rows in Table 2 report the values of the whole data set of the atmospheric parameters retrieved from OMI/Aura and MODIS/Terra and Aqua satellite sensors. All data are averaged over each temporal period indicated in Table 1 and over the Lake Garda area. Table 2Atmospheric parameters derived from OMI/Aura (EAODn*, SSA, NO2, UV aerosol index) and MODIS/Terra and Aqua (PM2.5 to PM10 ratio) averaged over time period of the events indicated in Table 1 for the Lake Garda area. The uncertainties represent the spatial variability of averaged value (i.e., the RMS linked to the mean spatial value). The percentage of mixing ratio by number [Cm, see Eq. (2)] of the modeling aerosol type is also reported for each Lake Garda event.
A further indicator of the desert dust aerosol suspended in the troposphere is represented by the aerosol index (AI) that can be considered as an indicator of the presence of UV-absorbing aerosols (as mineral dust and smoke) against nonabsorbing aerosols (as sea salt and sulfate particles).47 Accordingly, last four rows in Table 2 show OMI AI for each Lake Garda—event. Typically, AI values greater than 2 highlight the presence of dust. In the analyzed Lake Garda—events, the retrieved OMI AI values are between 0.8 and 1.0 also in the case of dust events (i) and (ii). Actually, these values prevent this parameter to be considered as a clear indicator of the presence of absorbing aerosol, like desert dust. This is mainly due to the small values of columnar EAOD. In fact, in the event (i) inside the dust plume over the Mediterranean area (Fig. 5) AI assumed values greater than 3. To also provide a quantitative estimate of composition of the satellite-retrieved aerosol for each event, it can be assumed that the retrieved aerosol is composed by an external mixing30 of the different aerosol types, desert CV, rural/clean continental, and urban, retrievable over the Lake Garda area. Thus, if [] is the mixing ratio by the number of the ’th aerosol type and are the OMI-retrieved values reported in Table 2, the following system of equations can be considered where for desert CV, rural/clean continental, and urban, respectively; represents the spectral values of the EAOD of the four aerosol models reported in Fig. 6. From Eq. (1), at .For each Lake Garda—event, the values of are also reported in Table 2 as solutions of Eq. (2). In the last row of the table, the percentage of the is also reported as residual of the right member of Eq. (2). This is the fraction of EAOD retrieved, which cannot be fully explained by Eq. (2). Solution of this equation confirms a significant presence of desert dust for the events (i) and (ii) (89% and 75%, respectively), while for the events (iii) and (iv), the most important components are the rural/clean continental (61%) and urban (67%), respectively. 3.2.Effect of Dust Deposition on PhytoplanktonThe evaluation of the effect of dust deposition on phytoplankton abundance was carried out through the analysis of the two dust events (i) and (ii) and on the second no-dust event (iv). However, to evaluate the actual effect of dust deposition on phytoplankton growth, the following factors, which also might influence the phytoplankton dynamics, were considered. (i) The precipitation that influences wet deposition and allows the run-off of all material deposited along the coast was analyzed; while wet depositions have an impact on phytoplankton abundance,48 dry depositions seem to have no significant effects. For this purpose, daily cumulate data from meteorological stations in Ponti S.M. and Bormio were evaluated. Other factors taken into account were (ii) the lake surface temperature (LST) and (iii) the occurrence of complete vertical circulation of the lake. In particular, these last two are both important factors affecting phytoplankton, whose primary production is correlated to LST trend49,50 and nutrients (as mainly nitrogen, phosphorus, and trace metals) whose availability in oligomictic deep lakes, such as Lake Garda, significantly increase in case of complete water column vertical circulation. The temporal dynamic of MERIS-derived chl-a concentrations in the pelagic area during the two dust transport events is shown in Figs. 10(a) and 10(b), together with dust event date and precipitation occurrence. In October 2007, precipitation was recorded simultaneously to dust transport event, allowing wet deposition, while in July 2005 no precipitation occurred until 6 days after dry deposition, this last confirmed by in situ PM measurements. However, an increase in chl-a concentration and thus in phytoplankton abundance (in the time window of desert dust transport) is clearly recognizable after both events; the percentage ratio increase in the chl-a concentration estimated between the last image before the event and the maximum value recorded after the deposition have been about 34% and 173%, respectively, for the case relative to July 28, 2005 and October 2007. The time-trend of LST showed that no increase occurred in the evaluated time window but, indeed, a negative trend was recorded as shown in Figs. 10(a) and 10(b), suggesting the independence of chl-a concentration increase from LST in both cases. Fig. 10Time pattern of chl-a concentration and LST on the time window of dust events in (a) July 2005 and (b) October 2007. Orange lines show dust event dates, blue lines show precipitation occurrences. 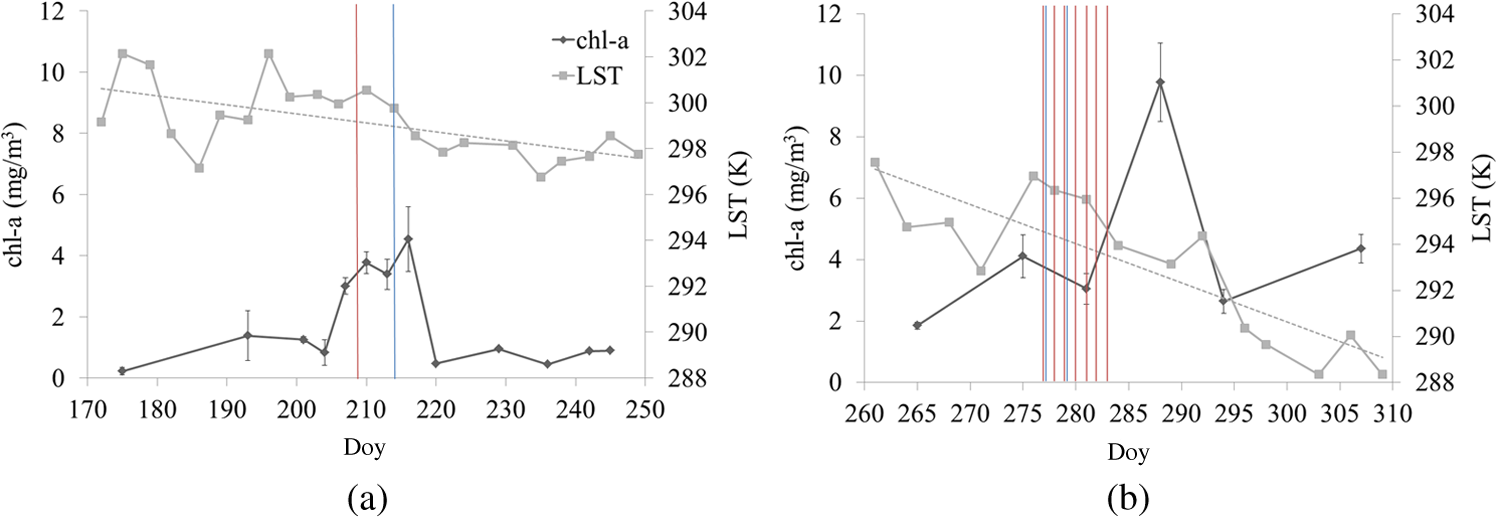 The time-lag between dust wet deposition (or the first precipitation recorded after the dust dry deposition) and the date of the first increment and maximum concentration was calculated. In this case, the first increase and maximum coincide; it turned out to range between 2 days in July 2005 and 8 days in October 2007. These results are in line with those in literature: e.g., from Ref. 48, in dust experiment in a low nutrient, low chlorophyll ecosystem (DUNE) project chl-a concentration increase could be recorded within 24 h and lasted several days (at least a week). A similar analysis was performed for the no-dust event on November 2006, for which MERIS images were available. In this case, as it can be seen in Fig. 11, no appreciable increase of chl-a has been recorded from MERIS. Fig. 11Chl-a concentration trend in the time window of the no-dust event in November 2006 [event (iv) of Table 1]. Green lines show peaks dates, blue lines show precipitation occurrences.  Figure 12 shows chl-a maps retrieved for the last image before and the first image after each event considered; an increase of chl-a concentration affects the whole lake area shown in the map after dust events, excepted for the coastal area. In fact, the effect is greater moving away from the coastal area where other factors lead chl-a concentration dynamics (e.g., anthropogenic discharges). Fig. 12Chl-a concentration before and after (a and b) dust event (i), (c and d) dust event (ii) and (e and f) no-dust event (iv). Gray indicates the pixels whose spectrum is too contaminated by the bottom signal and the adjacency effect; white indicates the invalid pixels (due to cloudiness or radiometric noise). The narrower northern part of the lake was omitted from the analysis due to the noise caused by the mountain adjacency.  4.ConclusionsThe findings of the analysis presented in this work outlined the capabilities of multispectral and multisensors satellite data to trace desert aerosol transport and the response of phytoplankton in lake waters. A selection of case studies relative to desert dust transport episodes in Northern Italy have been singled out based on ground observations gathered from PM and AERONET stations. For these events, remote sensing images from SEVIRI/MSG, OMI/Aura, MODIS/Terra-Aqua, and MERIS/Envisat have been analyzed for (i) evaluating the dust transport and deposition in the Lake Garda area and (ii) investigating the effects of the dust presence on phytoplankton growth in lake waters. Together with these cases, periods characterized by absence of desert dust aerosol, the no-dust events, have also been selected. This has been done to allow the comparison with the dust events and thus confirming the capability of the satellite remote sensing techniques to reliably detect this transport from the sources toward the domain of interest. In particular, SEVIRI/MSG observations have been used to detect and follow desert dust transport pattern on the basis of the differences between BTs recorded in various IR channels. Measurements in the UV–VIS range by OMI/AURA have been analyzed providing estimates of spectral AOP and the percentage of the external mixing ratio by the number of desert dust, rural, and urban aerosol types. Together with these satellite data, MODIS-derived ratio maps for the four analyzed periods confirmed the presence (or the absence) of desert dust in the study area, being the ratio values on average less (or greater) than about 0.65. After that, MERIS-derived chl-a concentrations have been used for the evaluation of the dust deposition effect in Lake Garda. Results showed an increase of chl-a concentration with values varying from 30% to 170% and a time-lag of about 2 to 8 days. In occasion of the no-dust event, the same techniques turned out to provide no significant variation in chl-a concentration. Furthermore, a large set of in situ data was employed to fully describe and confirm the effect of dust deposition. Thus, the wide set of observations (both satellite and ground-based) and related techniques emphasizes how synergic approach might provide an exhaustive picture of the desert dust case studies and of the subsequent effect on lake water quality. Nonetheless, new case studies have to be considered to further investigate the response of the lake to dust deposition events. In this view, it will be possible to go ahead by exploiting the observations that will be carried out from the forthcoming satellite sensors, within the frame of next EO missions. Actually these planned activities will allow providing a significant improved monitoring of the atmospheric constituents, mainly in terms of increasing frequency of observations, giving the unique possibility for an operational monitoring of the environmental impacts of desert dust transport and deposition. In addition, they will allow improvement of studies on effects on phytoplankton abundance providing new suitable sensors for water quality retrieval such as OLCI, which will be the successor of MERIS (presenting similar spatial and spectral resolutions) and will be onboard the two Sentinel 3A and 3B. Table 3 presents a list of recently launched and forthcoming satellite sensors that could be used in this kind of study. Each sensor is presented with the corresponding hosting platform, and then the main purpose for which the sensor is intended follows together with its characteristic of spectral and spatial resolution and its expected lifetime. Finally, in the table, the heritage, on the basis of which the new sensor is built, is given in order to highlight the continuity with the old or in operation sensors used in this work. Table 3Summary of the main features of forthcoming satellite sensors in the frame of the next EO missions. The spatial resolution is relative to subsatellite point.
AcknowledgmentsWe thank the NASA Goddard Earth Sciences Data and Information Services Center (GES DISC) team being the analyses and visualizations used in this paper produced with the Giovanni online data system and the NASA GSFC LAADS group for providing continuous level 2 MODIS data. MERIS data were made available through the ESA project AO-553 (MELINOS). We also thank the AERONET Principal Investigators G. Zibordi for Ispra and Venice sites and S. Corradini and S. Teggi for Modena. LST in situ measurements were kindly provided by G. Fila from CRA; PM measurements were gathered by the Regional Environmental and Protection Agencies of Lombardia, Emilia Romagna, and Piemonte. This study was cofounded by SINOPIAE (ASSE I, POR Competitività 2007 to 2013, cofounded by European Union, Italy, and Regione Lombardia), GLaSS (EC FP7 Grant Agreement 313256), QUITSAT (Italian Space Agency), and PASODOBLE (EC FP7 Grant Agreement 241557). This work would not be possible without assistance and contributions provided by Anna Rampini from CNR-IREA. We are grateful to the anonymous reviewers who contributed to the improvement of this paper. ReferencesI. N. Sokolik et al.,
“Introduction to special section: outstanding problems in quantifying the radiative impacts of mineral dust,”
J. Geophys. Res., 106 18015
–18028
(2001). http://dx.doi.org/10.1029/2000JD900498 JGREA2 0148-0227 Google Scholar
A. Slingo et al.,
“Observations of the impact of a major Saharan dust storm on the atmospheric radiation balance,”
Geophys. Res. Lett., 33 L24817
(2006). http://dx.doi.org/10.1029/2006GL027869 GPRLAJ 0094-8276 Google Scholar
Z. Levin, E. Ganor and V. Gladstein,
“The effects of desert particles coated with sulfate on rain formation in the eastern Mediterranean,”
J. Appl. Meteorol. Climatol., 35 1511
–1523
(1996). http://dx.doi.org/10.1175/1520-0450(1996)035<1511:TEODPC>2.0.CO;2 Google Scholar
D. W. Griffin et al.,
“The global transport of dust,”
Am. Sci., 90
(3), 228
(2002). http://dx.doi.org/10.1511/2002.3.228 Google Scholar
“Directive 2008/50/EC of the European Parliament and of the Council of 21 May 2008 on Ambient air quality and cleaner air for Europe,”
Off. J. Eur. Union, L152 1
–44
(2008). Google Scholar
M. Escudero et al.,
“Determination of the contribution of northern Africa dust source areas to PM10 concentrations over the central Iberian Peninsula using the Hybrid Single-Particle Lagrangian Integrated Trajectory model (HYSPLIT) model,”
J. Geophys. Res., 111 D06210
(2006). http://dx.doi.org/10.1029/2005JD006395 JGREA2 0148-0227 Google Scholar
G. P. Gobbi, F. Barnaba and L. Ammannato,
“Estimating the impact of Saharan dust on the year 2001 PM10 record of Rome, Italy,”
Atmos. Environ., 41 261
–275
(2007). http://dx.doi.org/10.1016/j.atmosenv.2006.08.036 AENVEQ 0004-6981 Google Scholar
P. Carbo et al.,
“Impact of atmospheric deposition on N and P geochemistry in the southeastern Levantine basin,”
Deep Sea Res., II 523041
–3053
(2005). http://dx.doi.org/10.1016/j.dsr2.2005.08.014 Google Scholar
N. Meskhidze, W. L. Chameides and A. Nenes,
“Dust and pollution: a recipe for enhanced ocean fertilization?,”
J. Geophys. Res., 110
(D3), D03301
(2005). http://dx.doi.org/10.1029/2004JD005082 JGREA2 0148-0227 Google Scholar
G. Volpe et al.,
“Satellite observations of the impact of dust in a low-nutrient, low-chlorophyll region: fertilization or artifact?,”
Global Biogeochem. Cycles, 23 GB3007
(2009). http://dx.doi.org/10.1029/2008GB003216 GBCYEP 0886-6236 Google Scholar
B. Herut et al.,
“Atmospheric input of nitrogen and phosphorus to the Southeast Mediterranean: sources, fluxes, and possible impact,”
Limnol. Oceanogr., 44
(7), 1683
–1692
(1999). http://dx.doi.org/10.4319/lo.1999.44.7.1683 LIOCAH 0024-3590 Google Scholar
C. Ridame and C. Guieu,
“Saharan input of phosphate to the oligotrophic water of the open western Mediterranean Sea,”
Limnol. Oceanogr., 47 856
–869
(2002). http://dx.doi.org/10.4319/lo.2002.47.3.0856 LIOCAH 0024-3590 Google Scholar
S. Guerzoni, E. Molinaroli and R. Chester,
“Saharan dust inputs to the western Mediterranean Sea: depositional patterns, geochemistry and sedimentological implications,”
Deep Sea Res., II
(44), 631
–654
(1997). http://dx.doi.org/10.1016/S0967-0645(96)00096-3 Google Scholar
P. G. Falkowski, R. T. Barber and V. Smetacek,
“Biogeochemical controls and feedbacks on ocean primary production,”
Science, 281 200
–206
(1998). http://dx.doi.org/10.1126/science.281.5374.200 SCIEAS 0036-8075 Google Scholar
S. Guerzoni et al.,
“The role of atmospheric deposition in the biogeochemistry of the Mediterranean Sea,”
Prog. Oceanogr., 44
(1–3), 147
–190
(1999). http://dx.doi.org/10.1016/S0079-6611(99)00024-5 POCNA8 0079-6611 Google Scholar
E. Develi, A. E. Kideys and S. Tugrul,
“Role of Saharan dust on phytoplankton dynamics in the northeastern Mediterranean,”
Mar. Ecol. Prog. Ser., 314 61
–75
(2006). http://dx.doi.org/10.3354/meps314061 MESEDT 0171-8630 Google Scholar
R. Izquierdo et al.,
“Atmospheric phosphorus deposition in a near-coastal rural site in the NE Iberian Peninsula and its role in marine productivity,”
Atmos. Environ., 49 361
–370
(2012). http://dx.doi.org/10.1016/j.atmosenv.2011.11.007 AENVEQ 0004-6981 Google Scholar
T. F. Eck et al.,
“Wavelength dependence of the optical depth of biomass burning, urban, and desert dust aerosols,”
J. Geophys. Res. Atmos., 104
(24), 31333
–31349
(1999). http://dx.doi.org/10.1029/1999JD900923 JGRDE3 0148-0227 Google Scholar
O. Dubovik et al.,
“Variability of absorption and optical properties of key aerosol types observed in worldwide locations,”
J. Atmos. Sci., 59 590
–608
(2002). http://dx.doi.org/10.1175/1520-0469(2002)059<0590:VOAAOP>2.0.CO;2 JAHSAK 0022-4928 Google Scholar
K. J. Kaufman et al.,
“Dust transport and deposition observed from the Terra-moderate resolution imaging spectroradiometer (MODIS) spacecraft over the Atlantic Ocean,”
J. Geophys. Res., 110 D10S12
(2005). http://dx.doi.org/10.1029/2003JD004436 JGREA2 0148-0227 Google Scholar
D. Liu et al.,
“A height resolved global view of dust aerosols from the first year CALIPSO lidar measurements,”
J. Geophys. Res., 113 D16214
(2008). http://dx.doi.org/10.1029/2007JD009776 JGREA2 0148-0227 Google Scholar
C. Giardino et al.,
“Assessment of water quality in Lake Garda (Italy) using Hyperion,”
Remote Sens. Environ., 109
(2), 183
–195
(2007). http://dx.doi.org/10.1016/j.rse.2006.12.017 Google Scholar
G. Premazzi et al.,
“Lake management in Italy: the implications of the Water Framework Directive,”
Lakes Reservoirs, 8
(1), 41
–59
(2003). http://dx.doi.org/10.1046/j.1440-1770.2003.00210.x Google Scholar
N. Salmaso,
“Effects of climatic fluctuations and vertical mixing on the interannual trophic variability of Lake Garda, Italy,”
Limnol. Oceanogr., 50
(2), 553
–565
(2005). http://dx.doi.org/10.4319/lo.2005.50.2.0553 LIOCAH 0024-3590 Google Scholar
N. Salmaso,
“Long-term phytoplankton community changes in a deep subalpine lake: responses to nutrient availability and climatic fluctuations,”
Freshwater Biol., 55
(4), 825
–846
(2010). http://dx.doi.org/10.1111/j.1365-2427.2009.02325.x Google Scholar
“Deep clear lakes with increasing eutrophication,”
(2015). http://www.glass-project.eu/assets/Deliverables/GLaSS-D5.3.pdf Google Scholar
N. Salmaso,
“Influence of atmospheric modes of variability on a deep lake south of the Alps,”
Clim. Res., 51 125
–133
(2012). http://dx.doi.org/10.3354/cr01063 CLREEW 0936-577X Google Scholar
J. Schmetz et al.,
“An introduction to meteosat second generation (MSG),”
Bull. Am. Meteorol. Soc., 83
(7), 977
–992
(2002). http://dx.doi.org/10.1175/1520-0477(2002)083<0977:AITMSG>2.3.CO;2 BAMIAT 0003-0007 Google Scholar
D. Rosenfeld et al.,
“Applications of Meteosat Second Generations (MSG)–conversion from counts to radiances, version 1.2,”
(2005) http://oiswww.eumetsat.org/WEBOPS/msg_interpretation/msg_channels.php ( February ). 2005). Google Scholar
C. Levoni et al.,
“Atmospheric aerosol optical properties: a database of radiative characteristics for different components and classes,”
Appl. Opt., 36
(30), 8031
–8041
(1997). http://dx.doi.org/10.1364/ao.36.008031 APOPAI 0003-6935 Google Scholar
G. A. D'Almeida, P. Koepke and P. Shettle, Atmospheric Aerosols: Global Climatology and Radiative Characteristics, A Deepak Pub, Hampton
(1991). Google Scholar
E. P. Shettle and R. W. Fenn,
“Models of the aerosol of the lower atmosphere and the effects of humidity variations on their optical properties,”
Massachusetts
(1979). Google Scholar
W. Di Nicolantonio, A. Cacciari and C. Tomasi,
“Particulate matter at surface: Northern Italy monitoring based on satellite remote sensing, meteorological fields, and in-situ samplings,”
IEEE J. Sel. Top. Appl. Earth Obs. Remote Sens., 2
(4), 284
–292
(2009). http://dx.doi.org/10.1109/JSTARS.2009.2033948 Google Scholar
G. A. Grell, J. Dudhia and D. R. Stauffer,
“A description of the fifth-generation Penn State/NCAR Mesoscale Model (MM5),”
Boulder, Colorado
(1994). Google Scholar
W. Di Nicolantonio,
“Satellite-based monitoring of air quality within QUITSAT project,”
Geophys. Res. Abstract, 11
(2009). Google Scholar
A. Cacciari, W. Di Nicolantonio and A. Tiesi,
“Satellite-based PM annual compliance monitoring for Northern Italy: a PASODOBLE downstream sub-service,”
in Proc. of the ATMOS (Advances in Atmospheric Science and Applications) ESA Conf.,
(2012). Google Scholar
L. Bourg, L. D'Alba and P. Colagrande,
“MERIS smile effect characterization and correction,”
(2008) http://earth.eo.esa.int/pcs/envisat/meris/documentation/ Google Scholar
R. Santer and F. Zagolski,
“ATBD—the MERIS level-1C,”
ICOL-Improve Contrast Between Ocean and Land, Université du Littoral, Wimereux, France
(2009). Google Scholar
R. Doerffer and H. Schiller,
“The MERIS case 2 water algorithm,”
Int. J. Remote Sens., 28
(3–4), 517
–535
(2007). http://dx.doi.org/10.1080/01431160600821127 IJSEDK 0143-1161 Google Scholar
D. Odermatt, C. Giardino and T. Heege,
“Chlorophyll retrieval with MERIS case-2-regional in perialpine lakes,”
Remote Sens. Environ., 114
(3), 607
–617
(2010). http://dx.doi.org/10.1016/j.rse.2009.10.016 Google Scholar
M. Bresciani et al.,
“Assessing remotely sensed chlorophyll-a for the implementation of the Water Framework Directive in European perialpine lakes,”
Sci. Total Environ., 409 3083
–3091
(2011). http://dx.doi.org/10.1016/j.scitotenv.2011.05.001 Google Scholar
S. Ackermann,
“Remote sensing aerosol using satellite infrared observations,”
J. Geophys. Res., 102 17069
–17080
(1997). http://dx.doi.org/10.1029/96JD03066 JGREA2 0148-0227 Google Scholar
I. N. Sokolik,
“The spectral radiative signature of wind-blown mineral dust: implications for remote sensing in the thermal IR region,”
Geophys. Res. Lett., 29
(24), 2154
(2002). http://dx.doi.org/10.1029/2002GL015910 GPRLAJ 0094-8276 Google Scholar
G. Hänel,
“The properties of atmospheric aerosol particles as functions of the relative humidity at thermodynamic equilibrium with the surrounding moist air,”
Adv. Geophys., 19 73
–188
(1976). http://dx.doi.org/10.1016/S0065-2687(08)60142-9 ADGOAR 0065-2687 Google Scholar
K. F. Boersma et al.,
“Near-real time retrieval of tropospheric from OMI,”
Atmos. Chem. Phys., 7 2103
–2128
(2007). http://dx.doi.org/10.5194/acp-7-2103-2007 ACPTCE 1680-7324 Google Scholar
O. Torres et al.,
“Derivation of aerosol properties from satellite measurements of backscattered ultraviolet radiation: theoretical basis,”
J. Geophys. Res., 103
(D14), 17099
–17710
(1998). http://dx.doi.org/10.1029/98JD00900 JGREA2 0148-0227 Google Scholar
C. Ridame et al.,
“Phytoplanktonic response to contrasted Saharan dust deposition events during mesocosm experiments in LNLC environment,”
Biogeosci. Discuss., 11
(1), 753
–796
(2014). http://dx.doi.org/10.5194/bg-11-4783-2014 Google Scholar
M. Bresciani, C. Giardino and L. Boschetti,
“Multi-temporal assessment of bio-physical parameters in lakes Garda and Trasimeno from MODIS and MERIS,”
Ital. J. Remote Sens., 43
(3), 49
–62
(2011). http://dx.doi.org/10.5721/ItJRS20114334 Google Scholar
N. Salmaso et al.,
“Effects of nutrient availability and temperature on phytoplankton development: a case study from large lakes south of the Alps,”
Aquat. Sci., 74
(3), 555
–570
(2012). http://dx.doi.org/10.1007/s00027-012-0248-5 AQSCEA 1420-9055 Google Scholar
BiographyWalter Di Nicolantonio received his MS degree in physics, University La Sapienza, Rome, Italy, he is employed in the EO Department of CGS SpA, an OHB SE Company, and worked inside of the Institute of Atmospheric and Climate Sciences of CNR. Up to 2014, he has been in charge of the CGS Bologna division. He contributes to the management of national and international research projects in the field of satellite remote sensing of aerosols, clouds and air quality. |
|||||||||||||||||||||||||||||||||||||||||||||||||||||||||||||||||||||||||||||||||||||||||||||||||||||||||||||||||||||||||||||||||||||||||||||||||||||||||||||||||||||||||||||||||||||||||


