|
|
1.IntroductionLoess in China occupies 0.63 million square kilometer and exists in 12 provinces, of which 0.4 million square kilometer is loess plateau. Loess plateau is the main product base of oil, gas, and coal resources. Unfortunately, it is also a geo-hazard-prone region, including collapse, landslide, earthflow, land subsidence, and ground fissures. In the past 30 years, thousands of people died by the loess geo-hazards.1 Currently, loess geo-hazards threaten the transportation system, local citizens, and natural resource exploration. The trigger factors of a loess landslide comprise of earthquake, strong rainfall, and seasonal irrigation.2–6 The characteristics of a loess landslide are special in the following aspects: group occurrence, small spatial scale, and temporal abrupt deformation for most specific landslides. Consequently, the detection of loess landslides over a large area, high-precision deformation monitoring, and early warning of the specific loess landslide are still challenging. The landslide in the southern bank of Jinghe River, Shaanxi province, China, is one of the typical cases, which is mainly triggered by farmland irrigation.7–9 The southern bank of Jinghe River, a small section of the subregion of Weibei loess plateau in Weihe basin, is 27.1 km in length, including three towns as Taiping, Jiangliu, and Gaozhuang and 21 villages. The heights on this terrace range from 450 to 580 m, with the slopes from 4 to 9‰. The height differences between the top and toe of the terrace range from 30 to 90 m. Since 1976, around 50 landslides over 27 sites have taken place along this region.7 These landslides have seasonal features, which are correlated with heavy rainfall and farmland irrigation. More than 80 percent of the landslides occurred in spring or autumn, with a certain time lag of irrigation or heavy rainfall. Different interferometric synthetic aperture radar (InSAR) techniques have been widely applied to detect the locations of occurred and potential landslides over a large coverage region.10–12 Zhao et al.10 have reported the landslide inventory map in Northwestern US under the condition of forest, generated with L-band ALOS/PALSAR data. The length of a single landslide is , and the deformation history is as long as several years. For the large-area loess landslide detection, previous works have been done for the postlandslides inventory mapping, investigation and mechanism analysis.6,7 Due to the particular characteristics of loess landslides, such as small spatial extent, small deformation magnitude, and abrupt occurrence in time domain,13 no mature InSAR techniques can be readily applied to detect and monitor them. We first point out a two-step method to detect potential loess landslide using small baseline subsets (SBAS) InSAR techniques according to the loess landslides mechanism.8 First, we detect land subsidence on the terrace, which can be easily realized due to its large spatial extent and long deformation history. Then we will closely search loess landslides within a given distance and direction of land subsidence center according to topography and hydrology conditions. On the other hand, multiple InSAR techniques have been successfully employed to retrieve the prelandslide deformation history and even postlandslide surface changes.12,14–16 However, the spatial extent of a rockslide14 and a landslide15,16 is much larger than a loess landslide. As far as landslide monitoring is concerned, few onset times of landslides have been precisely detected and short-term early warning can be issued accordingly. Special SAR data and InSAR data processing procedures are analyzed in this paper. We take the Xingyuan landslide as an example, which took place on April 10, 2012 (Fig. 1). Meter resolution SAR data from TerraSAR-X are selected. Several specific InSAR processing measures have been taken, such as digital elevation model (DEM) error correction, phase unwrapping error detecting and repairing before the SBAS InSAR processing. Most importantly, precursory signals for Xingyuan landslide are successfully recovered, which in essence is crucial for landslide early warning and prevention. 2.MethodsDifferent InSAR techniques have been developed over the last 25 years, including permanent scatterers (PS) InSAR17–19 and SBAS techniques.20,21 For small-scale and abrupt loess landslide deformation monitoring, the PS InSAR technique can hardly be applied due to the few PS points and SAR images. On the other hand, the SBAS InSAR technique has been widely applied owing to its flexibility, high precision, and time-series deformation result recovery. However, for small-scale landslide detection and monitoring, four steps should be carefully considered, such as DEM error correction, phase unwrapping error detection and correction, high-quality interferograms selection, and downslope deformation transformation. The flowchart is shown in Fig. 2. 2.1.Digital Elevation Model Error CorrectionIn order to get surface deformation, external DEM is needed to subtract the topographic phase from original SAR interferogram, generated from coregistrated master and slave images. For the landslide-prone region, no suitable DEM is available due to the repeated landslide occurrences historically. That is, no real DEM can be available during the SAR acquisition periods, which will inevitably result in errors in the final deformation results. As the height is sensitive to the long perpendicular baseline component according to the height-to-phase formula, long spatial baseline and small temporal baseline InSAR pairs are used to invert the linear deformation and DEM error simultaneously.20 In addition, the interferograms contaminated by severe atmospheric effects should not be included. For a given interferogram , after removing the flat earth and local topography, the unwrapped differential phase at pixel , ( and are the azimuth and range coordinates, respectively) computed from the SAR acquisitions at epoch (start time) and (end time) can be written as follows: where where is the perpendicular baseline, is the sensor-to-target distance, is the look angle, and is the DEM error with respect to the given external DEM. is the interferogram number. Once , DEM error can be calculated under the least square criteria, and DEM can be updated by adding the DEM error back to the original one.2.2.Phase Unwrapping Detection and CorrectionPhase unwrapping error often occurs in the case of decorrelation, which is always caused by surface random change, such as vegetation, plantation and irrigation, and long spatial and temporal baseline between master and slave SAR images. Generally, a minimum cost flow unwrapping algorithm with the aid of coherence-induced mask file is used to unwrap the interferogram.22 Different coherence thresholds can be set to get different unwrapped interferograms, and their differences mainly occur in the low-coherent areas. In case the temporally low-coherent regions are the targets of interest, two methods can be applied to correct the unwrapped errors. (1) Smaller coherence threshold is set to get denser unwrapped correct phase, which can provide more candidates for later results analysis. (2) As all interferograms are unwrapped individually, the phase contributions behave in a conservative manner. That is, , where is the phase contribution to interferogram , which is constructed from acquisitions and . If only one interferogram has unwrapping error, a phase closure technique can be used to detect the unwrapping errors.23 And the phase offset ( phase integer multiplier) can be added back to the wrongly unwrapped phase to correct it. 2.3.Small Baseline Subsets Interferometric Synthetic Aperture Radar AlgorithmOnce deformation related interferograms have been successfully unwrapped, deformation time-series results can be easily retrieved under the norm of least square or singular value decomposition, which is determined by the number of subsets involved.20 For a generic pixel , the phase for interferograms can be given in matrix form as follows. where , [see Eq. (2)]. The estimated linear deformation rate and residual DEM phases are then subtracted from all unwrapped interferograms. Next, the atmospheric phase can be separated by low-pass filtering in the spatial domain and high-pass filtering in the temporal domain, because the atmospheric artifacts are spatially correlated and temporally random.17 Then, the nonlinear deformation phase at different SAR acquisition dates will be calculated. Last, the accumulated deformation time series can be achieved by integrating the deformation in each neighboring SAR acquisition date as follows: where is the earliest SAR acquisition date, is the ’th SAR acquisition date, and is the nonlinear deformation phase.2.4.Deformation in Slope DirectionInSAR can only measure the deformation along the line-of-sight (LOS) direction. That is, the InSAR measurement represents the component of ground deformation projected to the LOS direction. Once the landslide geometry is obtained, the LOS deformation will be projected to the downslope direction to analyze the landslide activity. The transformation between the LOS direction and downslope direction is straightforward. The unit vector of LOS can be defined as follows:14,24 where is the look angle and is the satellite flight azimuth. The unit vector of slope can be defined as follows: where is the slope angle above the horizontal surface and is the slope azimuth. So the deformation in the slope direction can be expressed as3.Background and Data3.1.Xingyuan Landslide BackgroundThe Xingyuan landslide occurred on April 10, 2012. The perspective image and geological profile of the Xingyuan landslide are shown as Figs. 1(b) and 1(c). The landslide has a moderate slope of and its relative height between the terrace and the bottom is . The loess layer can be divided into Malan loess, Lishi loess from the top to the bottom, among which some Paleosol imbedded. The source of landslide is 190 m in width along the edge of terrace, and 66 m along the sliding direction including slope section while the deposit is 220 m in width and 144 m in length. 3.2.Synthetic Aperture Radar DataIn order to detect and monitor small spatial loess landslide prior to the Xingyuan landslide, 11 TerraSAR-X SAR images generated in strip mode with 3 m ground pixel posting are selected, and the multilook number is set as 2 and 2 in range and azimuth directions, respectively. After setting the spatial baseline and temporal baseline thresholds, and visually checking the interferogram quality, 17 interferograms are generated for further analysis. Table 1 presents the parameters of interferometric pairs and their functions for data analysis, including DEM error calculation, phase unwrapping error correction, and time-series deformation estimation, where “a” indicates the considered interferogram. Figure 3 shows 15 interferometric SAR configurations for time-series deformation estimation, and 7 of them with longer perpendicular baselines shown in red dashed lines are also applied to estimate DEM error. Table 1The parameters of interferometric pairs and their functions for later analysis.
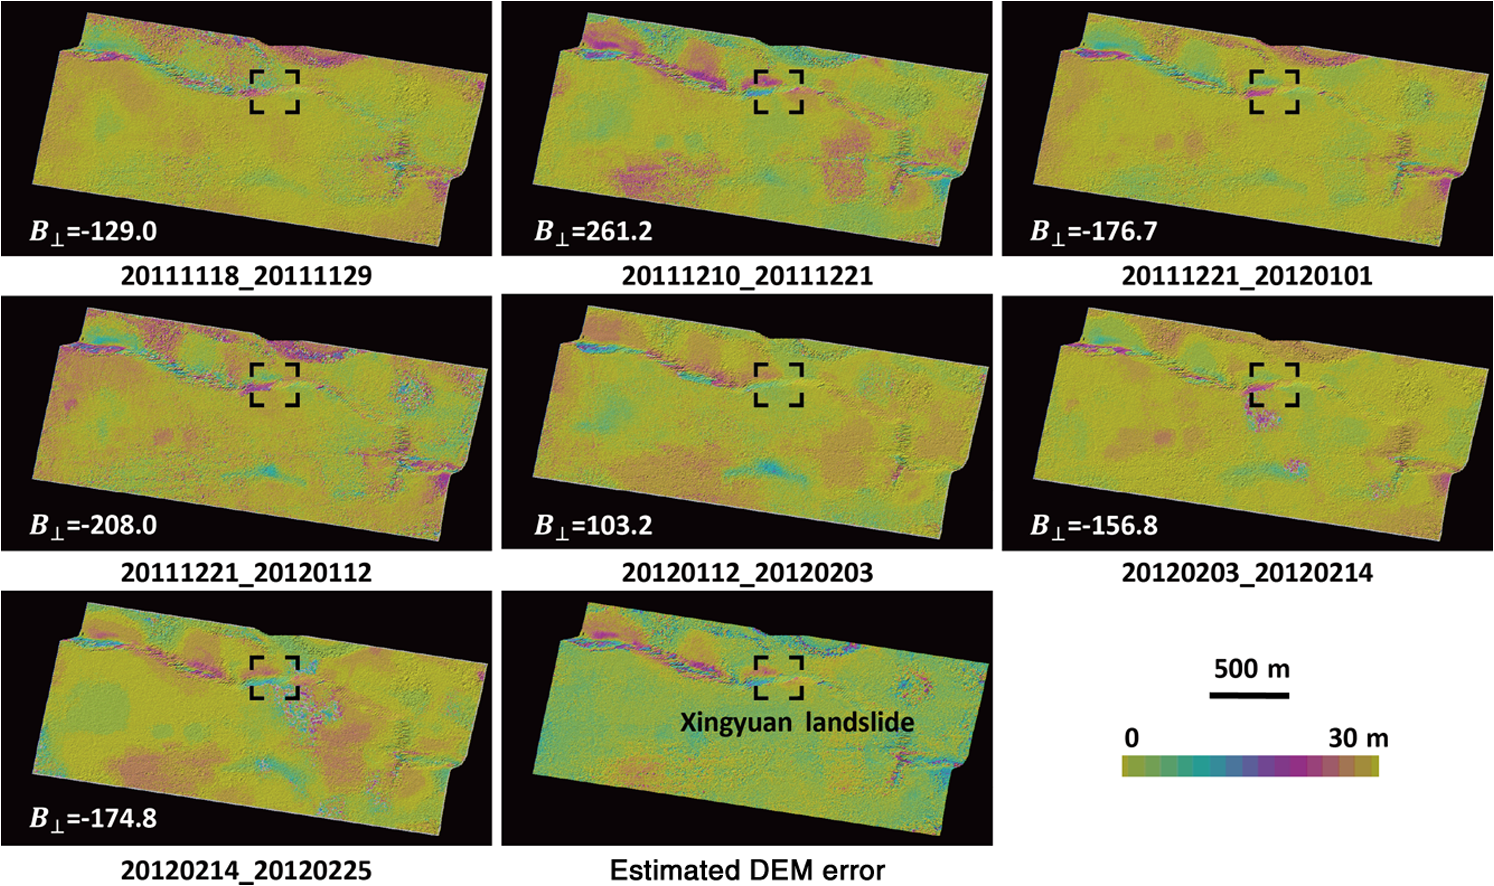
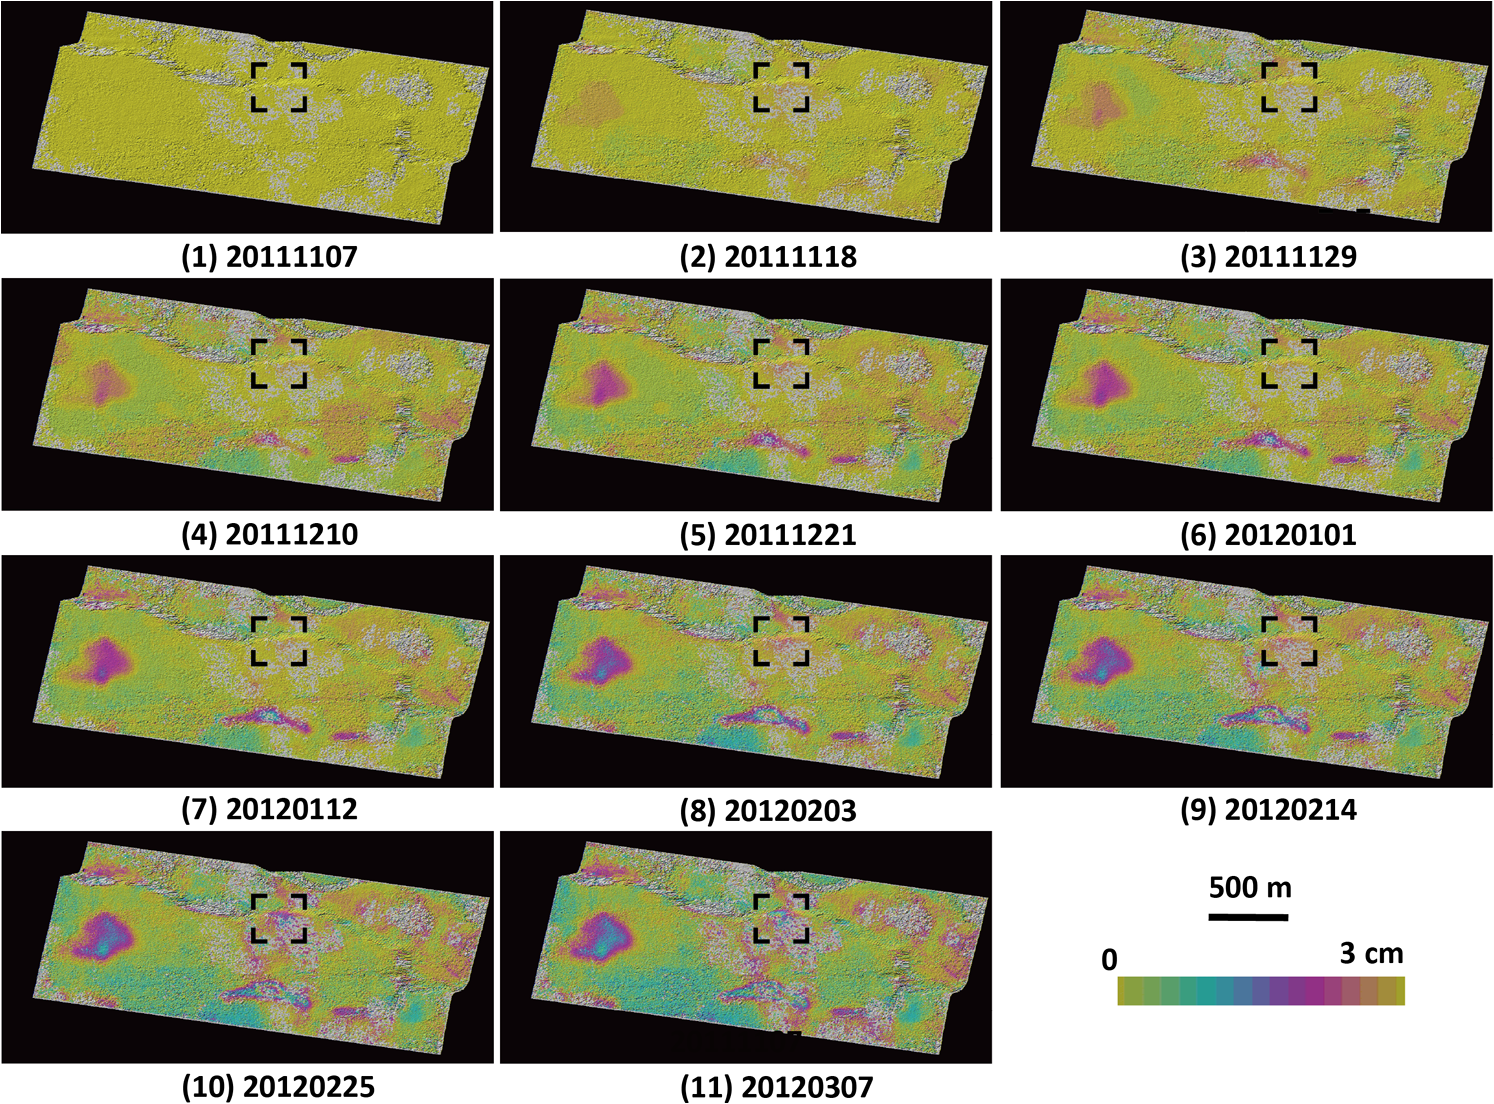
3.3.Digital Elevation Model DataAiming to meet the requirement of high-resolution TerraSAR data processing and avoid the interpolation error with low-resolution DEM, such as Shuttle Radar Topography Mission 3 arc sec DEM, we choose 1 to 10,000 scale topographic map, digitalize, and grid it into a DEM. As it was mapped in 1995 and several landslides had occurred in this region since then, this DEM will be corrected after calculating the DEM error with long spatial baseline InSAR pairs as shown in Table 1. 4.Results4.1.Errors and Corrections4.1.1.Digital elevation model errors estimationAs the DEM applied in this research was generated 20 years ago, surface topography has been changed due to the previous landslides. In order to mitigate the deformation error resulting from low-accuracy DEM, the DEM error is first estimated and corrected. In this case, seven interferograms with long perpendicular baseline and short time duration are selected, which is shown in Fig. 4. The last frame of Fig. 4 is the estimated DEM error map, from which DEM error can be visually seen at the edge of the Jinghe River terrace including the Xingyuan landslide region. The maximum DEM error amounts to 30 m. 4.1.2.Phase unwrapping error correctionPhase unwrapping error arises when the imaged area suffers decorrelation due to rainfall, irrigation, or large deformation gradient, which is shown as the offset of phase integer multiplier. In this research, different coherence thresholds are tested to get corrected unwrapping results. Figure 5 shows the interferograms before and after phase unwrapping error correction. Figure 5(d) is the coherence map, where the Xingyuan landslide is isolated by low-coherent pixels, which results in unwrapping error by setting coherence threshold as 0.5 [see Fig. 5(b)]. After several tests, if the coherence threshold is 0.15, the corrected unwrapping phase can be obtained [see Fig. 5(a)]. As expected, the difference between correct and wrong unwrapping phase is phase integer multiplier [see Fig. 5(c)]. Alternatively, robust phase unwrapping method with L0 norm method has been tested and similar results can also be obtained.25 Fig. 5Phase unwrapping comparison with different coherence thresholds of the interferogram pair from February 25, 2012 to March 7, 2012. (a) Phase unwrapping map for the pixel coherence larger than 0.15; (b) phase unwrapping map for the pixel coherence larger than 0.5; (c) difference map between (a) and (b); (d) coherence map. On each panel, dashed rectangular indicates the landslide area.  4.1.3.Interferograms selectionsAs for the landslide deformation monitoring, in order to get continuous deformation results in spatial and temporal domain, especially the deformation results can be inverted as close to the landslide event as possible; four key interferograms and their coherence maps are carefully compared. From Figs. 6(a) to 6(d), we can see the decorrelated areas are altered from region I to IV, which is related to the wheat growth and irrigation in spring, 2012. So the first two interferograms are involved for SBAS calculation. Since February 25, 2012, no deformation can be obtained on the top of Xingyuan landslide (see the explanation of Fig. 10), while the last two interferograms are not considered due to their complete decorrelation. 4.2.Time Series Surface Deformation ResultsBased on 15 good and corrected unwrapping interferograms, time-series deformation results are calculated with least squares method. In Fig. 7, we take November 7, 2011 as the reference date, so the cumulative deformations in LOS direction at each SAR acquisition date are calculated. Fig. 8Cumulative surface deformation within 121 days from November 7, 2011 to March 7, 2012; the red star near Dabaozi village is the reference point, line indicates the location of profile in Fig. 10, and three symbols within right fan show the locations of time-series results of landslide, land subsidence, and well, respectively, in Fig. 11. (a) Google image of Dongfeng landslide that occurred in 2012; (b) Google image of the Xingyuan landslide. 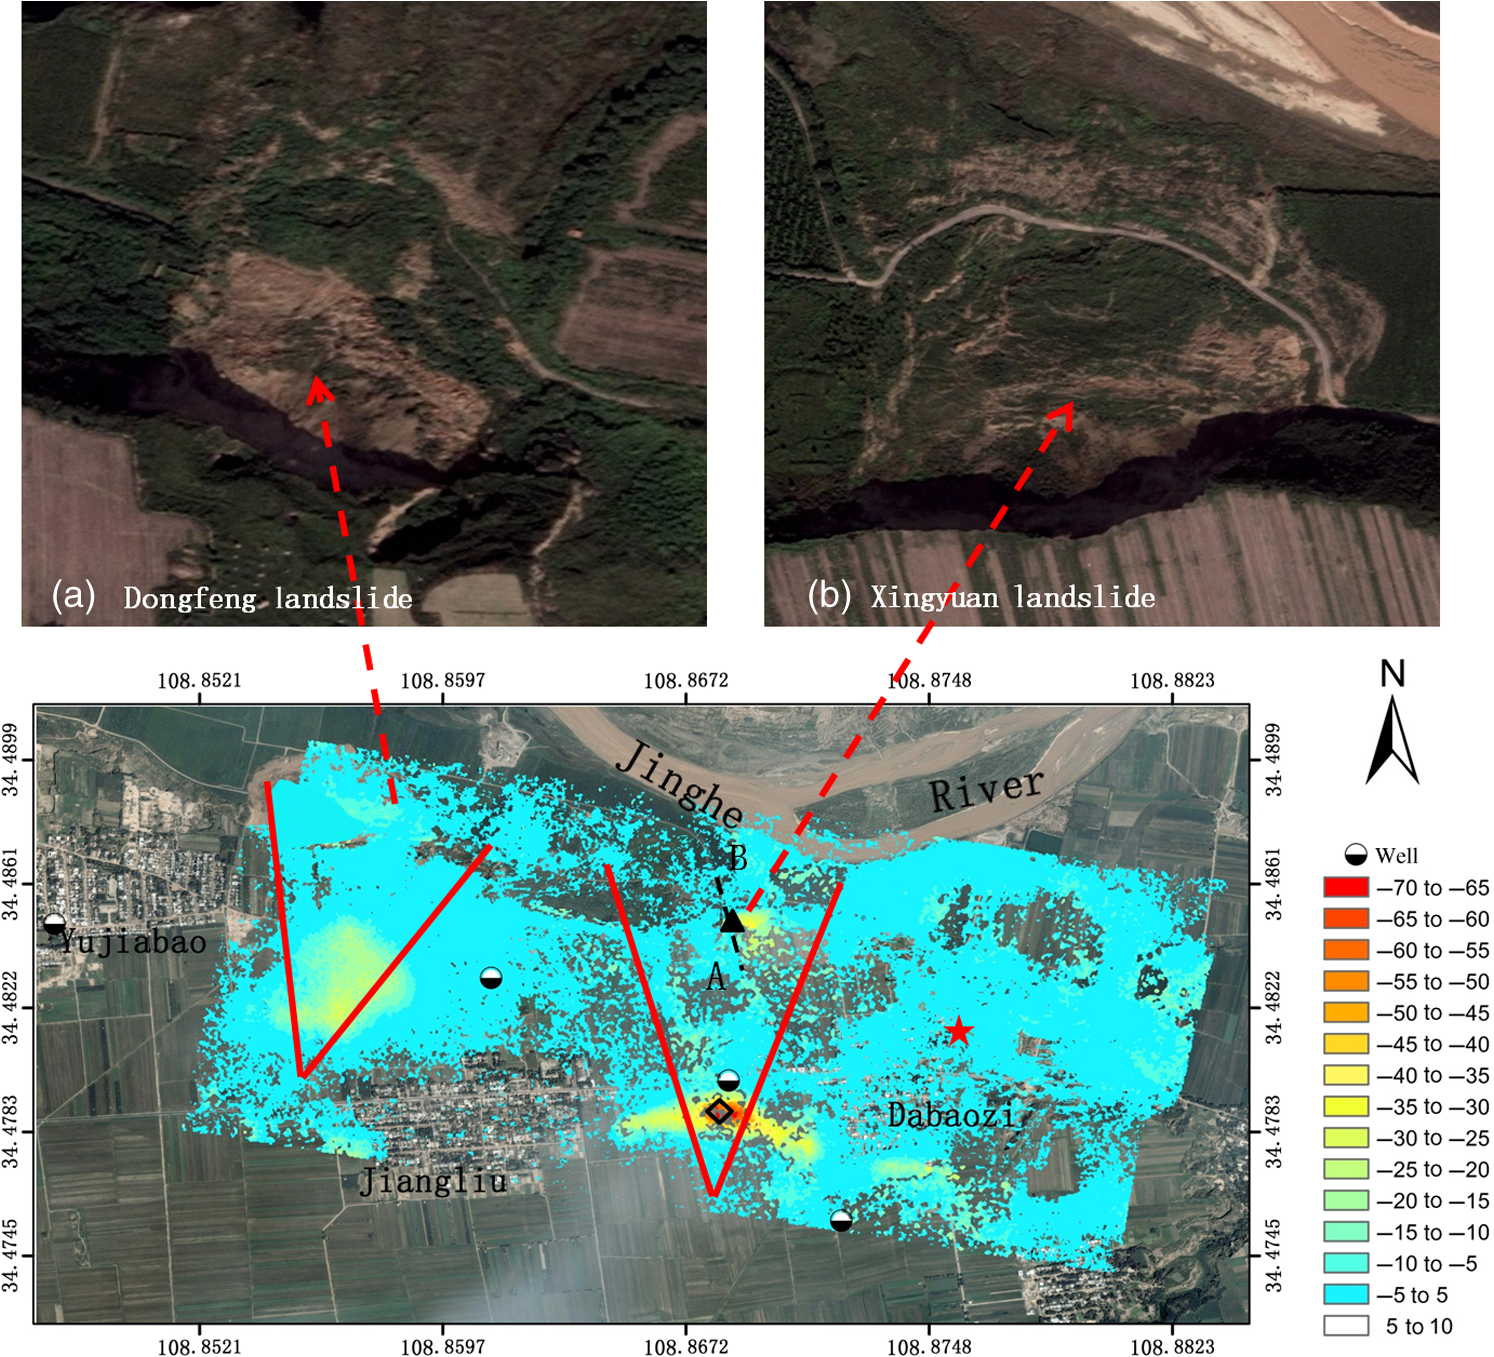 4.3.Small-Scale Loess Landslide DetectionThe loess landslide is so small in spatial domain and temporally decorrelated that both PS-InSAR and large, multilooked SBAS InSAR techniques can hardly detect its location. However, as for the irrigation triggered loess landslides, surface land subsidence and underground water levels are well correlated to the deformation of landslides. Figure 8 is the cumulative surface deformation within 121 days from November 7, 2011 to March 7, 2012, where two land subsidence cones have been successfully mapped and four wells have been investigated in the field. We draw two fans extending to the cliff direction from the center of land subsidence cones, where suspicious landslides can be expected. In this case, two small landslides, namely Dongfeng and Xingyuan, are successfully detected, which both took place in 2012. 4.4.Xingyuan Landslide DeformationWe then focus on the Xingyuan landslide deformation result. According to the geometry of this landslide, that is the mean slope of 40.8 deg and the main azimuth of landslide direction of 325 deg from the north, the downslope deformation within 121 days from November 7, 2011 to March 7, 2012 is calculated and shown in Fig. 9 in three-dimensional perspective. The cumulative time-series deformation along line in Fig. 8 from November 7, 2011 to March 7, 2012 is shown in Fig. 10. Fig. 10Xingyuan landslide time-series deformation profile from January 1 to March 7, 2012 along line in Fig. 8.  From Fig. 9, we can clearly see the spatial deformation distribution of the Xingyuan landslide. The width of this landslide is while its length is only 75 m along the main landslide direction, which has high consistence with the field investigation.13 Furthermore, from Fig. 10, we can also see the landslide length can be divided into two sections, one is on the top of the slope with 15 m in length, and the other is on the slope with around 60 m in length. Obviously, this landslide is very small in spatial domain, so that it can possibly be monitored with high-resolution SAR data and small multilook number SAR processing. From Fig. 10, it is obvious that the deformation mainly concentrated on the slope section; the maximum deformation within 121 days is more than 4 cm located on the top of the slope as indicated with the blue column. The other deformed length is 60 m, which is highly correlated with the slope as indicated with red column. We can also see the abrupt deformation that occurred after February 14, 2012, and nonlinear deformation can be monitored from February 14 to February 25, 2012, and from February 25 to March 7, 2012. However, due to the severe decorrelation on the farmland shown in Fig. 6(a), no useful deformation results can be obtained on the start section of the profile AB since February 25, 2012. Moreover, no good interferograms can be applied to monitor the quite early deformation before April 10, 2012, when the Xingyuan landslide took place. 5.Discussion5.1.Trigger Factor of Xingyuan LandslideThe Xingyuan landslide is one of the typical irrigation triggered loess landslides. In order to uncover the correlation between the Xingyuan landslide and farmland subsidence nearby, the landslide rate and the land subsidence rate in each 11 days are calculated before the Xingyuan landslide, which is shown in Fig. 11. Meanwhile, the values of underground water levels measured on March 16, 2012 and May 25, 2012 are also shown in Fig. 11. We can see the following features: (1) During the 154 days before the Xingyuan landslide one continuous land subsidence cone is identified at to the south of the Xingyuan landslide, covering 570 m by 130 m. Also, the land subsidence rate increased with time. (2) The underground water level increased 5.7 m from March 16 to May 25, 2012; this shows a different mechanism from urban land subsidence. (3) As far as the Xingyuan landslide deformation is concerned, 88 days prior to the landslide is a turning point, after which the landslide rate increased dramatically. The landslide rate increased from 55 days prior to landslide to 33 days prior to the landslide, increasing five times in only 22 days. This is the first report on loess landslide onset time detection with InSAR technique. Unfortunately, due to the lack of monitoring data in 33 days prior to landslide, we cannot get the total deformation during this 33-day interval. Therefore, accelerated preslide deformation gives us an important precursor of landslides, which is important for mitigating potential hazards of landslides. In order to research the irrigation triggered landslide mechanism, physical interpretation of empirical relations should be followed.26,27 Fig. 11Land subsidence and landslide velocity time series before the Xingyuan landslide and underground water-level changes before and after the Xingyuan landslide is demonstrated. The locations of land subsidence, landslide, and well are shown in Fig. 8.  The mechanism of irrigation triggered landslide is based on the relationship between shear strength and water content. Both rainfall and farmland irrigation make the underground water levels increase by charging surface water. Hence, the static and dynamic water pressure is increased, which makes the shear strength decrease; as a result, the landslide takes place. 5.2.Small-Scale Loess Landslide DetectionIn Fig. 11, it can be clearly seen that the deformation of the Xingyuan landslide has high correlation with land subsidence, i.e., the more the land subsidence, the faster the landslide. For the Xingyuan case, we find that the land subsidence has longer deformation history but less deformation rate than that of a landslide when a landslide initiates. From Fig. 8, we can see land subsidence is easy to be monitored with SBAS technique for its larger coverage and continuous deformation. However, it can be difficult to monitor an irrigation triggered loess landslide because of its small spatial coverage, special location, and abrupt deformation in temporal domain. Based on this research, we can first monitor the land subsidence and investigate the underground water level logs. If both continuous land subsidence and the underground water level rising can be monitored, the area that is a certain distance away from the land subsidence center, and satisfies the landslide conditions, has a high probability of being a loess landslide. Accordingly, special investigation means including field works should be taken to verify it. Moreover, the abnormal rainfall and seasonal irrigation will accelerate the landslide. 6.ConclusionSmall-scale loess landslide is very common in the loess plateau of Northwest China, which can result in severe damage to local residents. InSAR technique provides a unique way to recover the preslide time-series deformation results and the deformation related to the landslide. From this research, we can draw the following conclusions. Small loess landslides can be possibly detected with the two-step method, i.e., first detecting large coverage land subsidence with longer deformation history and then closely searching loess landslides within given distances and direction angles according to local topography and hydrology conditions. Two loess landslides are successfully detected in this research corresponding to two land subsidence cones. The inner correlation between land subsidence and landslides must be clear when using this method. Meter level resolution SAR data is one key factor to small-scale loess landslide monitoring. Dense SAR acquisitions and small multilook number are other factors to get detailed time-series deformation results. Reliable time-series results are achieved after taking correction of external DEM error and phase unwrapping errors, when the coherence is poor in the interested region. In addition, the onset time of a loess landslide is successfully uncovered over the Xingyuan landslide. This research method can be referred for any other similar loess landslide monitoring. Continuous increase of preslide deformation rate is monitored for the Xingyuan landslide, and one month later, a landslide occurred, which indicates that preslide deformation rate is a crucial precursor for landslide early warning. Instability process of loess landslide must be carefully analyzed by integrating data from hydrology, geology, and irrigation. AcknowledgmentsTerraSAR data are supplied by DLR under Grant No. LAN2471. This research is funded by the National Program on Key Basic Research Project (973 Program) (Grant No. 2014CB744703) and the Natural Science Foundation of China (Grant Nos. 41372375 and 41304016). ReferencesJ. Zhou et al.,
“Landslide disaster in the loess area of China,”
J. For. Res., 13
(2), 157
–161
(2002). http://dx.doi.org/10.1007/BF02857244 Google Scholar
J. Zhuang and J. Peng,
“A coupled slope cutting—a prolonged rainfall-induced loess landslide: a 17 October 2011 case study,”
Bull. Eng. Geol. Environ., 73
(4), 997
–1011
(2014). http://dx.doi.org/10.1007/s10064-014-0645-1 Google Scholar
D. Zhang et al.,
“A rapid loess flowslide triggered by irrigation in China,”
Landslides, 6
(1), 55
–60
(2009). http://dx.doi.org/10.1007/s10346-008-0135-2 Google Scholar
J. Wang et al.,
“A loess landslide induced by excavation and rainfall,”
Landslides, 11
(1), 141
–152
(2014). http://dx.doi.org/10.1007/s10346-013-0418-0 Google Scholar
M. Zhang and J. Liu,
“Controlling factors of loess landslides in western China,”
Environ. Earth Sci., 59
(8), 1671
–1680
(2010). http://dx.doi.org/10.1007/s12665-009-0149-7 Google Scholar
L. Xu et al.,
“Investigating landslide-related cracks along the edge of two loess platforms in northwest China,”
Earth Surf. Processes Landforms, 37
(10), 1023
–1033
(2012). http://dx.doi.org/10.1002/esp.v37.10 ESPLDB 0197-9337 Google Scholar
L. Xu et al.,
“Landslides in the transitional slopes between a loess platform and river terrace, Northwest China,”
Environ. Eng. Geosci., 17
(3), 267
–279
(2011). http://dx.doi.org/10.2113/gseegeosci.17.3.267 Google Scholar
L. Xu et al.,
“Occurrence of landsliding on slopes where flowsliding had previously occurred: an investigation in a loess platform, North-west China,”
Catena, 104 195
–209
(2013). http://dx.doi.org/10.1016/j.catena.2012.11.010 CIJPD3 0341-8162 Google Scholar
L. Xu et al.,
“Field testing of irrigation effects on the stability of a cliff edge in loess, North-west China,”
Eng. Geol., 120
(1), 10
–17
(2011). http://dx.doi.org/10.1016/j.enggeo.2011.03.007 EGGOAO 0013-7952 Google Scholar
C. Y. Zhao et al.,
“Large-area landslides detection and monitoring with ALOS/PALSAR imagery data over Northern California and Southern Oregon, USA,”
Remote Sens. Environ., 124 348
–359
(2012). http://dx.doi.org/10.1016/j.rse.2012.05.025 RSEEA7 0034-4257 Google Scholar
J. Wasowski and F. Bovenga,
“Investigating landslides and unstable slopes with satellite MultiTemporal Interferometry: Current issues and future perspectives,”
Eng. Geol., 174 103
–138
(2014). http://dx.doi.org/10.1016/j.enggeo.2014.03.003 EGGOAO 0013-7952 Google Scholar
Q. Sun et al.,
“Slope deformation prior to Zhouqu, China landslide from InSAR time series analysis,”
Remote Sens. Environ., 156 45
–57
(2015). http://dx.doi.org/10.1016/j.rse.2014.09.029 RSEEA7 0034-4257 Google Scholar
Z. Duan,
“Study on the trigger mechanism of loess landslide—a case study of the loess landslide in the south bank of lower Jing River,”
Chang’an University, Xi’an,
(2013). Google Scholar
C. Y. Zhao et al.,
“Pre-, co-, and post-rockslide analysis with ALOS/PALSAR imagery data: a case study of Jiweishan rockslide, China,”
Nat. Hazards Earth Syst. Sci., 13 2851
–2861
(2013). http://dx.doi.org/10.5194/nhess-13-2851-2013 1561-8633 Google Scholar
Q. Chen et al.,
“Quantification of mass wasting volume associated with the giant landside Daguangbao induced by the 2008 Wenchuan earthquake from persistent scatterer InSAR,”
Remote Sens. Environ., 152 125
–135
(2014). http://dx.doi.org/10.1016/j.rse.2014.06.002 Google Scholar
G. E. Hilley et al.,
“Dynamics of slow-moving landslides from permanent scatterer analysis,”
Science, 304 1952
–1955
(2004). http://dx.doi.org/10.1126/science.1098821 SCIEAS 0036-8075 Google Scholar
A. Ferretti, C. Prati and F. Rocca,
“Permanent scatterers in SAR interferometry,”
IEEE Trans. Geosci. Remote Sens., 39 8
–20
(2001). http://dx.doi.org/10.1109/36.898661 Google Scholar
A. Hooper, P. Segall and H. Zebker,
“Persistent scatterer interferometric synthetic aperture radar for crustal deformation analysis, with application to Volcán Alcedo, Galápagos,”
J. Geophys. Res., 112 B07407
(2007). http://dx.doi.org/10.1029/2006JB004763 JGREA2 0148-0227 Google Scholar
C. Werner et al.,
“Interferometric point target analysis with JERS-1 L-band SAR data,”
in IEEE Int. Proc. Geoscience and Remote Sensing Symp.,
4359
–4361
(2003). http://dx.doi.org/10.1109/IGARSS.2003.1295515 Google Scholar
F. Berardino et al.,
“A new algorithm for surface deformation monitoring based on small baseline differential SAR interferograms,”
IEEE Trans. Geosci. Remote Sens., 40 2375
–2383
(2002). http://dx.doi.org/10.1109/TGRS.2002.803792 Google Scholar
R. Lanari et al.,
“A small baseline approach for investigating deformation on full resolution differential SAR interferograms,”
IEEE Trans. Geosci. Remote Sens., 42 1377
–1386
(2004). http://dx.doi.org/10.1109/TGRS.2004.828196 Google Scholar
C. W. Chen and H. A. Zebker,
“Two-dimensional phase unwrapping with use of statistical models for cost functions in nonlinear optimization,”
J. Opt. Soc. Am., 18 338
–351
(2001). http://dx.doi.org/10.1364/JOSAA.18.000338 Google Scholar
J. Biggs et al.,
“Multi-interferogram method for measuring interseismic deformation: Denali Fault, Alaska,”
Geophys. J. Int., 170 1165
–1179
(2007). http://dx.doi.org/10.1111/gji.2007.170.issue-3 GJINEA 0956-540X Google Scholar
L. Cascini, G. Fornaro and D. Peduto,
“Advanced low- and full resolution DInSAR map generation for slow-moving landslide analysis at different scales,”
Eng. Geol., 112 29
–42
(2010). http://dx.doi.org/10.1016/j.enggeo.2010.01.003 EGGOAO 0013-7952 Google Scholar
H. Yu, Z. Li and Z. Bao,
“Residues cluster-based segmentation and outlier-detection method for large-scale phase unwrapping,”
IEEE Trans. Image Process., 20 2865
–2875
(2011). http://dx.doi.org/10.1109/TIP.2011.2138148 IIPRE4 1057-7149 Google Scholar
R. M. Iverson,
“Landslide triggering by rain infiltration,”
Water Resour. Res., 36 1897
–1910
(2000). http://dx.doi.org/10.1029/2000WR900090 Google Scholar
R. M. Iverson and J. J. Major,
“Rainfall, groundwater flow, and seasonal movement at Minor Creek landslide, northwestern California: physical interpretation of empirical relations,”
Geol. Soc. Am. Bull., 99 579
–594
(1987). http://dx.doi.org/10.1130/0016-7606(1987)99<579:RGFASM>2.0.CO;2 BUGMAF 0016-7606 Google Scholar
BiographyChaoying Zhao is a professor at the Chang’an University, China. He received his master degree and his PhD in geodesy from Chang’an University in 2002 and 2009, respectively. His current research interests include different InSAR methods and their applications in geo-hazard monitoring, such as land subsidence, ground fissures, landslide, and mining-induced collapse. Qin Zhang is a professor at Chang’an University. She received her PhD in geodesy from Wuhan University in 2002. Her research interests include GPS theory, data processing, and geo-hazard monitoring applications. Yang He is a master student; he is mainly engaged in photogrammetry and remote sensing, and the application of InSAR. Jianbing Peng is a professor at Chang’an University. He obtained his PhD in engineering geology from Chang’an University in 1999. His current research interests include the mechanism of loess landslide and ground fissure. |