|
|
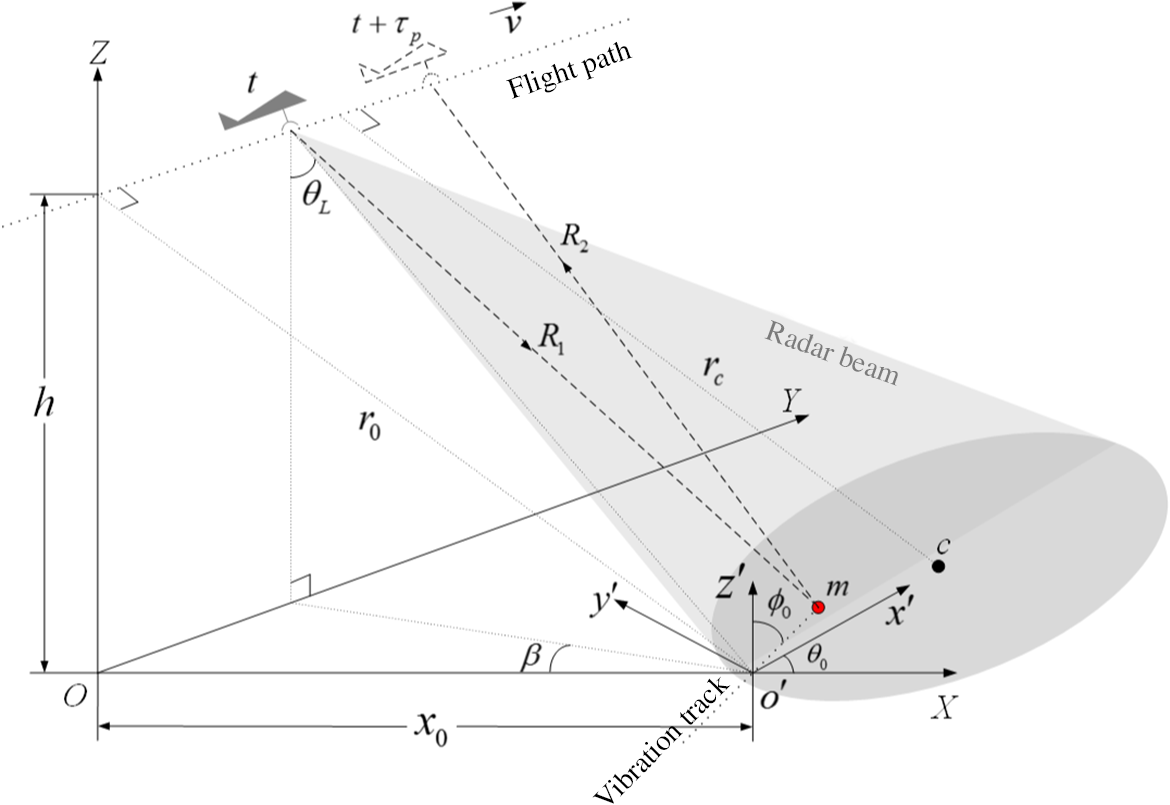
1.IntroductionVibration widely exists in ground targets of interest in radar sensing, such as the engine oscillation of vehicles and tanks, the dynamic response of railway bridges under oncoming trains, and so forth. It generally produces nonlinear frequency modulation, named micro-Doppler effect,1 in radar echoed signals and has attracted much attention in related research.2–4 Synthetic aperture radar (SAR) is a well-established technique for high-resolution imaging of the earth’s surface. In the standard SAR imaging, the high-quality focus could be achieved for stationary objects but is no longer available for microdynamic ones. Nevertheless, the ability of SAR to remotely sense vibrating targets with high accuracy is essential in its practical applications. For example, focused images and vibration parameter estimation play an important role in feature analysis and recognition of SAR vibrating targets of interest. In past years, many contributions have been made to SAR and inverse SAR imaging of microdynamic targets, including micromotion signal parameter estimation,5–9 micromotion characteristic analysis,10,11 micromotion signal separation,12–19 and SAR imaging of targets with rotating components.20–22 Different from stationary targets, Doppler frequency of vibrating targets is sinusoidally time-varying. As a result, in conventional SAR imaging algorithms, unwanted paired echoes would occur, causing the defocus in the azimuth direction and the energy spread in the range direction. This phenomenon is defined as smearing of paired echoes.23 The specific reason of such degradation is that the range migration curves induced by vibration cannot fully be confined into one range gate. The keystone transform (KT) is a well-known algorithm for range cell migration correction without motion parameters. Although, the traditional KT algorithm has achieved the compensation of range walk in SAR imaging of moving targets,24 the range curvature cannot be corrected. To solve this defect, the Doppler keystone transform (DKT) algorithm25 is then proposed. It corrects range cell migration in the two-dimensional (2-D) frequency domain,26 indicating the feasibility of DKT for vibrating targets by Bessel series expansion of the vibration signal. In Ref. 27, a DKT-based method of vibrating target imaging in pulsed SAR, in particular, is proposed. Moreover, a nonlinear KT method is presented in Refs. 28 and 29 to correct the range migration of small maritime targets under polarimetric mode of ISAR. Comprehensive comparisons between several interpolation algorithms in different cases of polarized signatures are performed. It makes sense of its practical application in micromotion target imaging. Most of the aforementioned studies and methods are developed in pulsed mode. However, in some practical situations, flight platforms need lightweight and cost-effective imaging sensors. For example, compact-size sensors are always required by unmanned aerial vehicles for frequent visits at low cost, and lightweight sensors are easy for deployment and maintenance on helicopters. Hence the frequency-modulation continuous-wave (FMCW) technology is introduced into SAR to produce lightweight and cost-effective imaging sensors with high resolution.30 Such FMCW-SAR is of great interest to civil application for their low-cost and to military use for their small size. But under the FMCW mode, the varying slant range during pulse transmission could result in different delay times of the pulse leading and trailing edges.31 This suggests that the conventional start/stop approximation is not valid in FMCW-SAR since the variation of delay time caused by the continuous motion of sensor platform within an individual pulse should be considered. In this paper, we begin with a signal model, which accurately represents the effect of variation of the instantaneous slant range during the pulse time on transmitted and echoed signals. This variation is related to pulse time and flight velocity of sensor platform. Next, the imaging method is proposed through the following steps. First, the signal after dechirp and deskew is decomposed into the form of Bessel series in the azimuth direction. This is applicable to both stationary and vibrating targets and is key to their imaging. Second, the influence of continuous motion of sensor platform on the azimuth frequency is eliminated in 2-D frequency domain, and then the phase of each series meets the requirement of DKT. Because DKT makes the azimuth and the range frequency domain decoupling, the range walk is eliminated. Third, the azimuth quadratic phase compensation and the range curvature correction are performed in the range-Doppler domain. Even if there are several vibrating targets in the scene, the azimuth quadratic phase can be fully compensated. Moreover, after these three steps, paired echoes still have residual video phase (RVP) along the azimuth, which needs to be removed. By now, both the vibrating and the stationary target focusing can be accomplished simultaneously. On the basis of paired echo focusing, this paper further uses the method in Ref. 27 for suppression of paired echoes. Deghosted vibrating targets are then obtained. Since the focusing algorithm does not require a priori knowledge of vibrating targets, it is suitable for multiple targets with various vibrating states. It should be noted that the focusing algorithm proposed in this paper is based on FMCW signal mode and DKT. Hence, for simplification, we refer to it as the FMCW keystone transform algorithm (FMCW-KTA). This paper is organized as follows. The signal model in FMCW system is derived in Sec. 2. The imaging algorithm is described in Sec. 3. Simulations are provided in Sec. 4. Finally, conclusions are presented in Sec. 5. 2.Signal ModelIn this paper, we consider the FMCW-SAR geometry, as shown in Fig. 1. Let the time be the round-trip delay time for the wave propagation. The signal is transmitted at an arbitrary time along a slant range and returns back at time along another slant range from the target to the radar. A vibrating point target oscillates in the plane with as the vibration center. The angle between the vibration direction and axis is . The coordinate system is obtained as follows: first, we translate the coordinate system along the axis with distance . Then, we rotate the coordinate counterclockwise through an angle around the axis . The instantaneous vibration amplitude is where is amplitude, is vibration frequency, and is initial phase. The slant range history of vibrating signal has been derived in Refs. 11 and 27. Thus, expressions of and could directly be given as where is the closest range from the antenna to point , is the flight velocity, and denotes the zero Doppler time at . is usually only a few degrees. We consider that the look angle does not vary over slow time in a synthetic aperture. associated with the geometric angle is also constant.27 Obviously, we can express the round-way delay time as where denotes speed of light. Substituting Eqs. (2) and (3) into Eq. (4), we get We define as the equivalent amplitude. By solving Eq. (5), we get where . The “Doppler factor” could be defined asBy using Eq. (6), the echoed signal can be expressed as where is the rectangular window function, and is the pulse width, which equals as a result of transmitted FMCW signal. Here “prf” denotes pulse repetition frequency. is the synthetic aperture time, is the beam center crossing time, is the frequency modulation rate, is the carrier frequency, and is fast time with pulse center as origin. Assume that the scattering coefficient is unit. We use the dechirp-on-receive technique to reduce the sampling requirements by mixing the received and transmitted signals.23 And the output of the mixer is then low-pass filtered before being sampled. Echoed signals from the scene of interest usually have high frequency resulting from the characteristics of FMCW system. In order to demodulate the frequency spectrum of echo signal to the baseband, the reference signal is delayed of as where is the time delay of reference signal, and is the reference slant range. The dechirped signal can be expressed as where and . represents the complex conjugate of the reference signal.3.Vibrating Target Focusing AlgorithmThis section describes the focusing algorithm of vibrating targets in FMCW-SAR shown in Fig. 2. In Eq. (10), the last exponential term is well known as RVP. It could be eliminated by the deskew method, which comprises Fourier transform (FT), phase multiplication, and inverse FT.23,31 After the RVP removal, we get Performing the time–frequency substitution of yields where is the bandwidth of radar signal. Substituting Eq. (6) into Eq. (12), and approximating with the quadratic polynomial in terms of , we getThe last term of Eq. (13) is the phase induced by vibration and can be expanded into the Bessel series27 where is the n’th Bessel function, and . Using the FT to Eq. (14) in azimuth time domain, the signal could be described as where the symbol “*” denotes convolution operator, andNormally the carrier frequency is much larger than the signal bandwidth. Equation (16) is approximately equal to the Doppler rate of the transmitted signal . Equation (17) denotes the azimuth center frequency. Compared with the pulsed mode in Ref. 27, Eqs. (18) and (19) are the additional terms caused by continuous motion of platform. After convolution, Eq. (15) is expressed as where . In Eq. (18), when the flight speed is known, can be eliminated through shifting the signal along the azimuth direction in the 2-D frequency domain. Thus, performing the substitution of yields Substituting Eqs. (16) into (21), and after expansion of the quadratic phase in the last term of Eq. (21), we obtain We define Then substituting Eqs. (23) into (22) and using KT, we obtainAlthough the range walk is eliminated, the range curvature in response to the term in Eq. (24) still exists. This means that the range curvature correction cannot be implemented in the 2-D frequency domain. In addition, a time-domain related item in the coefficient of the term also needs to be compensated. Hence, we take inverse FT of Eq. (24) along the azimuth direction and then get the signal in range-Doppler domain as where is the carrier wavelength. To remove the phase term of from Eq. (25), the interpolation method is utilized here. First, an interpolation kernel is created as Then taking convolution of Eqs. (25) and (26), we getWe can see that the signal energy has been confined into a single range gate with the help of the range cell migration correction. Moreover, to process signal along the azimuth direction, we construct reference function where denotes slant range. Multiplying Eq. (27) by (28), the azimuth quadratic phase is compensated. We getNote that there exists the RVP of paired echoes in Eq. (29) along the azimuth. The RVP will result in the displacement of frequency history between paired echoes over a coherent processing interval. The detailed removal process of the RVP of paired echo has been discussed in Ref. 27. After the RVP removal, the signal in 2-D time domain is expressed as where and denotes the order of paired echoes. Particularly, indicates that the mainlobe is located in the vibration center, while responds to paired echoes symmetrically located on both sides of the mainlobe. denotes the relative time between the ’th paired echo and the mainlobe. Equation (30) indicates that both range walk and range curvature have successfully been corrected along the azimuth direction, and the position of paired echoes is determined by the vibration frequency . Furthermore, it is obvious that the algorithm is suitable for imaging of both stationary and vibrating targets because no vibration parameter is required in the whole process.Next, we continue to explore Eq. (30) to get its expression in range-Doppler domain. After taking the FT of Eq. (30), we get where . The integrand in Eq. (31) has significant magnitude only for . For any SAR with moderate or finer resolution, the time bandwidth product is numerically large enough to meet . Equation (31) is reasonably approximated asAfter combination of series, the signal after RVP removal in range-Doppler domain is described as It indicates the azimuth frequency of all paired echoes spans . Equation (33) is the signal in range-Doppler domain after FMCW-KTA processing. In the case of known flight speed, if vibration parameters are estimated, we can observe that the last term of Eq. (33), the vibration modulated phase error, could be compensated. The method on paired echo suppression in Ref. 27 can be used to estimate vibration parameters for the phase error compensation. After elimination of the vibration phase error, the signal in Eq. (33) could be transformed into 2-D time domain Now it can be seen that the deghosted image of vibrating targets is ultimately obtained. 4.SimulationsTable 1 lists the system parameters used in simulations. Three groups of simulations are presented herein. Section 4.1 is the paired echo focusing experiment. In this section, precise simulation and response analysis in time domain are performed. Comparison results with the conventional algorithm are also given to assess the focusing performance. Section 4.2 describes imaging results of multiple targets with various vibrating states. Section 4.3 presents imaging results of an extended scene with vibration. Table 1Simulation parameters.
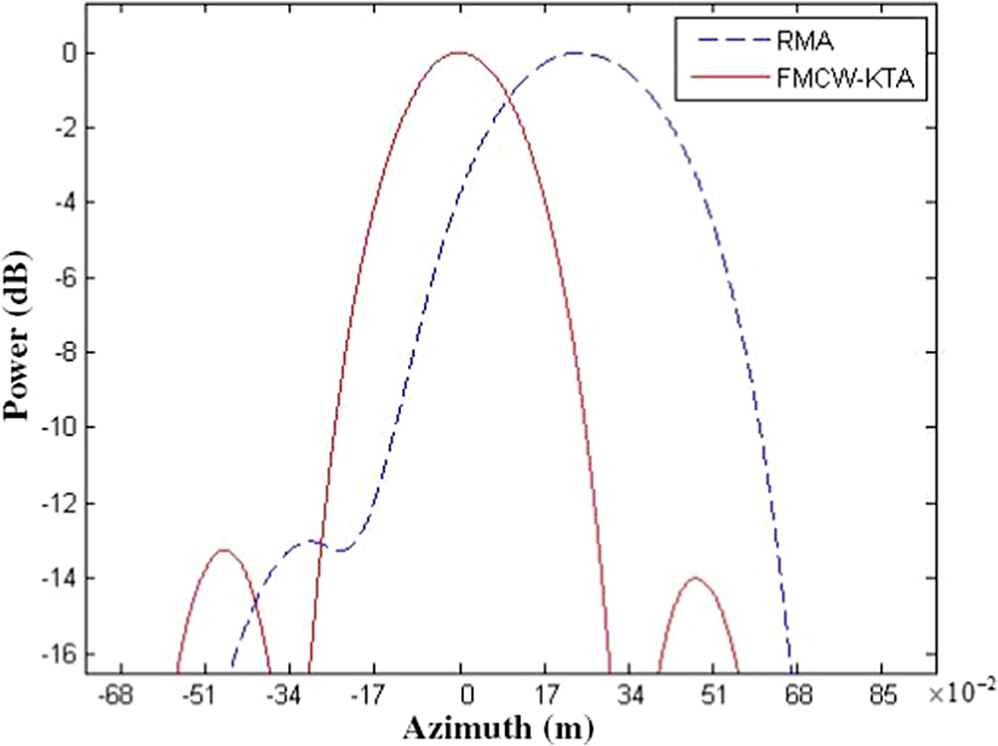
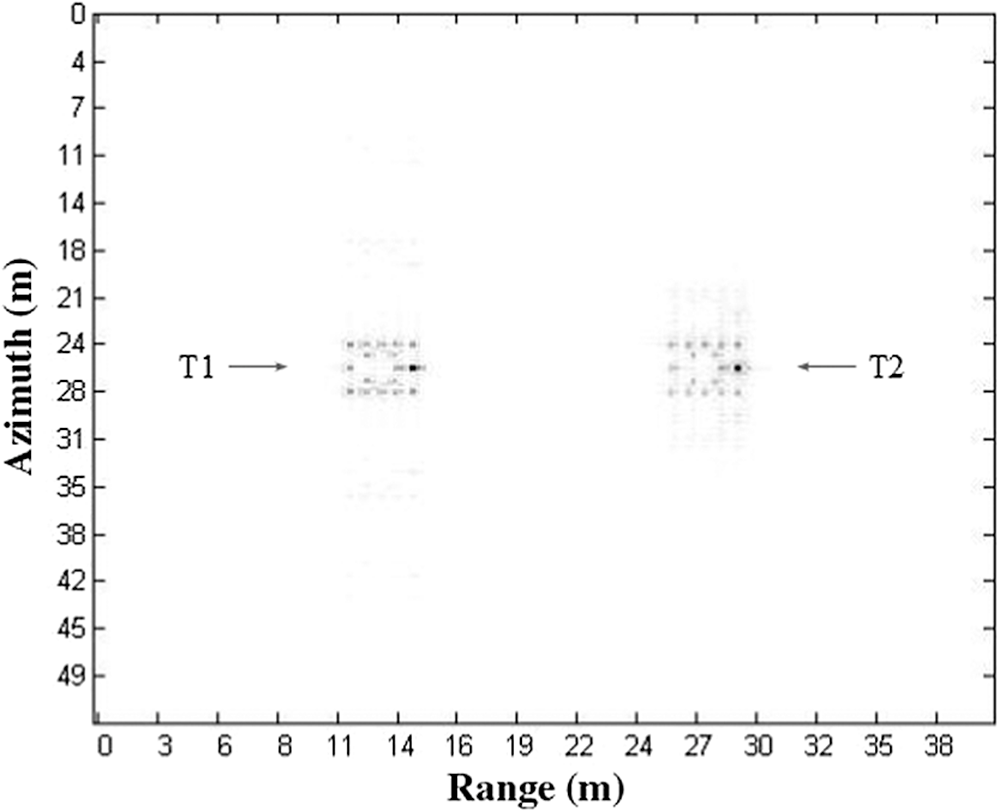
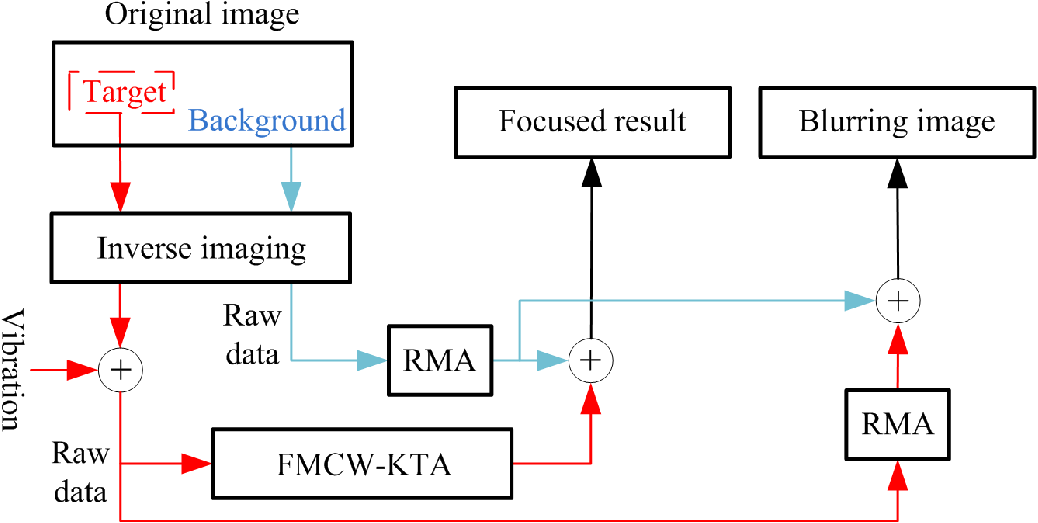
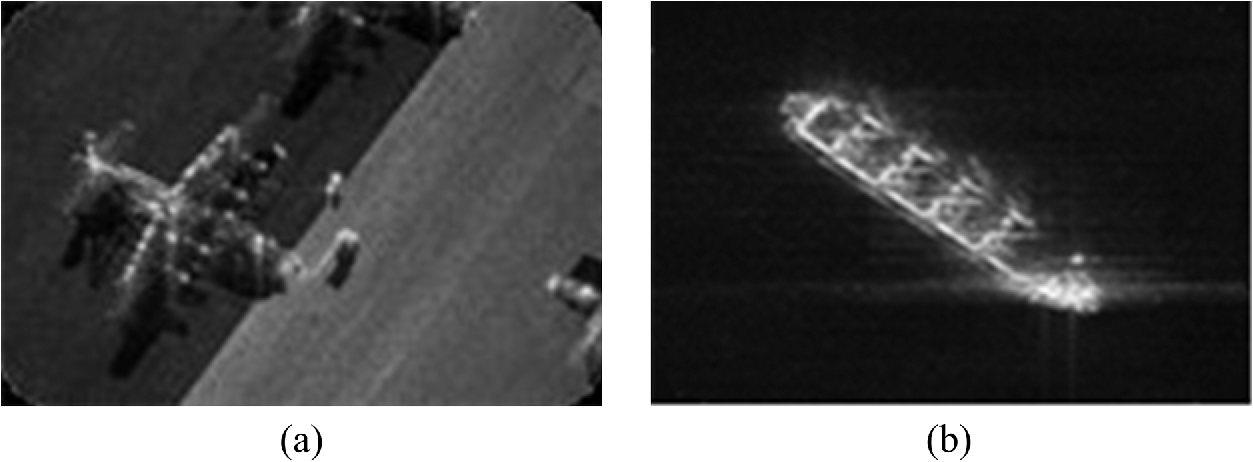
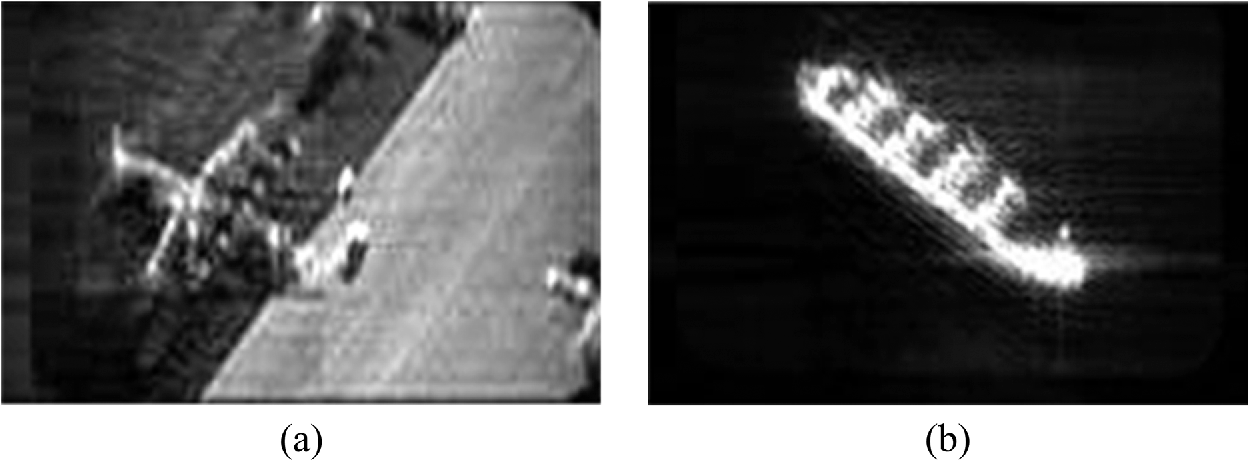
4.1.Focusing Quality AnalysisFigure 3 shows the experimental scene. We set three vibrating point targets T1, T2, and T3 on the ground. These targets have equal intervals of 1 m along the range direction. Another two stationary point targets are set as reference. The involved geometric angles and are considered (see Fig. 1). The real data experiments in Refs. 4 and 27 show that the vibration frequency of vehicle is close to 30 Hz, and the vibration amplitude is of the order of millimeter. Therefore, three vibrating targets are assumed to oscillate identically with vibration frequency of 30 Hz, amplitude of 0.003 m, and initial phase of . One of the three targets is selected to perform the focusing quality analysis. The range migration algorithm (RMA) is adopted for comparison with FMCW-KTA. Their imaging results are shown in Figs. 4 and 5, respectively. The 2-D images are unfavorable to observe their imaging difference by the naked eye. Thus, the impulse response analysis is performed. In particular, taking the paired echo of T1 as an example, we compare its power responses under RMA and FMCW-KTA in azimuth and range directions, respectively. Figures 6 and 7 show that the half-power width in azimuth is 0.33 m by RMA and 0.30 m by FMCW-KTA, while in the range direction, the half-power width is 0.32 m by RMA and 0.25 m by FMCW-KTA. For other paired echoes farther from mainlobe, half-power widths in RMA become worse, but the results of FMCW-KTA remain unchanged. Paired echoes using FMCW-KTA have better focus in both directions than those using RMA. We also give the results of the two algorithms in range-Doppler domain, as shown in Figs. 8 and 9, respectively. It is obvious that the result of RMA still contains residual cell migration induced by vibration, while the range cell migration is corrected into a range gate by FMCW-KTA. 4.2.Imaging of Multiple Targets with Various Vibrating StatesIn this section, two tanks T1 and T2 with different vibrating states are simulated using the ideal point scatterer model. The experiment scene is shown in Fig. 10. We set parameters of T1 and T2 as amplitudes of 0.003 and 0.002 m, and vibration frequencies of 40 and 20 Hz, respectively. Figure 11 shows the imaging result by FMCW-KTA, where both mainlobes and paired echoes of T1 and T2 are focused. It can be observed that higher vibration frequency results in greater distance between the mainlobe and paired echoes. This phenomenon is also consistent with the property of Eq. (30). Furthermore, we use the method of paired echo suppression in Ref. 27 to estimate the vibration parameters of two tanks, i.e., 0.0028 m and 40.7 Hz for amplitude and frequency, respectively, of T1, and 0.0016 m and 19.6 Hz for those of T2. Based on these estimates, the vibration modulated phase error can be compensated. Finally, deghosted results of T1 and T2 are achieved as shown in Fig. 12. 4.3.Imaging of an Extended Scene with VibrationIn most scenarios, SAR vibrating targets are not ideal scattering points but arbitrarily shaped objects with complicated scattering structure. To validate the proposed method on the extended scene, an experiment procedure, as shown in Fig. 13, is adopted. First, we extract the target data from the original SAR image. Then, using inverse imaging methods,32 the raw data of the target and background can be retrieved. Next, the synthetic data are produced by adding vibration into the raw data of target in frequency domain. Finally, FMCW-KTA and RMA are carried out to process the synthetic vibration data, respectively. In order to facilitate results comparison with the original image, the results of processed target are superposed on the background image. The original images are released by Sandia Lab,33 as shown in Fig. 14. They are normal SAR data from stationary targets. According to the procedure mentioned above, we add vibration with frequency of 10 Hz and amplitude of 3 mm into the raw data of an airplane target. The similar process is also repeated to the raw data of a ship target. Then RMA is used, and its imaging results are shown in Fig. 15. We can see that vibrating targets blur SAR images significantly because of the time-varying Doppler frequency. In Ref. 7, vibration-induced artifacts are reduced by time-frequency analysis methods on the processed SAR images. In this paper, the analytical method is introduced to solve the vibration problem since it can avoid the influence of signal-to-clutter ratio to the largest extent. Finally, FMCW-KTA is applied to process the synthetic vibration data, as shown in Fig. 16. It is obvious that the paired echoes of vibrating targets are significantly suppressed and the focused results are close to the original images. Although the actual vibration of some ground targets is much more complicated, this experiment could still indicate the potential effectiveness of the proposed method on complex scattering targets. Moreover, it should be noted that only vibration problem is considered in the simulation of maritime targets while more factors in practice also have an influence on the imaging of such objects. 5.ConclusionThis paper proposes a method on the FMCW-SAR imaging of vibrating targets. We develop a signal model of vibrating targets in FMCW-SAR and take into account continuous motion of platform during pulse time. Based on the signal model, the influence of platform motion is eliminated after dechirp and deskew processes in 2-D frequency domain. The DKT is employed to correct the range cell migration induced by vibration without a priori knowledge of vibrating targets. Then the azimuth quadratic phase compensation is skillfully eliminated in range-Doppler domain. Thus, the range cell migration curves of vibrating targets can be corrected into a range resolution cell, and the mainlobe and paired echoes of vibrating targets are focused in the nominal resolution unit. Moreover, the formula of the RVP of paired echoes is derived. After the RVP removal, we obtain the analytical formula of the vibration phase error in FMCW-SAR. Finally, vibration parameters of the target are estimated for the purpose of compensation of the vibration modulated phase error. Simulation results show that focused and deghosted images of vibrating targets can be obtained even with various vibrating states. AcknowledgmentsThis study was cosupported by the National Natural Science Foundation of China (Nos. 61471019 and 61501011) and the Fundamental Research Funds for the Central Universities (No. YWF-15-GJSYS-068). ReferencesV. C. Chen et al.,
“Analysis of micro-Doppler signatures,”
IEEE Proc. Radar Sonar Navig., 150 271
–276
(2003). http://dx.doi.org/10.1049/ip-rsn:20030743 IETPAK 0018-926X Google Scholar
V. C. Chen,
“Analysis of radar micro-Doppler signature with time-frequency transform,”
in Proc. of the Tenth IEEE Workshop on Statistical Signal and Array Processing,
463
–466
(2000). http://dx.doi.org/10.1109/SSAP.2000.870167 Google Scholar
T. Thayaparan et al.,
“Analysis of radar micro-Doppler signatures from experimental helicopter and human data,”
IET Radar Sonar Navig., 1 289
–299
(2007). http://dx.doi.org/10.1049/iet-rsn:20060103 Google Scholar
M. Rüegg, E. Meier and D. Nüesch,
“Vibration and rotation in millimeter-wave SAR,”
IEEE Trans. Geosci. Remote Sens., 45 293
–304
(2007). http://dx.doi.org/10.1109/TGRS.2006.887025 IGRSD2 0196-2892 Google Scholar
Q. Wang et al.,
“SAR-based vibration estimation using the discrete fractional Fourier transform,”
IEEE Trans. Geosci. Remote Sens., 50 4145
–4156
(2012). http://dx.doi.org/10.1109/TGRS.2012.2187665 IGRSD2 0196-2892 Google Scholar
P. Lei et al.,
“Micromotion parameter estimation of free rigid targets based on radar micro-Doppler,”
IEEE Trans. Geosci. Remote Sens., 50 3776
–3786
(2012). http://dx.doi.org/10.1109/TGRS.2012.2185244 IGRSD2 0196-2892 Google Scholar
Q. Wang et al.,
“Reduction of vibration induced artifacts in synthetic aperture radar imagery,”
IEEE Trans. Geosci. Remote Sens., 52 3063
–3073
(2014). http://dx.doi.org/10.1109/TGRS.2013.2269138 IGRSD2 0196-2892 Google Scholar
P. Setlur, M. Amin and T. Thayaparan,
“Micro-Doppler signal estimation for vibrating and rotating targets,”
in Proc. Int. Symp. Signal Processing Application,
639
–642
(2005). Google Scholar
P. Molchanov et al.,
“On micro-Doppler period estimation,”
in Proc. Int. Conf. Control System Computer Science,
325
–330
(2013). Google Scholar
X. Liu, H. Leung and G. A. Lampropoulos,
“Effects of non-uniform motion in through-the-wall SAR imaging,”
IEEE Trans. Antennas Propag., 57 3539
–3548
(2009). http://dx.doi.org/10.1109/TAP.2008.2009743 Google Scholar
X. Li et al.,
“The influence of target micromotion on SAR and GMTI,”
IEEE Trans. Geosci. Remote Sens., 49 2738
–2751
(2011). http://dx.doi.org/10.1109/TGRS.2011.2104965 IGRSD2 0196-2892 Google Scholar
C. Clemente et al.,
“Developments in target micro-Doppler signatures analysis: radar imaging, ultrasound and through-the-wall radar,”
EURASIP J. Adv. Signal Process., 1 1
–18
(2013). http://dx.doi.org/10.1186/1687-6180-2013-47 Google Scholar
C. Clemente and J. J. Soraghan,
“Analysis of the effect of wind turbines in SAR images,”
in IET Int. Conf. on Radar Systems (Radar 2012),
1
–4
(2014). Google Scholar
C. Clemente and J. J. Soraghan,
“Vibrating target micro-Doppler signature in bistatic SAR with a fixed receiver,”
IEEE Trans. Geosci. Remote Sens., 50 3219
–3227
(2012). http://dx.doi.org/10.1109/TGRS.2011.2180394 IGRSD2 0196-2892 Google Scholar
C. Clemente and J. J. Soraghan,
“Vibrating micro-Doppler signature extraction from SAR data using singular value decomposition,”
in Proc. EUSAR Conf.,
191
–194
(2012). Google Scholar
B. Yuan, Z. Chen and S. Xu,
“Micro-Doppler analysis and separation based on complex local mean decomposition for aircraft with fast-rotating parts in ISAR imaging,”
IEEE Trans. Geosci. Remote Sens., 52 1285
–1298
(2014). http://dx.doi.org/10.1109/TGRS.2013.2249588 IGRSD2 0196-2892 Google Scholar
L. Stankovic et al.,
“Micro-Doppler removal in the radar imaging analysis,”
IEEE Trans. Aerosp. Electron. Syst., 49 1234
–1250
(2013). http://dx.doi.org/10.1109/TAES.2013.6494410 IEARAX 0018-9251 Google Scholar
L. Stankovic, I. Djurovic and T. Thayaparan,
“Separation of target rigid body and micro-Doppler effects in ISAR imaging,”
IEEE Trans. Aerosp. Electron. Syst., 42 1496
–1506
(2006). http://dx.doi.org/10.1109/TAES.2006.314590 IEARAX 0018-9251 Google Scholar
J. Li and H. Ling,
“Application of adaptive chirplet representation for ISAR feature extraction from targets with rotating parts,”
Proc. Inst. Elect. Eng. Radar Sonar Navig., 150 284
–291
(2003). http://dx.doi.org/10.1049/ip-rsn:20030729 Google Scholar
M. Adjrad and K. Woodbridge,
“Imaging of micro motion targets with unknown number of rotating parts based on time-frequency analysis,”
in Proc. IET Int. Conf. Radar System,
1
–5
(2012). Google Scholar
Q. Zhang et al.,
“Imaging of a moving target with rotating parts based on the Hough transform,”
IEEE Trans. Geosci. Remote Sens., 46 291
–299
(2008). http://dx.doi.org/10.1109/TGRS.2007.907105 IGRSD2 0196-2892 Google Scholar
X. Bai et al.,
“Imaging of micro motion targets with rotating parts based on empirical-mode decomposition,”
IEEE Trans. Geosci. Remote Sens., 46 3514
–3523
(2008). http://dx.doi.org/10.1109/TGRS.2008.2002322 IGRSD2 0196-2892 Google Scholar
W. G. Carrara, R. S. Goodman and R. M. Majewski, Spotlight Synthetic Aperture Radar: Signal Processing Algorithms, 386
–399 1st ed.Artech House, London, UK
(1995). Google Scholar
R. P. Perry, R. C. Dipietro and R. L. Fante,
“SAR imaging of moving targets,”
IEEE Trans. Aerosp. Electron. Syst., 35 188
–200
(1999). http://dx.doi.org/10.1109/7.745691 IEARAX 0018-9251 Google Scholar
G. Li, X. Xia and Y. Peng,
“Doppler keystone transform: an approach suitable for parallel implementation of SAR moving target imaging,”
IEEE Geosci. Remote Sens. Lett., 5 573
–577
(2008). http://dx.doi.org/10.1109/LGRS.2008.2000621 Google Scholar
B. Deng,
“Research on synthetic aperture radar micro-motion target indication,”
University Defense Technology,
(2011). Google Scholar
Y. Zhang et al.,
“SAR-based paired echo focusing and suppression of vibrating targets,”
IEEE Trans. Geosci. Remote Sens., 52 7593
–7605
(2014). http://dx.doi.org/10.1109/TGRS.2014.2314681 IGRSD2 0196-2892 Google Scholar
F. Sadjadi,
“New comparative experiments in range migration mitigation methods using polarimetric inverse synthetic aperture radar signatures of small boats,”
in IEEE Radar Conf.,
613
–616
(2014). Google Scholar
F. A. Sadjadi,
“New experiments in inverse synthetic aperture radar image exploitation for maritime surveillance,”
Proc. SPIE, 9090 909009
(2014). http://dx.doi.org/10.1117/12.2053797 PSISDG 0277-786X Google Scholar
A. F. Scannapieco, A. Renga and A. Moccia,
“Preliminary study of a millimeterwave FMCW InSAR for UAS indoor navigation,”
Sensors, 15 2309
–2335
(2015). http://dx.doi.org/10.3390/s150202309 SNSRES 0746-9462 Google Scholar
R. Wang et al.,
“Focus FMCW SAR data using the wavenumber domain algorithm,”
IEEE Trans. Geosci. Remote Sens., 48 2109
–2118
(2010). http://dx.doi.org/10.1109/TGRS.2009.2034368 IGRSD2 0196-2892 Google Scholar
M. Martorella et al.,
“ISAR based technique for refocusing non-cooperative targets in SAR images,”
IET Radar Sonar Navig., 6 332
–340
(2012). http://dx.doi.org/10.1049/iet-rsn.2011.0310 Google Scholar
BiographyYuxin Hu received his PhD from the Graduate School of Chinese Academy of Sciences, Beijing, China, in 2007. Currently, he is an associate professor with the Key Laboratory of Technology in Geospatial Information Processing and Applied Systems, Chinese Academy of Sciences, and the Institute of Electronics, Chinese Academy of Sciences (IECAS). His research interests include SAR data processing and implementation of SAR processing system. Yuan Zhang received his BS and MSc degrees from Beihang University, Beijing, China, in 2004 and 2008, respectively. Currently, he is working toward a PhD in signal and information processing. He joined the IECAS in 2008. He has been a guest scientist at the German Aerospace Center and the Technical University of Munich since 2015. His research interests are SAR and modern signal processing for earth observation. Jinping Sun received his MSc and PhD degrees from Beihang University (BUAA), Beijing, China, in 1998 and 2001, respectively. Currently, he is a professor with the School of Electronic and Information Engineering, BUAA. His research interests include high-resolution radar signal processing, image understanding, and robust beamforming. Peng Lei received his BS and PhD degrees in electrical engineering from Beihang University (BUAA), Beijing, China, in 2006 and 2012, respectively. Currently, he is an assistant professor with the School of Electronic and Information Engineering, BUAA. His research interests include signal processing, especially in time-frequency analysis and spectral estimation, image processing, and target recognition. He was the recipient of the 2011 IEEE IGARSS Student Travel Grant. |