
|
|
1.IntroductionA landslide is a geological occurrence that can cause severe loss of life, agricultural production, and the environment. Landslide disasters occur almost every year, and response time is a crucial factor in the effectiveness of postdisaster relief in such situations. In order to adequately provide emergency relief, decision makers and rescue organizations need a global perspective on the situation onsite.1 With the development of satellite and airborne remote-sensing technologies, the outputs of very high-resolution (VHR) optical images and synthetic aperture radar (SAR) images have shown a marked improvement in quality.2 These images have been widely used in a variety of fields that use remote sensing, one of which is image processing for postdisaster emergency response. The main objective of this paper is to devise a method for convenient and efficient building damage assessment based on an analysis of images of these structures in areas affected by landslides. According to our survey of the literature, research on building damage assessment has focused on this task against the backdrop of earthquakes. Chesnel et al.3 proposed a semiautomatic damage assessment method based on a pair of very high-spatial resolution images and some ancillary data. Their system assessed damage to buildings using the change detection method. Klonus et al.4 proposed a modified change detection method based on isotropic frequency filtering, spectral and texture analysis, and segmentation, which yielded superior accuracy to standard methods. Although conventional change detection methods always work well in assessing building damage, their anti-interference ability is poor. Their results are easily influenced by natural factors, such as the solar incident angle, seasonal variation, and the Earth’s surface humidity. Li et al.5 detected building damage in urban environments from multitemporal VHR image data using the one-class support vector machine. This method performed better at the object level than at the pixel level, with an overall accuracy of 82.33%. Gerke and Kerle6 proposed a two-step approach for building damage classification. This method yielded an overall classification accuracy of 70% for four classes and a building damage identification accuracy of 63%. Although high-classification accuracy can be obtained, it is premised on the airborne, oblique pictometry imagery available. In addition to research that has used high-resolution optical images, other studies have been conducted based on SAR images to consider the impact of climatic conditions and occlusion on the optical images.7–11 These methods have yielded satisfactory assessment results, but they cannot be generalized to other types of disasters, such as landslides. Thus, in this study, we design an automatic damage assessment framework for buildings in the aftermath of landslides according to the characteristics of the damage caused. The proposed framework first exploits object-based classification to detect landslides and combines the detection results and a building damage classification model (BDCM) to realize the entire assessment process. In particular, the main contributions of this paper are as follows:
The remainder of this paper is organized as follows: In Sec. 2, we review related literature. Section 3 consists of a description of the morphological quantitative scheme for building damage caused by landslides. In Sec. 4, the proposed assessment framework is described in detail. Experiments to test the proposed framework are detailed in Sec. 5, and our conclusions are given in Sec. 6. 2.Related WorkLandslide detection is clearly required before damage to a building can be assessed. In recent years, research on landslide detection has developed quite rapidly. Methods based on varying sensor data have been exploited to discriminate landslide-affected regions from the background and analyze them. Since optical images may carry many spectral characteristics and details of the target, they are widely used. Research on landslide detection based on optical images can be divided into two types: pixel-based methods and object-oriented methods. In opposition to the former, which mainly consider spectral and textural features,12,13 the latter class of methods enables the consideration of more complex and advanced features.14–17 To improve detection accuracy, some classical machine learning classification methods have been applied to remote-sensing image classification. These include support vector machines,18,19 artificial neural networks,20 and methods based on fuzzy theory.14,21 Studies show that these methods have achieved satisfactory classification effect based on VHR images. Sometimes, weather in a disaster region is persistently foggy and cloudy following a hazardous occurrence. In this situation, SAR images are particularly useful due to their unique advantages of all-time and all-weather imaging.22 Li et al.23 found that landslide-affected areas show complicated scattering mechanisms because the landslide surface becomes relatively rough in the scale of the X-band. They distinguished landslide areas by using a supervised Wishart classifier and polarimetric scattering similarity parameters. This technique performs well in forested areas but is unsuitable for urban areas. Li et al.24 proposed another simple and effective approach for unsupervised classification of large-scale landslides. This involved first transforming PolSAR images from the RGB color space to the hue-saturation-intensity color space. A combination of -means clustering and hue-saturation-intensity imagery in different channels was then used stage by stage for automatic landslide extraction. This method is suited for large-scale landslide detection. Inspired by this approach, our framework involves the transformation of optical images from RGB to hue-saturation-value (HSV) space and the exploitation of a modified SRC method to detect landslide regions. Since most natural signals can be satisfactorily represented by a sparse vector corresponding to the linear combination of a few dictionary atoms, sparse representation has been shown to be an extremely powerful tool in remote-sensing data processing. Chen et al.25,26 proposed a simultaneous joint sparsity model for hyperspectral image (HSI) target detection and classification. This exploits the fact that in HSI, neighboring pixels have similar spectral characteristics. Furthermore, they introduced a kernel sparse representation method27,28 that maps low-dimensional features to high-dimensional features and improves classification accuracy. Fang et al.29 proposed a multiscale adaptive sparse representation model for spectral–spatial HSI classification. It effectively exploits spatial information at multiple scales via an adaptive sparse strategy. Song et al.30 developed a classification strategy that applies extended multiattribute profiles to an SRC framework. This approach combines the advantages of sparse representation and rich structural information to provide efficient classification results for different multi/hyperspectral datasets. Furthermore, other sparse representation models have been proposed to improve classification accuracy, such as manifold-based sparse representation,31 regularized sparse representation,32 nonlocal weighted joint sparse representation,33 and sparse representation-based binary hypothesis.34 These sparsity-based classification methods have some common shortcomings that are mostly embodied in two aspects. On the one hand, they are almost at pixel level. Since the size of remote-sensing images is often very large, classification processing incurs high-time complexity. On the other hand, pixels in HSI are represented by -dimensional vectors, where is the number of spectral bands. If the number of HSI bands is small (such as three or four), pixel-based information is scarce, which leads to low-classification accuracy. To overcome these problems, we35 had proposed an object-based landslide and mudflow detection method that combined multichannel sparse representation and eight neighbor judgment methods. Using this, a large-sized remote-sensing image was divided into a number of uniform patches and each was vectorized as a processing object. This method may solve the above-mentioned defects, but much larger thresholds are needed in practice. After further research, we have modified the SRC method to detect landslides. The implementation process is described in Sec. 4. 3.Building Damage Classification SchemeBy carefully observing the characteristics of landslide-affected buildings in VHR images, we found certain regularities in morphological changes in landslides that are different from those due to earthquakes. These regularities are as follows:
Under the direction of experts at the Academy of Disaster Reduction and Emergency Management, operated by the Ministry of Civil Affairs and the Ministry of Education, we propose a quantitative building damage classification scheme for landslides according to morphological characteristics (Table 1). In this scheme, we classify affected buildings into four grades. Table 1Building damage classification scheme applied to landslides.
We select two features to classify building damage according to the characteristics of two-dimensional remote-sensing images. They are (1) the spatial relationships between a building and the landslide area and (2) the roof texture. In order to calculate the spatial relationships, outlines of the building and the landslide are required. The former can be obtained either from relevant government departments or by hand annotation and the latter can be obtained by using the SRC-based approach. 4.Assessment FrameworkOur proposed assessment framework is aimed at automatically classifying building damage when landslides occur. It consists of two parts—the SRC-based approach, which is used to detect landslides, and the classification model, which classifies affected buildings. The specific implementation process is shown in Fig. 1. 4.1.Sparse Representation Classification-Based Approach for Landslide DetectionAccording to the classification scheme, landslide detection, while imperative, is time-consuming. We studied the spectral characteristics of landslides and proposed an SRC-based approach for automatic landslide detection. It is composed of three procedures: dictionary construction, target detection, and morphological processing. 4.1.1.Dictionary constructionAn overcompleted dictionary is crucial and necessary for the SRC method. Before the occurrence of a landslide, we collect a large number of typical sample patches ( size) from VHR remote-sensing images. These sample patches consist of landslide and background (nonlandslide) samples, each as a processing object. Since the landslide is mostly manifested in its spectral characteristics than in other features, and since the HSV color space is close to human color perception, we convert every patch from RGB color space to HSV. In the HSV color space, hue is used to distinguish colors, saturation is the percentage of white light added to a pure color, and value refers to perceived light intensity.36 It is known that the method of calculating HSV spatial components might affect both recognition performance and computational efficiency. From practical experience, we quantify the HSV space component in unequal intervals. The quantization scheme is shown as Here, based on a color model derived from substantial analysis, we divide hue into 16 parts. Saturation and value are divided into four parts each. Then an HSV histogram is generated using quantified hue (), saturation (), and value () as where is the quantified series of and is the quantified series of . Here, we set . Then Finally, we concatenate the histogram and obtain a 256-dimensional vector for each patch, which is exactly an atom of the dictionary. Thus, we obtain an overcomplete dictionary , which is the union of two low-dimensional subdictionaries, i.e., the landslide subdictionary and the background subdictionary spanned by landslide training samples and background training samples , respectively.Since the sample patches are randomly selected, the constructed dictionary is redundant, and atom vectors are highly correlated. To solve this problem, we perform a preprocessing step called whitening, the goal of which is to make the dictionary less redundant. Thus, we construct an overcomplete dictionary where (i) the atoms are less correlated with one another and (ii) all atoms have the same variance. 4.1.2.Target detectionWith a test VHR image patch, a corresponding 256-dimensional HSV histogram vector is calculated in the same manner as that of an atom in the dictionary. According to the sparse representation theory, can be approximately represented by a sparse vector corresponding to the linear combination of all atoms, the mathematical representation of which is rendered as where and are the landslide and background subdictionaries consisting of landslide atoms and background atoms, respectively. and are sparse vectors, whose nonzero entries correspond to the weighting of the atoms in and , respectively. The matrix with is the training dictionary consisting of both the landslide and background training samples, and the -dimensional vector is a concatenation of the two vectors and , which is also a sparse vector. If is a background patch, ideally, it cannot be sparsely represented by the landslide training samples. Namely, is a zero vector and is a sparse vector, and vice versa. Therefore, test patch can be sparsely represented by the combined landslide and background dictionaries, and the locations of nonzero entries in the sparse vector contain critical information about the class of . To better illustrate this model, an example is shown in Fig. 2. The landslide dictionary contains training samples and the background dictionary contains training samples. For a background patch, the sparse representation vector is shown in Fig. 2(a). We see that vector (red entries) corresponding to the landslide dictionary is a zero vector and vector (blue entries) corresponding to the background dictionary is a sparse vector. A whitened background sample histogram feature (black solid) and its approximation (red dashed) are shown in Fig. 2(b).Fig. 2Sparse representation of a background patch. (a) The sparse representation vector consisting of vectors (red entries) and (blue entries). (b) A whitened background sample histogram feature (black solid) and its approximation (red dashed).  The sparse vector satisfies the equation , and the number of its nonzero entries should be as less as possible. So we get the loss function as where and denote the -norm and the -norm, respectively. The latter is defined as the number of nonzero entries in the vector (also called the sparsity level of the vector).26 is a preset upper bound on the sparsity level.37 In the absence of a priori information of the , the aforementioned problem is satisfactorily solved by the sparsity adaptive matching pursuit algorithm.38The sparse vector is recovered by decomposing over the preconstructed dictionary . Thus, we may find the few atoms in best representing . The recovery process implicitly leads to a competition between the two subspaces ( and ). Once sparse vector is obtained, the residuals of recovery are calculated with the following equations: where and denote the recovered sparse coefficients corresponding to the landslide and background dictionaries, respectively. The class of can be determined by comparing the residuals with . The detector is defined as Finally, we preset threshold , which is a very small positive number based on experience. When output is greater than , the test patch is labeled as class 0; otherwise, it is labeled as class 1 If the class of a test patch is labeled as 0, it is determined to be a background patch. Otherwise, the patch is considered to be a potential landslide patch.4.1.3.Morphological processingAccording to the characteristics, a landslide should be a complete or continuous region, where each potential landslide patch should be an interconnection. Then in order to deal with broken or fragmented regions, some morphological processing operations, including the open operation, the close operation, and connected-component labeling, are applied to potential landslide patches. Some isolated patches should be eliminated if they are smaller than a given threshold and certain smaller holes should be filled. According to the average size of buildings and expert experience, our goal is to identify the landslide patch, whose area is larger than . Therefore, we set this threshold as where is the resolution of the VHR image. Finally, some complete landslide areas are segmented. Morphological processing may not only reduce the miss rate and the false alarm rate, but can also smooth the boundary of the landslide. In this way, we can get a more accurate outline of the landslide. A flowchart of landslide detection is shown in Fig. 3.4.2.Building Damage Classification ModelIn remote-sensing images, the outlines of the building and the landslide area embody polygons. We adopt the dimensionally extended nine-intersection model (DE-9IM) to analyze the spatial relationships of the two polygons.39 The DE-9IM model is a mathematical approach that defines a pair-wise spatial relationship between geometries of different types and dimensions. This model expresses spatial relationships among all types of geometries as pair-wise intersections of their interior, boundary, and exterior by considering the dimensions of the resulting intersections. It can be expressed as where dim is the maximum number of dimensions of the intersection () of the interior (I), the boundary (B), and the exterior (E) of geometries and . can yield values , specifically for empty sets (), 0 for points, 1 for lines, and 2 for areas. If we map the values {0, 1, 2} to T (true) and to F (false), the DE-9IM model can be expressed as a matrix using the Boolean domain {T, F}.There are many kinds of spatial relationship between two polygons. In this paper, we only need four. The corresponding spatial predicates are disjoint, touches, overlaps, and covers, and the matrix of the each predicate is as in Fig. 4. Finally, based on the above input data and spatial relationship theories, we designed the BDCM on the basis of the previous work,40 which is shown in Fig. 5. In this model, we determine the building damage grade directly when the spatial relationship between the outlines of the building and the landslide areas are covered or overlapped. If the relationship is disjoint, the shortest Euclidean distance between two regions needs to be calculated. According to the experience of experts, 3 m is a suitable discrimination threshold. Therefore, we preset a shortest distance threshold to pixels ( is the resolution of the VHR image). When the shortest Euclidean distance is greater than , the degree of damage to the building is in the “intact” grade; otherwise, as in the “touch” relation, we need to calculate the texture of the roof of the building in the predisaster and the postdisaster images to classify the degree of damage as two grades according to textural differences. Since we find that texture is often not required, it is ignored in this paper. 5.ExperimentsIn order to test the performance of the proposed framework, VHR images for the Wenchuan earthquake in China on May 12, 2008, were acquired and analyzed. This earthquake triggered massive landslides and mud-rock flow that caused a large number of casualties and massive damage to infrastructure. We used the QuickBird pre-event image acquired on June 26, 2005, and the QuickBird postevent image acquired on June 3, 2008. Both images were acquired in panchromatic and multispectral modes with spatial resolutions of 0.61 and 2.4 m, respectively. Following image fusion, we obtained the 0.61-m multispectral images used in our experiments. The experiments were executed on a personal computer running on an Intel Core2 Quad CPU at 2.83 GHz with 4 GB of memory. Figure 6 shows images of Wenchuan County before and after the earthquake. One subset containing images of damaged buildings was marked as the experimental region and is shown bounded by a red box in Fig. 6. 5.1.Landslide Detection ExperimentsPrior to damage grading, we cropped 4500 sample patches () consisting of 2000 landslide sample patches and 2500 background sample patches from several landslide remote-sensing images. For comparison, we calculated the HSV histogram features and the RGB histogram features for each sample patch. Finally, we concatenated the different color space histogram features and obtained two dictionaries. The SRC method based on both HSV and RGB histogram features was applied to the experimental images of Wenchuan County, and the results were compared both visually and quantitatively by using receiver operating characteristics (ROC) curves. In our study, the identification of landslide patches and nonlandslide (background) patches is a binary classification problem, where outcomes are labeled either as positive (p) or negative (n). The ROC curve illustrates the performance of the binary classifier system as its discrimination threshold is varied. It is defined by a true positive rate (TPR) and a false positive rate (FPR), which are labeled as - and -axes, respectively. In our experiments, the class labels for all test patches were determined at each threshold. The TPR is the ratio of the number of hits (landslide patches determined as landslides) to the total number of true landslide patches, and the FPR was calculated by the number of false alarms (background patches determined as landslide) over the total number of background patches. The pre- and postevent images of Wenchuan County used for the experiment are shown in Figs. 7(a) and 7(b), respectively. In order to evaluate our landslide detection method, the SRC experiments based on the above two dictionaries were performed and their experimental results were compared with the visual interpretation results. The visual interpretation results of the landslide areas from the National Disaster Reduction Center of China are shown in Fig. 7(c). Figure 7(d) shows the visual interpretation of landslide areas overlying the postevent image. The RGB histogram-based classification results are shown in Figs. 7(e) and 7(f), whereas Fig. 7(e) shows the binary classification results and Fig. 7(f) shows the final landslide detection areas overlying the postevent image. Similarly, the results of the HSV histogram-based classification are shown in Figs. 7(g) and 7(h). Both experiments employed morphological processing. To eliminate isolated potential landslide patches, the area threshold was set 540 pixels automatically, equivalent to . The corresponding ROC curves are shown in Fig. 8, which shows that the SRC method using the HSV histogram feature dictionary was more effective. Fig. 7Landslide detection result with two different feature dictionaries: (a) the pre-event VHR image of major disaster areas in Wenchuan County, (b) the postevent VHR image of major disaster areas in Wenchuan County, (c) visual interpretation results of landslide areas, (d) visual interpretation landslide areas overlaid on (b), (e) landslide detection result according to RGB histogram feature dictionary, (f) RGB histogram-based classified landslide areas overlaid on (b), (g) landslide detection result according to HSV histogram feature dictionary, and (h) HSV histogram-based classification landslide areas overlaid on (b). 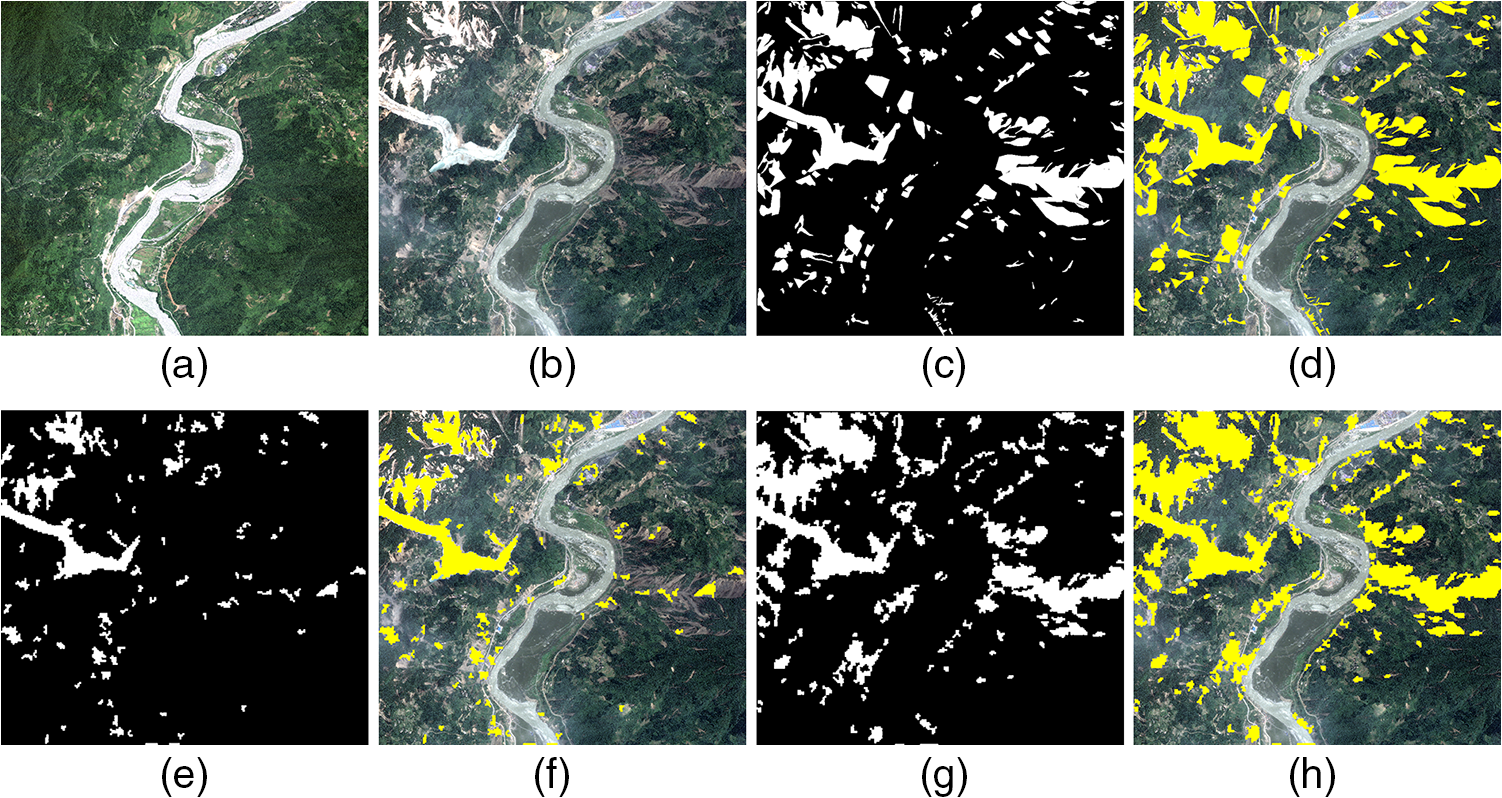 5.2.Experiments on Building Damage Classification ModelAfter obtaining landslide detection results through the SRC-based framework, we easily obtained the outlines of the landslide area. The outlines were entered into the BDCM. Meanwhile, the outline of the building obtained from the cooperation in advance was also entered into this model. In this experiment, the shortest distance threshold was set as 5 pixels, approximately equal to 3 m (). Finally, the model assigned a damage grade to each affected building (Fig. 9). The assessment results were then displayed, and all kinds of assessment reports could be generated depending on the user’s requirements. Fig. 9The building damage assessment results of part of the postevent VHR image: (a) the outline of affected buildings and (b) classification results of building damage.  In this case, the total number of buildings was 106, and the number of correct classifications was 92. The assessment results are depicted by a confuse matrix shown in Table 2. Here, the rows represent assessment results obtained using our method, and the columns show the reference data from the National Disaster Reduction Center of China. The results were satisfactory, with high producer accuracy and user accuracy. The overall accuracy was 86.79%, and the Kappa coefficient was 0.82. Table 2The confuse matrix display of assessment results.
6.ConclusionIn this paper, we developed an effective and reliable assessment framework to classify building damage caused by landslides. The framework can yield satisfactory results by taking advantage of VHR optical remote-sensing images. This framework not only exploits the advantages of remote-sensing data, but also reduces the participation of experts. Experiments showed that the framework can provide effective support for emergency disposal work and disaster management. Since the framework has been developed for VHR images, its performance will be affected by low-resolution images. Further modification and extended research will continue on this front. AcknowledgmentsThis research was primarily supported by the National Natural Science Foundation of China (Grant No. 61501035), the Fundamental Research Funds for the Central Universities of China (No. 2014KJJCA15), the National Key Technology R&D Program of the 12th Five Year Plan of China (No. 2012BAK10B03), and the High-Resolution Special Scientific Research Project from the National Disaster Reduction Center of China, Ministry of Civil Affairs (No. 03-Y30B06-9001-13/15). ReferencesD. Dubois and R. Lepage,
“Fast and efficient evaluation of building damage from very high resolution optical satellite images,”
IEEE J. Sel. Top. Appl. Earth Obs. Remote Sens., 7
(10), 4167
–4176
(2014). http://dx.doi.org/10.1109/JSTARS.2014.2336236 Google Scholar
J. A. Benediktsson, J. Chanussot and W. M. Moon,
“Very high-resolution remote sensing: challenges and opportunities,”
Proc. IEEE, 100
(6), 1907
–1910
(2012). http://dx.doi.org/10.1109/JPROC.2012.2190811 IEEPAD 0018-9219 Google Scholar
A. L. Chesnel, R. Binet and L. Wald,
“Damage assessment on buildings using multisensor multimodal very high resolution images and ancillary data,”
in IEEE Int. Geoscience & Remote Sensing Symp. (IGARSS ‘08),
1252
–1255
(2008). http://dx.doi.org/10.1109/IGARSS.2008.4779585 Google Scholar
S. Klonus et al.,
“Combined edge segment texture analysis for the detection of damaged buildings in crisis areas,”
IEEE J. Sel. Top. Appl. Earth Obs. Remote Sens., 5
(4), 1118
–1128
(2012). http://dx.doi.org/10.1109/JSTARS.2012.2205559 Google Scholar
P. Li, H. Xu and J. Guo,
“Urban building damage detection from very high resolution imagery using OCSVM and spatial features,”
Int. J. Remote Sens., 31
(13), 3393
–3409
(2010). http://dx.doi.org/10.1080/01431161003727705 IJSEDK 0143-1161 Google Scholar
M. Gerke and N. Kerle,
“Automatic structural seismic damage assessment with airborne oblique Pictometry© imagery,”
Photogramm. Eng. Remote Sens., 77
(1), 885
–898
(2011). http://dx.doi.org/10.14358/PERS.77.9.885 Google Scholar
M. Shinozuka and R. Ghanem,
“Damage detection in urban areas by SAR imagery,”
J. Eng. Mech., 126
(7), 769
–777
(2000). http://dx.doi.org/10.1061/(ASCE)0733-9399(2000)126:7(769) JENMDT 0733-9399 Google Scholar
M. Matsuoka and N. Nojima,
“Building damage estimation by integration of seismic intensity information and satellite L-band SAR imagery,”
Remote Sens., 2
(1), 2111
–2126
(2010). http://dx.doi.org/10.3390/rs2092111 RSEND3 Google Scholar
S. W. Lau,
“Comparison and fusion of space borne L- C- and X-band SAR images for damage identification in the 2008 Sichuan earthquake,”
Stockholm, Sweden
(2011). Google Scholar
H. Miura, S. Midorikawa and M. Matsuoka,
“Building damage assessment using high-resolution satellite SAR images of the 2010 Haiti earthquake,”
Earthquake Spectra, 32
(1), 591
–610
(2016). http://dx.doi.org/10.1193/033014EQS042M Google Scholar
W. Zhai et al.,
“Building earthquake damage information extraction from a single post-earthquake PolSAR image,”
Remote Sens., 8
(1), 171
(2016). http://dx.doi.org/10.3390/rs8030171 RSEND3 Google Scholar
D. Chakraborty and U. Maulik,
“Semisupervised pixel classification of remote sensing imagery using transductive SVM,”
in Recent Trends in Information Systems (ReTIS ‘11),
30
–35
(2011). http://dx.doi.org/10.1109/ReTIS.2011.6146835 Google Scholar
A. C. Mondini et al.,
“Semi-automatic recognition and mapping of rainfall induced shallow landslides using optical satellite images,”
Remote Sens. Environ., 115
(7), 1743
–1757
(2011). http://dx.doi.org/10.1016/j.rse.2011.03.006 RSEEA7 0034-4257 Google Scholar
B. Aksoy and M. Ercanoglu,
“Landslide identification and classification by object-based image analysis and fuzzy logic: an example from the Azdavay region,”
Comput. Geosci., 38
(1), 87
–98
(2012). http://dx.doi.org/10.1016/j.cageo.2011.05.010 Google Scholar
R. Jiann-Yeou, J. Jyun-Ping and R. Ruey-Juin,
“Semiautomatic object-oriented landslide recognition scheme from multisensor optical imagery and DEM,”
IEEE Trans. Geosci. Remote Sens., 52
(2), 1336
–1349
(2014). http://dx.doi.org/10.1109/TGRS.2013.2250293 IGRSD2 0196-2892 Google Scholar
T. R. Martha et al.,
“Characterising spectral, spatial and morphometric properties of landslides for semi-automatic detection using object-oriented methods,”
Geomorphology, 116
(1), 24
–36
(2010). http://dx.doi.org/10.1016/j.geomorph.2009.10.004 Google Scholar
T. R. Martha et al.,
“Segment optimization and data-driven thresholding for knowledge-based landslide detection by object-based image analysis,”
IEEE Trans. Geosci. Remote Sens., 49
(12), 4928
–4943
(2011). http://dx.doi.org/10.1109/TGRS.2011.2151866 IGRSD2 0196-2892 Google Scholar
Y. Hu,
“Remote sensing image classification based on SVM classifier,”
in System Science, Engineering Design and Manufacturing Informatization (ICSEM ‘11),
30
–33
(2011). http://dx.doi.org/10.1109/ICSSEM.2011.6081213 Google Scholar
Z.-Z. Wei, X. Wei and X.-G. Wei,
“Landslide recognition in mountain image based on support vector machine,”
Measuring Technology and Mechatronics Automation in Electrical Engineering, 279
–286 Springer, New York
(2012). Google Scholar
C. Yie-Ruey et al.,
“The application of remote sensing technology to the interpretation of land use for rainfall-induced landslides based on genetic algorithms and artificial neural networks,”
IEEE J. Sel. Top. Appl. Earth Obs. Remote Sens., 2
(2), 87
–95
(2009). http://dx.doi.org/10.1109/JSTARS.2009.2023802 Google Scholar
C. Wen and J. Minhe,
“Comparative analysis of fuzzy approaches to remote sensing image classification,”
in Fuzzy Systems and Knowledge Discovery (FSKD ‘10),
537
–541
(2010). http://dx.doi.org/10.1109/FSKD.2010.5569071 Google Scholar
W. Zhai et al.,
“Fusion of polarimetric and texture information for urban building extraction from fully polarimetric SAR imagery,”
Remote Sens. Lett., 7
(1), 31
–40
(2016). http://dx.doi.org/10.1080/2150704X.2015.1101179 Google Scholar
N. Li et al.,
“Polarimetric response of landslides at X-band following the Wenchuan earthquake,”
IEEE Geosci. Remote Sens. Lett., 11
(10), 1722
–1726
(2014). http://dx.doi.org/10.1109/LGRS.2014.2306820 Google Scholar
N. Li et al.,
“Unsupervised polarimetric synthetic aperture radar classification of large-scale landslides caused by Wenchuan earthquake in hue-saturation-intensity color space,”
J. Appl. Remote Sens., 8
(1), 083595
(2014). http://dx.doi.org/10.1117/1.JRS.8.083595 Google Scholar
Y. Chen, N. M. Nasrabadi and T. D. Tran,
“Hyperspectral image classification using dictionary-based sparse representation,”
IEEE Trans. Geosci. Remote Sens., 49
(10), 3973
–3985
(2011). http://dx.doi.org/10.1109/TGRS.2011.2129595 IGRSD2 0196-2892 Google Scholar
Y. Chen, N. M. Nasrabadi and T. D. Tran,
“Sparse representation for target detection in hyperspectral imagery,”
IEEE J. Sel. Top. Signal Process., 5
(3), 629
–640
(2011). http://dx.doi.org/10.1109/JSTSP.2011.2113170 Google Scholar
Y. Chen, N. M. Nasrabadi and T. D. Tran,
“Kernel sparse representation for hyperspectral target detection,”
Proc. SPIE, 8390 839005
(2012). http://dx.doi.org/10.1117/12.918722 PSISDG 0277-786X Google Scholar
Y. Chen, N. M. Nasrabadi and T. D. Tran,
“Hyperspectral image classification via kernel sparse representation,”
IEEE Trans. Geosci. Remote Sens., 51
(1), 217
–231
(2013). http://dx.doi.org/10.1109/TGRS.2012.2201730 IGRSD2 0196-2892 Google Scholar
L. Fang et al.,
“Spectral–spatial hyperspectral image classification via multiscale adaptive sparse representation,”
IEEE Trans. Geosci. Remote Sens., 52
(12), 7738
–7749
(2014). http://dx.doi.org/10.1109/TGRS.2014.2318058 IGRSD2 0196-2892 Google Scholar
B. Song et al.,
“Remotely sensed image classification using sparse representations of morphological attribute profiles,”
IEEE Trans. Geosci. Remote Sens., 52
(8), 5122
–5136
(2014). http://dx.doi.org/10.1109/TGRS.2013.2286953 IGRSD2 0196-2892 Google Scholar
Y. Y. Tang, H. Yuan and L. Li,
“Manifold-based sparse representation for hyperspectral image classification,”
IEEE Trans. Geosci. Remote Sens., 52
(12), 7606
–7618
(2014). http://dx.doi.org/10.1109/TGRS.2014.2315209 IGRSD2 0196-2892 Google Scholar
H. Yuan et al.,
“Hyperspectral image classification based on regularized sparse representation,”
IEEE J. Sel. Top. Appl. Earth Obs. Remote Sens., 7
(6), 2174
–2182
(2014). http://dx.doi.org/10.1109/JSTARS.2014.2328601 Google Scholar
H. Zhang et al.,
“A nonlocal weighted joint sparse representation classification method for hyperspectral imagery,”
IEEE J. Sel. Top. Appl. Earth Obs. Remote Sens., 7
(6), 2056
–2065
(2014). http://dx.doi.org/10.1109/JSTARS.2013.2264720 Google Scholar
Y. Zhang, B. Du and L. Zhang,
“A sparse representation-based binary hypothesis model for target detection in hyperspectral images,”
IEEE Trans. Geosci. Remote Sens., 53
(3), 1346
–1354
(2015). http://dx.doi.org/10.1109/TGRS.2014.2337883 IGRSD2 0196-2892 Google Scholar
C. Chao et al.,
“Automatic landslide and mudflow detection method via multichannel sparse representation,”
Proc. SPIE, 9644 96441J
(2015). http://dx.doi.org/10.1117/12.2194239 PSISDG 0277-786X Google Scholar
D. John, S. T. Tharani and K. SreeKumar,
“Content based image retrieval using HSV-color histogram and GLCM,”
Int. J. Adv. Res. Comput. Sci. Manage. Stud., 2
(1), 246
–253
(2014). Google Scholar
J. A. Tropp and S. J. Wright,
“Computational methods for sparse solution of linear inverse problems,”
Proc. IEEE, 98
(6), 948
–958
(2010). http://dx.doi.org/10.1109/JPROC.2010.2044010 IEEPAD 0018-9219 Google Scholar
T.T. Do et al.,
“Sparsity adaptive matching pursuit algorithm for practical compressed sensing,”
in 2008 42nd Asilomar Conf. on Signals, Systems and Computers,
581
–587
(2008). http://dx.doi.org/10.1109/ACSSC.2008.5074472 Google Scholar
E. Clementini, J. Sharma and M. J. Egenhofer,
“Modelling topological spatial relations: strategies for query processing,”
Comput. Graphics, 18
(6), 815
–822
(1994). http://dx.doi.org/10.1016/0097-8493(94)90007-8 Google Scholar
B. Sun et al.,
“Semi-auto assessment system on building damage caused by landslide disaster with high-resolution satellite and aerial images,”
Proc. SPIE, 9643 96431O
(2015). http://dx.doi.org/10.1117/12.2193733 PSISDG 0277-786X Google Scholar
BiographyBo Sun received his BSc degree in computer science from Beihang University, China, and his MSc and PhD degrees from Beijing Normal University, Beijing, China. He is currently a professor at the Department of Computer Science and Technology, Beijing Normal University. His research interests include pattern recognition, natural language processing, and information systems. He is a member of the Association for Computing Machinery and a senior member of the China Society of Image and Graphics. Qihua Xu received his BSc degree from Southwest Normal University and his MSc degree in computer application technology from Renmin University of China. Since 2009, he has been with the School of Business, Northwest Normal University, Lanzhou, China. He is currently a PhD candidate majoring in computer application technology at Beijing Normal University. His research interests include machine learning and pattern recognition. Jun He received her BSc degree in optical engineering and her PhD in physical electronics from Beijing Institute of Technology, Beijing, China, in 1998 and 2003, respectively. Since 2003, she has been with the College of Information Science and Technology, Beijing Normal University, Beijing, China. She was elected as a lecturer and an assistant professor in 2003 and 2010, respectively. She is currently teaching and engaged in research. Her research interests include image processing applications and pattern recognition. Zhen Liu received his MSc degree in cartology and remote sensing and his PhD degree in remote sensing and geographic information systems from Beijing Normal University, Beijing, China, in 1998 and 2004 respectively. He was a postdoctoral scholar with UC Irvine. He is currently a full professor and the director of the Center of Information and Network Technology in Beijing Normal University. His research interests include feature extraction and change detection using remote-sensing images, spatio-temporal modeling and applications. Ying Wang is an experienced researcher at Beijing Normal University, a consultant with China’s National Disaster Reduction Centre, Department of Disaster Relief and Ministry of Civil Affairs, China’s Ministry of Science and Technology. He has researched earthquake-induced hazard chains, comprehensive risk assessments, reconstruction, rural livelihoods, assessing rural housing vulnerabilities, emergency responses, postdisaster resettlement, recovery modeling, agricultural insurance, evacuation training, and brought scientific knowledge into communities to mitigate risk and maximize resilience in Yunnan and Sichuan. Fengxiang Ge received his BSc and MSc degrees from Harbin Engineering University in 1996 and 1999, respectively, and his PhD degree from Tsinghua University in 2003. From 2003 to 2005, he was a research associate in the University of Hong Kong. In 2005, he joined Intel Corporation as a senior researcher and architect. In 2011, he joined Beijing Normal University as an associate professor. His research interests include signal processing and its applications. |
|||||||||||||||||||||||||||||||||||||||||||||||||||||||||||


