|
|
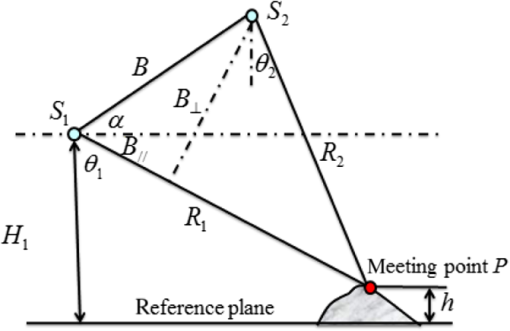
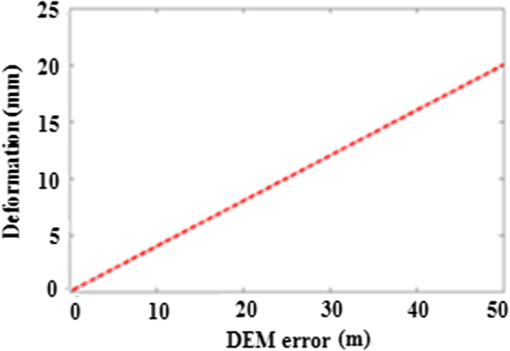
1.IntroductionThe exploitation of underground mineral resources brings great material wealth but also damages the natural environment at the same time. For example, it can cause mine subsidence, which brings a series of severe consequences, such as decrease in cultivated fields, collapse of buildings, and damage to roads. Accordingly, it is urgent and necessary to effectively monitor mine subsidence.1–3 Differential interferometric synthetic aperture radar (DInSAR) has proven very useful in monitoring mine subsidence. According to the different methods of removing topographical information, DInSAR can be divided into two-, three-, and four-pass. For two-pass DInSAR, it is necessary to simulate topographic phase by an external digital elevation model (DEM) and remove it from SAR interferometric phase to extract land subsidence phases and values. Therefore, external DEM error will inevitably lead to land subsidence error.4,5 In other words, due to the variation of error of different ground resolution in each external DEM, the land subsidence phases and values extracted from the same SAR interferometric pair will vary. Liu6 reported that the deformation error introduced by external DEM error was mainly systematic. Long et al.7,8 determined that the effect of orbit error on deformation phases was greater than the external DEM error. Hirt et al.9 pointed out that the accuracy of SRTM DEM () was higher than ASTER GDEM () in sparsely populated areas, and SRTM DEM was recommended for use in most applications. Taking typical flat and mountainous areas of Qinghai Tibet Plateau as research areas, Li et al.10 compared and analyzed three land subsidence results monitored by two-pass DInSAR with SRTM, ASTER GDEM, and external DEM, and then concluded that SRTM DEM was more suitable for the external reference DEM. In this study, the effect of external DEM on monitored mine subsidence is systematically investigated from theory and in practical applications. The relationship of external DEM errors and monitored deformation errors is derived based on the principles of interferometric synthetic aperture radar (InSAR) and two-pass DInSAR. We then determine the effect of different DEM errors on monitored deformation results under the constant image parameters in theory. In this study, 25-, 30-, and 90-m ground resolution external DEMs covering Dongtan and Yangcun mine areas of Jining are resampled to the same SAR image coordinate system to generate three DEMs with the same coordinate system and resolution. The elevation values of three external DEMs before and after resampling are compared with each other and with the leveling-measured elevation values. Changes in DEM value and accuracy before and after resampling were found to be small, but larger differences existed between three external DEMs, although in the flat test areas of this study. The Advanced Land Observing Satellite Phased Array L-band SAR (ALOS PALSAR) interferometric pairs covering the Dongtan and Yangcun mine areas are processed using two-pass DInSAR with three external DEMs. Some key images in the processing are given, including original and enhanced differential interferograms, coherence images, unwrapped phase images, and subsidence images. All of these aim to compare and analyze the effect of three external DEMs in high- and low-coherence regions with different subsidence magnitude. In addition, the mine subsidence monitored by DInSAR using three external DEMs is validated further by leveling-measured mine subsidence at 23 leveling benchmarks in Dongtan mine and 29 leveling benchmarks in Yangcun mine at the nearest time interval. Research results show that the effect of external DEM on the monitored results of two-pass DInSAR is not only related to imaging parameters, such as radar look angle, perpendicular baseline, slant range, and external DEM error, but also related to the subsidence magnitude and coherence of test areas. Generally, in high-coherence regions with larger subsidence magnitude, the subsidence trends and values obtained by three external DEMs are more consistent, but compared with leveling data, the subsidence trends are consistent while subsidence values are quite different. In low-coherence regions with slight subsidence, the subsidence values obtained by three external DEMs vary greatly and are clearly different from the leveling-measured subsidence values. 2.Theoretical AnalysisInSAR acquires two images over the same test area from slightly different viewpoints and determines the relative height of the meeting point using the interferometric phase of each pixel in the two images (Fig. 1).11 In Fig. 1, and are different spatial positions of the satellite when the ground point is observed during repeat flights, is the spatial interferometric baseline vector, is the inclination angle of baseline, is the height difference between the platform and ground reference plane, and are the slant ranges of ground point to the platform, respectively, and are the respective look angles, and is the height of relative to the reference plane. Assuming , the interferometric phase can be written as12 According to the geometric relations shown in Fig. 1, and considering that and are much smaller than , the approximate value of can be derived by the cosine theorem as follows: So there are The DInSAR technique is developed on the basis of InSAR. If the land subsidence occurs during the acquisition period of the SAR image pair, the interferometric phase of the target point is composed of two parts and can be rewritten as13 where is the land subsidence along the radar line of sight (LOS), and and are the topographic phase and deformation phase in LOS direction, respectively. Combined with radar imaging parameters, can be obtained from known elevation of the target point based on Eqs. (3)–(5). Therefore, an external DEM can be used to simulate topographic phase and implement differential operation with the interferogram to acquire the deformation phase . The deformation can be calculated asFrom Eqs. (2) and (6), it can be shown that If the unwrapped phase and baseline estimate are completely correct, the interferometric phase and baseline can be seen as constants, the first-order partial derivative of for Eqs. (5) and (8) can be expressed as So there are From the above equations, it can be seen that the contribution of the DEM error to the deformation in LOS direction is proportional to both and and is inversely proportional to and . For an ALOS PALSAR interferometric pair, in the case of , , and , the deformation error in LOS direction introduced by DEM error is shown in Fig. 2.3.Study Area and Data SourceJining is one of China’s main coal-producing regions and is located in the north of the country. Overexploitation of this resource to meet industrial needs has led to severe land subsidence in many areas of Jining. The Dongtan and Yangcun mine areas are selected as the test areas and shown in Fig. 3. Mine subsidence has caused a series of problems, such as cultivated fields decrease, buildings collapse, roads crack, and other problems developing across the two test areas. Fig. 3Locations of study areas. The red solid rectangle represents the boundary of the first interferometric pair of ALOS PALSAR images and the yellow solid rectangle represents the boundary of the second interferometric pair of ALOS PALSAR images. 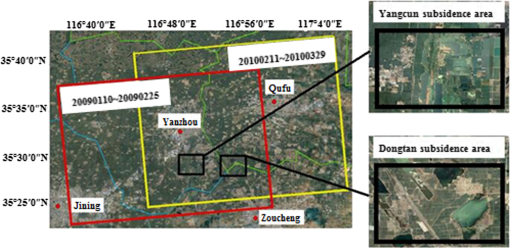 To analyze the effect of external DEM on mine subsidence monitored by two-pass DInSAR, two interferometric pairs of ALOS PALSAR single look complex (SLC) images (see Fig. 3) and three external DEMs with different resolutions are collected. 3.1.ALOS PALSAR SLC ImagesThe ALOS was Japan’s new-generation Earth Observation satellite, launched in January 2006 by the Japan Aerospace Exploration Agency. The Phased Array L-band SAR (PALSAR) carried by the ALOS satellite was an active microwave imaging radar that could image in all weather and at all times, and had been widely applied in military and civilian fields. The design life of ALOS was three years, but it was in service for five years and stopped on May 12, 2011, due to a power generation anomaly that led to the loss of communication functions. Considering the time span of the leveling data collected in the test areas, four ALOS PALSAR images were selected. Their characteristics are HH polarization modes, descending orbits, pixel spacing of 4.68 m in slant range, and 3.17 m in azimuth. Table 1 shows the basic parameters of four ALOS PALSAR images Table 1Basic parameters of four ALOS PALSAR images.
3.2.External DEMs3.2.1.1∶5 million DEMA million DEM covering test areas was obtained, and a mosaic and coordinate transformation between Xi’an 80 coordinate system and WGS84 coordinate system was implemented. The ground resolution of the DEM is 25 m with accuracy of 4 m on flat ground and 11 m in mountainous areas. 3.2.2.ASTER GDEM V2 DEMAn Advanced Spaceborne Thermal Emission and Reflection Radiometer Global DEM (ASTER GDEM) covering the test areas was downloaded from the website (Ref. 14), the geospatial data cloud of the Computer Network Information Center (CNIC). The DEM is publicly released by the Japanese Ministry of Economy, Trade, and Industry and the American National Aeronautics and Space Administration (NASA), and is the only elevation images data set with high resolution covering the global land surface. Its ground resolution is 30 m with average accuracy of 20 m.15,16 3.2.3.SRTM DEMA Shuttle Radar Topography Mission (SRTM) DEM covering test areas was also downloaded from the geospatial data cloud of CNIC.14 It was jointly measured by American NASA and the National Imagery and Mapping Agency in February 2000. Its ground resolution is 90 m with an average accuracy of 16 m.17,18 Figure 4 shows the external DEMs covering test areas. The above three external DEMs are resampled to the same SAR image coordinate system to give them a consistent coordinate system and resolution. Therefore, their difference and accuracy can be compared effectively to better assess the effect of using different external DEMs on mine subsidence monitored by two-pass DInSAR. Figure 5 shows the three external DEMs after resampling. Table 2 shows the difference of resampled DEM elevation values of 12 even-selected pixels marked by red plus symbols in Fig. 5. Table 3 shows the difference of elevation values derived from leveling measurement and the three external DEMs before and after resampling. The locations of 12 leveling benchmarks are marked by black points in Fig. 5. Fig. 5Three external DEMs resampled to the same SAR image coordinate system: (a) million DEM, (b) ASTER GDEM V2 DEM, and (c) SRTM DEM.  Table 2Elevation values of 12 pixels over three resampled external DEMs.
Table 3Elevation values derived from leveling measurements and three external DEMs before and after resampling.
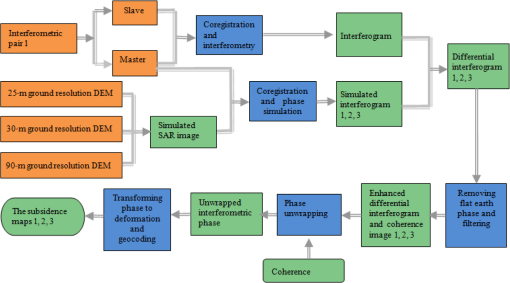
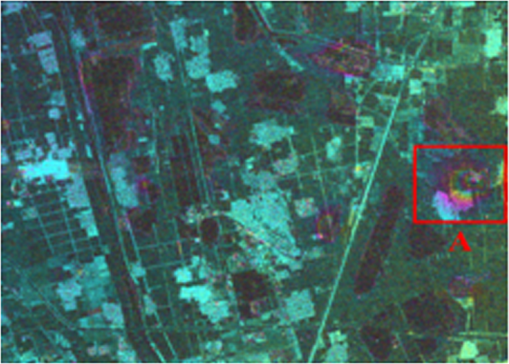
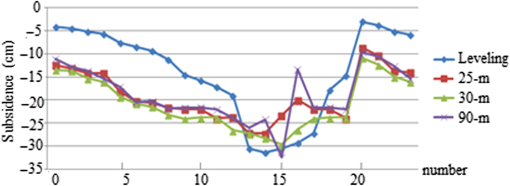
In Tables 2 and 3, “25,” “30,” and “90 m” represent the million DEM with 25-m ground resolution, the ASTER GDEM V2 DEM with 30-m ground resolution, and the SRTM DEM with 90-m ground resolution, respectively. In Table 3, “B/A” is the abbreviation of “before resampling/after resampling” and represents the elevation values of three external DEMs before and after resampling. As can be seen from Figs. 4 and 5, and Tables 2 and 3, the terrain of the test areas slopes gently, but three main external DEMs of million DEM, ASTER GDEM V2 DEM, and SRTM DEM show very large differences. The distributed intervals of elevation values of 25-, 30-, and 90-m ground resolution DEM after resampling are (42, 54 m), (, 72 m), and (20, 70 m), respectively. Comparatively speaking, the DEM elevation values of million DEM are closer to those of SRTM DEM with the maximum and average deviation of 12 and 3 m among 12 pixels, but for ASTER GDEM V2 DEM, the deviations are larger. Specifically, the maximum and average deviations are about 15 and 10 m compared with 1:5 million DEM, and about 17 and 7 m compared with SRTM DEM. The elevation values of the 25-m resolution external DEM are nearest to the 12 leveling-measured elevation values, followed by the 90-m resolution external DEM, while the values of the 30-m resolution external DEM are most different from the leveling-measured elevation values and therefore have the lowest accuracy. It is true that the value and accuracy (i.e., the DEM error) of a DEM will change before and after resampling. However, the degree of change is different in each case. The value and accuracy of the 90-m resolution external DEM before and after resampling change most, followed by the 30-m resolution external DEM, and there is no difference between the value and accuracy of the 25-m resolution external DEM before and after resampling. 4.Data Processing MethodFor differential processing of two-pass DInSAR, the slave image and external DEM are first coregistered and resampled into the master image space to ensure that they share exactly the same SAR coordinates. The second step of the method is to deal with differential processing and remove the flat earth effect to obtain the differential interferogram. Then adaptive filtering must be used to acquire the enhanced differential interferogram and coherence image. Next, the minimum cost flow phase unwrapping method is used to unwrap the enhanced differential interferometric phase. This step is followed by transforming phase to height, geocoding, and then determining the amount of mine subsidence.19 The primary procedure for the first interferometric pair is shown in Fig. 6. In addition to DEM error, the subsidence measurements derived by two-pass DInSAR are often degraded by baseline estimation, atmospheric delay, orbital parameters, noise, and other errors. The corresponding parameters and processing methods are consistent when two interferometric pairs are processed using two-pass DInSAR with three external DEMs, to ensure that each interferogram has the same baseline estimation, atmospheric delay, orbital parameters, noise, and other errors. This can guarantee that the final monitored subsidence difference depends only on the use of three external DEMs. Moreover, as we all know that the atmospheric effect is one of the most intractable problems in the processing of two-pass DInSAR to monitor mine subsidence, it is difficult to implement accurate estimation and removal of the atmospheric effect in the absence of priori data. Our two interferometric pairs of test areas in this study are processed using standard processing procedure of two-pass DInSAR without separately considering the atmospheric effect. 5.Test Results and Analysis5.1.Land Subsidence in the Dongtan Mine AreaAccording to the processing procedure of test data in Fig. 6, the first interferometric pair is processed. Figure 7 shows the enhanced differential interferogram derived from two-pass DInSAR with 25-m ground resolution DEM. Its background is the SAR intensity image of the test area. Considering the collected leveling-measured data at 23 leveling benchmarks, subsidence of region A in the Dongtan mine area is obtained and analyzed to study the effect of three external DEMs on monitored mine subsidence in the high-coherence region with larger subsidence magnitude. Figure 8 shows the local enlarged images of region A, from left to right sequentially corresponding to the original and enhanced differential interferograms, coherence images, unwrapped phase images, subsidence images, and from top to bottom, corresponding to the differential results of three external DEMs with 25-, 30-, and 90-m ground resolution. Fig. 8Enlarged images of region A: (a) original differential interferograms, (b) enhanced differential interferograms, (c) coherence images, (d) unwrapped phase images, and (e) subsidence images. 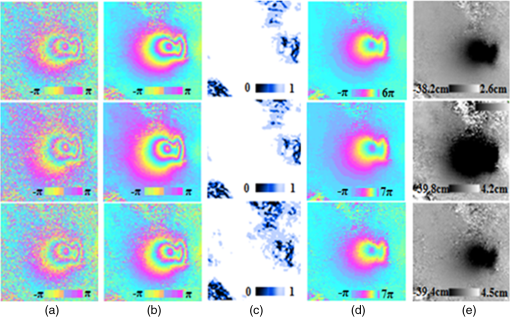 As can be seen from Fig. 8, the coherences of region A are higher (average coherence coefficients are all ), and three complete and clear interferometric fringes are formed, which means that the largest subsidence magnitude, in the vertical direction, can be monitored by two-pass DInSAR. Moreover, the three subsidence results monitored are continuous without intermittent spots and thus are all highly reliable and accurate. We also can see from Fig. 8, the uplift phenomenon occurred during this imaging period in our test area. Actually, the uplift phenomenon usually occurs at the edge of subsidence regions and it is normal. Mining of coal resources will lead to crustal movement, so that some parts of the ground uplift while some parts maybe subside, and the subsidence parts will be surrounded by those uplift parts. The amount of uplift is related to the strata structure and it is generally not large. Only when the quaternary loose layer is relatively thick, there will be no uplift phenomenon. The monitored subsidence images of Fig. 8 are geocoded back to local map projections and overlaid on the geographic information system (GIS) vector information to obtain subsidence maps of Fig. 9. Fig. 9The geocoded subsidence maps and local enlarged maps of (a) 25-m ground resolution DEM, (b) 30-m ground resolution DEM, and (c) 90-m ground resolution DEM. 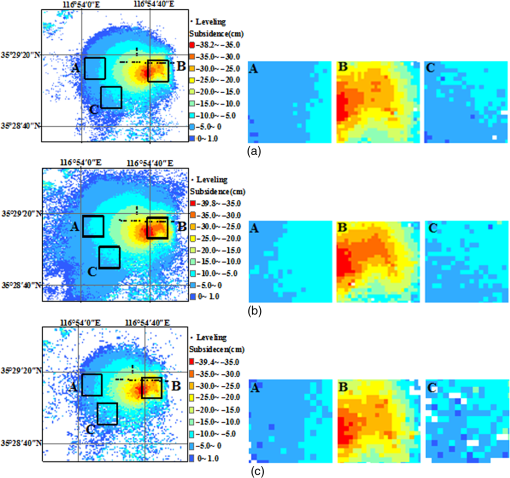 As can be seen from Fig. 9, three fan-shaped subsidence areas (broad in the west and narrow in the east) are monitored by two-pass DInSAR with three external DEMs, which are consistent in subsidence locations, distributions, and trends. These display differences mainly in three aspects: (1) values of monitored subsidence are different. For example, the largest monitored subsidence values are , , and , respectively. (2) Coverage areas of monitored subsidence are obviously different. Specifically, the areas from largest to smallest are the differential results of three external DEMs with 30-, 25-, and 90-m ground resolution. (3) Continuities of monitored subsidence are different. The continuity of subsidence monitored by 90-m resolution external DEM is worst, especially at the edge of the subsidence areas, and spots are more obvious, intermittent, and scattered. It follows that DEMs with high resolution are beneficial to maintain the continuity and integrity of subsidence values, especially in the edge regions. We collected leveling-measured mine subsidence values at 23 leveling benchmarks between January 9, 2009, and February 24, 2009, in the Dongtan mine area, shown in Fig. 9 with black points and numbered in sequence of from left to right and from bottom to top. Table 4 and Fig. 10 show the comparisons between four types of subsidence values derived from leveling and from two-pass DInSAR with three external DEMs. Table 4Comparisons between four types of subsidence values monitored by DInSAR and leveling of Dongtan mine.
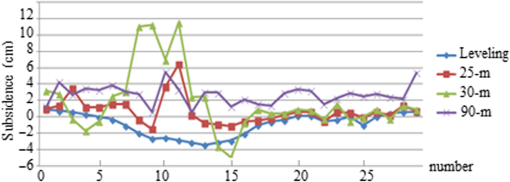
As can be seen from Table 4 and Fig. 10, the 18 benchmarks numbered by 1 to 12 and 18 to 23, the subsidence trends, and values monitored by two-pass DInSAR with three external DEMs show good agreement. For example, the statistical calculation indicates that the largest and mean differences between two types of subsidence monitored by two-pass DInSAR with 25- and 30-m ground resolution DEM are and . Compared with leveling-measured subsidence, the subsidence trends gradually increasing from the edge toward the center of subsiding regions are monitored, but the values of subsidence given from the DInSAR data are much larger than those determined by leveling. The distributed intervals of subsidence values monitored by two-pass DInSAR with three external DEMs and leveling are , , , and , respectively. In addition, for the five benchmarks numbered 13 to 17 with larger subsidence values distributing in , the subsidence trends and values monitored by DInSAR with three external DEMs show obvious differences, especially in the 16th benchmark. Compared with leveling-measured subsidence, the subsidence trend monitored by DInSAR with 30-m resolution external DEM is basically consistent and the difference of values is relatively smaller, while the difference of subsidence trend and values of 25-m resolution DEM is larger, However, the subsidence trend of 90-m resolution DEM is completely inconsistent and the subsidence values are also quite different. Finally, leveling benchmarks are not arranged along the center line of subsidence, so it is not possible to determine the real central location, spatial distribution, maximum magnitude of mine subsidence, and other details using only the subsidence values of these leveling points. DInSAR data, however, address the above shortcomings and reconstruct intuitively the distribution, trend, and other subsidence information during the imaging period. However, two types of subsidence magnitude derived from two-pass DInSAR and from leveling cannot agree with each other very well mainly because, first, the period of leveling-measured subsidence cannot be completely consistent with that of DInSAR, and, second, leveling-measured subsidence can only reflect the subsidence of a “point,” whereas DInSAR-monitored subsidence reflects the subsidence of a “surface,” of in this case. Thus, the comparison between the two types of subsidence in this test is to compare a point with a surface. 5.2.Land Subsidence in the Yangcun Mine AreaThe second interferometric pair was also processed using the processing procedure for test data shown in Fig. 6. Figure 11 shows the enlarged images of the Yangcun mine area, from left to right sequentially corresponding to the original and enhanced differential interferograms, coherence images, unwrapped phase images, subsidence images, and from top to bottom, respectively, corresponding to the differential results of three external DEMs with 25-, 30-, and 90-m ground resolution. Fig. 11Enlarged images of Yangcun mine: (a) original differential interferograms, (b) enhanced differential interferograms, (c) coherence images, (d) unwrapped phase images, and (e) subsidence images. 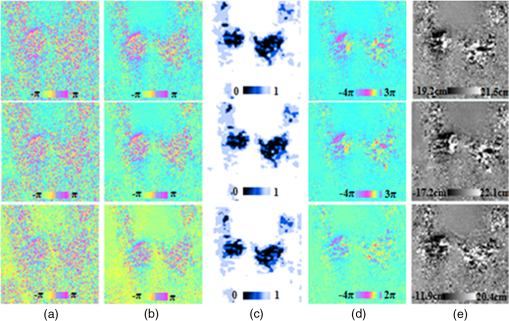 As can be seen from Fig. 11, the coherences of the subsidence area are lower (average coherence coefficients are all about 0.3), no interferometric fringes are formed, the monitored subsidence results are spotty and discontinuous, and all are, therefore, less reliable and accurate than those of the Dongtan area. The monitored subsidence images of Fig. 11 are geocoded back to local map projections and overlaid on the GIS vector information to obtain the subsidence maps of Fig. 12. Fig. 12The geocoded subsidence maps of Yangcun mine from (a) 25-m ground resolution DEM, (b) 30-m ground resolution DEM, and (c) 90-m ground resolution DEM. 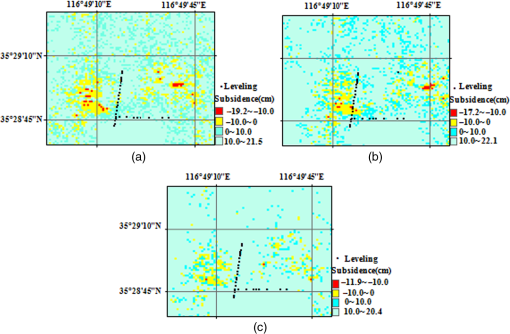 As can be seen from Fig. 12, the two subsidence areas on the left and right monitored by two-pass DInSAR with three external DEMs agree with the two locations of low-coherence regions of Fig. 11(c). It is therefore considered that the areas of subsidence can be detected by DInSAR in the low-coherence regions. In addition, the differences of subsidence values monitored in the low-coherence regions by two-pass DInSAR with three external DEMs are greater than those in high-coherence regions. For example, the largest monitored subsidence values are , , and , respectively. We collected leveling-measured mine subsidence values at 29 leveling benchmarks between February 12, 2010, and March 22, 2010, in the area of the Yangcun mine, and the layout of these benchmarks is shown in Fig. 12 with black points and numbered in sequence of from top to bottom and from left to right. Table 5 and Fig. 13 show the comparisons between four types of subsidence derived from leveling and from two-pass DInSAR with three external DEMs. Table 5Comparisons between the four types of subsidence of Yangcun mine.
As can be seen from Table 5 and Fig. 13, the monitored values of 29 benchmarks show that smaller subsidence and uplift appear in this area. The statistical calculation indicates that subsidence appears in 17 benchmarks, with a maximum magnitude of , uplift appears in 10 benchmarks, with a maximum magnitude of 0.9 cm, and 2 benchmarks show no measured change in elevation. For three differential results of two-pass DInSAR with 25-, 30-, and 90-m ground resolution DEMs at locations corresponding to the 29 benchmarks, the result determined from the 25-m DEM indicates that subsidence occurs around 10 points, with a maximum of and uplift appears around 19 points, with a maximum of 6.4 cm. The result determined from the 30-m DEM indicates that subsidence occurs around 9 points, with a maximum of and uplift appears around 19 points, with a maximum of 11.5 cm and there is no measurable change around one point. The result determined from the 90-m DEM indicates that uplift occurs around all 29 points, with a maximum value of 5.5 cm. In low-coherence regions with small subsidence magnitude, the subsidence values monitored by two-pass DInSAR with three external DEMs show larger differences with each other, and all of them are relatively inconsistent with leveling-measured subsidence values. In other words, two-pass DInSAR with three external DEMs did not derive the relatively reliable subsidence values in these areas. Comparatively speaking, however, the subsidence trends and values monitored by two-pass DInSAR with 25-m ground resolution DEM show best agreement with those of the 29 benchmarks and the differences are relatively smaller in benchmarks 1, 2, 4, 9, and 16 to 29. The subsidence values measured using the 30-m ground resolution DEM show smaller differences in the benchmarks numbered 14 and 16 to 29. The subsidence values measured using the 90-m ground resolution DEM change gently and show large differences from values measured at the 29 benchmarks. 6.ConclusionsThis study used different external DEMs in monitoring mine subsidence by two-pass DInSAR, leading to the following specific conclusions:
AcknowledgmentsThis study was supported by the National Natural Science Foundation of China (Nos. 41274007 and 41404003), the Taishan Scholars Program of Shandong Province, China (No. TSXZ201509), the Scientific Research Foundation for the introduction of talent of Shandong University of Science and Technology (No. 2014RCJJ047), the Innovation Project for the Graduates of Shandong University of Science and Technology (Nos. SDKDYC170206 and SDKDYC170208). ReferencesZ. Y. Wang, J. X. Zhang and G. M. Huang,
“Precise monitoring and analysis of the land subsidence in Jining coal mine area based on InSAR technique,”
J. China Univ. Min. Technol., 43
(1), 169
–174
(2014). Google Scholar
M. Jiang et al.,
“A study on the maximum and minimum detectable deformation gradients resolved by InSAR,”
Chin. J. Geophys., 52
(7), 1715
–1724
(2009). http://dx.doi.org/10.3969/j.issn.0001-5733.2009.07.006 Google Scholar
D. T. Sandwell, U. Megmuller and C. L. Werner,
“JERS SAR interferometry for land subsidence monitoring,”
IEEE Trans. Geosci. Remote Sens., 41
(7), 1702
–1708
(2003). http://dx.doi.org/10.1109/TGRS.2003.813273 IGRSD2 0196-2892 Google Scholar
X. F. He and M. He, Processing Method and Comprehensive Measurement of Ground Observation in InSAR, Science Press, Beijing
(2012). Google Scholar
G. X. Liu,
“Error propagation in InSAR system,”
Surv. Mapp. Sichuan, 28
(2), 92
–95
(2005). Google Scholar
Z. H. Li, J. N. Liu and C. J. Xu,
“Error analysis in InSAR data processing,”
Geomatics Inf. Sci. Wuhan Univ., 29
(1), 72
–76
(2004). http://dx.doi.org/10.13203/j.whugis2004.01.016 Google Scholar
S. X. Long et al.,
“Comparative study on phase sensitivity of reference DEM error and ground deformation to D-InSAR,”
J. Guilin Univ. Technol., 29
(1), 110
–113
(2009). Google Scholar
S. X. Long and T. Li,
“Phase sensitivity study on D-InSAR for reference DEM and orbit error,”
Remote Sens. Inf., 2
(24), 3
–6
(2009). Google Scholar
C. Hirt, M. Filmer and W. Featherstone,
“Comparison and validation of the recent freely available ASTER-GDEM verl, SRTM ver4.1 and GEODATA DEM-9S ver3 digital elevation models over Australia,”
Aust. J. Earth Sci., 57
(3), 337
–347
(2010). http://dx.doi.org/10.1080/08120091003677553 AJESE7 Google Scholar
C. L. Li et al.,
“Assessment of two-pass DInSAR measurement results under the influence of multisource external DEMs,”
Remote Sens. Inf., 28
(1), 95
–101
(2013). Google Scholar
D. Massonnet and K. L. Feigl,
“Radar interferometry and its application to changes in the earth’s surface,”
Rev. Geophys., 36 441
–500
(1998). http://dx.doi.org/10.1029/97RG03139 REGEEP 8755-1209 Google Scholar
H. M. Ng, L. L. Ge and X. J. Li,
“Assessments of land subsidence in the Gipps Land Basin of Australia using ALOS PALSAR data,”
Remote Sens. Environ., 159 86
–101
(2015). http://dx.doi.org/10.1016/j.rse.2014.12.003 Google Scholar
D. Zhou, K. Wu and R. Chen,
“GPS/terrestrial 3D laser scanner combined monitoring technology for coal mining subsidence: a case study of a coal mining area in Hebei, China,”
Nat. Hazards, 70
(2), 1197
–1208
(2014). http://dx.doi.org/10.1007/s11069-013-0868-7 NAHZEL 0921-030X Google Scholar
The geospatial data cloud of the Computer Network Information Center, “DEM digital elevation data,”
http://www.gscloud.cn Google Scholar
S. Gergely, K. S. Sudhi and S. Szilard,
“Slope angle and aspect as influencing factors on the accuracy of the SRTM and the ASTER GDEM database,”
Phys. Chem. Earth Parts A/B/C., 83 137
–145
(2015). http://dx.doi.org/10.1016/j.pce.2015.06.003 Google Scholar
C. Jing et al.,
“Comparison and validation of SRTM and ASTERG DEM for a subtropical landscape in Southeastern China,”
Int. J. Digital Earth, 7
(12), 969
–992
(2014). http://dx.doi.org/10.1080/17538947.2013.807307 Google Scholar
Y. C. Yan, S. W. Zhang and S. P. Yue,
“Evaluation of SRTM data quality in area of undulating hills of Northeast China,”
J. Grad. Sch. Chin. Acad. Sci., 25
(1), 41
–46
(2008). Google Scholar
J. Y. Chen,
“Quality evaluation of topographic data from SRTM3 and GTOPO30,”
Geomatics Inf. Sci. Wuhan Univy., 30
(11), 941
–944
(2005). http://dx.doi.org/10.13203/j.whugis2005.11.001 Google Scholar
Q. X. Tao and G. L. Liu,
“Properties of L-band differential InSAR for monitoring mining-induced subsidence in coalfield of Jining, Northern China,”
J. Cent. South Univ., 21
(4), 1508
–1517
(2014). http://dx.doi.org/10.1007/s11771-014-2091-4 Google Scholar
BiographyQiuxiang Tao has received her BEng degree in surveying engineering, her MEng degree in geodesy and surveying engineering, and PhD in photogrammetry and remote sensing from the College of Geomatics, Shandong University of Science and Technology, Qingdao, China, in 2001, 2004, and 2009, respectively. She is currently an associate professor in the College of Geomatics, Shandong University of Science and Technology. Her research interests include interferometric synthetic aperture radar (InSAR), differential interferometric synthetic aperture radar, short spatio-temporal PS InSAR technology, and their applications. Tengfei Gao is currently pursuing her MEng degree in geodesy and surveying engineering at Shandong University of Science and Technology, Qingdao, China. Her research interests include InSAR technology and its application. Guolin Liu has received his PhD in surveying engineering from China University of Mining and Technology, Xuzhou, China, in 1999. He is currently a professor in the College of Geomatics, Shandong University of Science and Technology. His research interests include the theories and applications of modern surveying data processing, InSAR technology, and its application. Zhiwei Wang has received his BEng degree in surveying engineering and his MEng degree in geodesy and surveying engineering from Shandong University of Technology, Zibo, China, in 2011 and 2012, respectively. He is currently pursuing his PhD in geodesy and surveying engineering, Shandong University of Science and Technology, Qingdao, China. His current research interests include InSAR technology and its application. |
||||||||||||||||||||||||||||||||||||||||||||||||||||||||||||||||||||||||||||||||||||||||||||||||||||||||||||||||||||||||||||||||||||||||||||||||||||||||||||||||||||||||||||||||||||||||||||||||||||||||||||||||||||||||||||||||||||||||||||||||||||||||||||||||||||||||||||||||||||||||||||||||||||||||||||||||||||||||||||||||||||||||||||||||||||||||||||||||||||||||||||||||||||||||||||||||||||||||||||||||||||||||||||||||||||||||||||||||||||||||||||||||||||||||||||||||||||||||||||||||||||||||||

