|
|
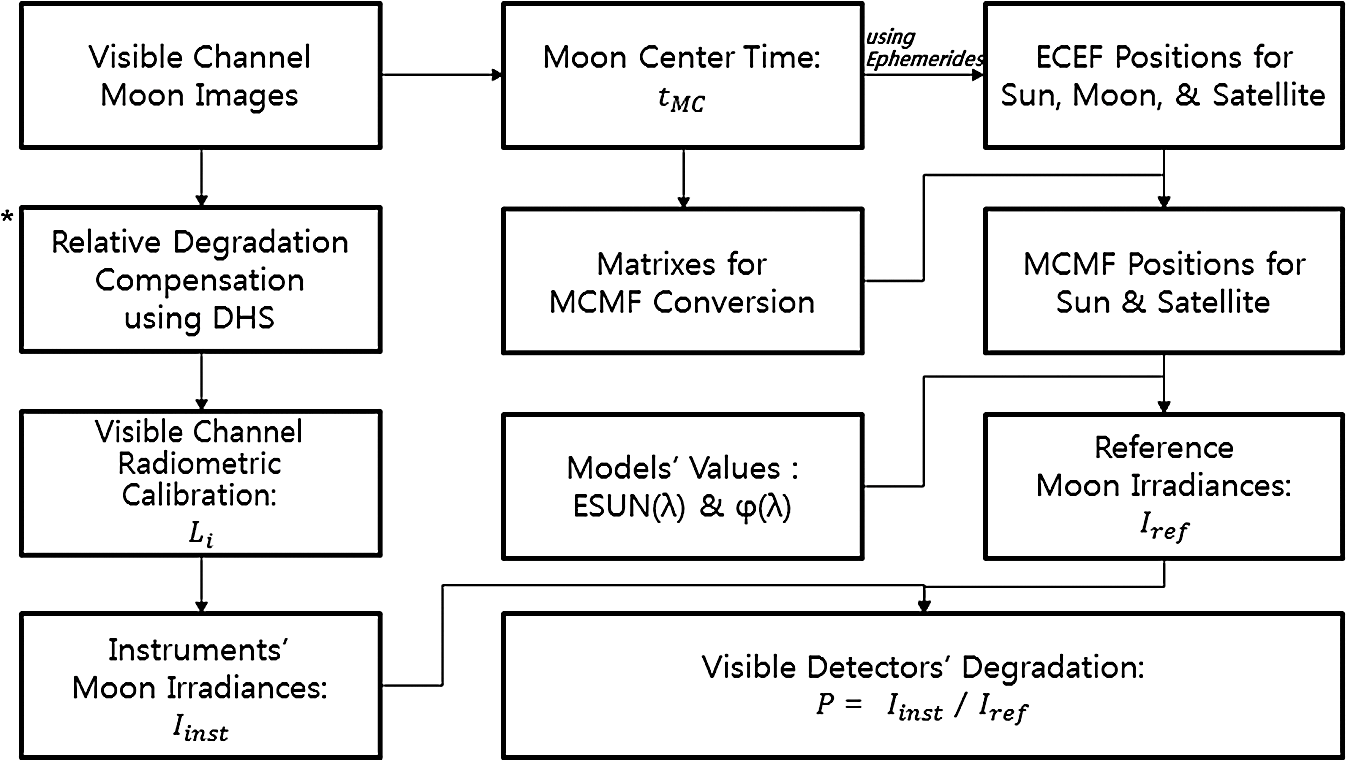
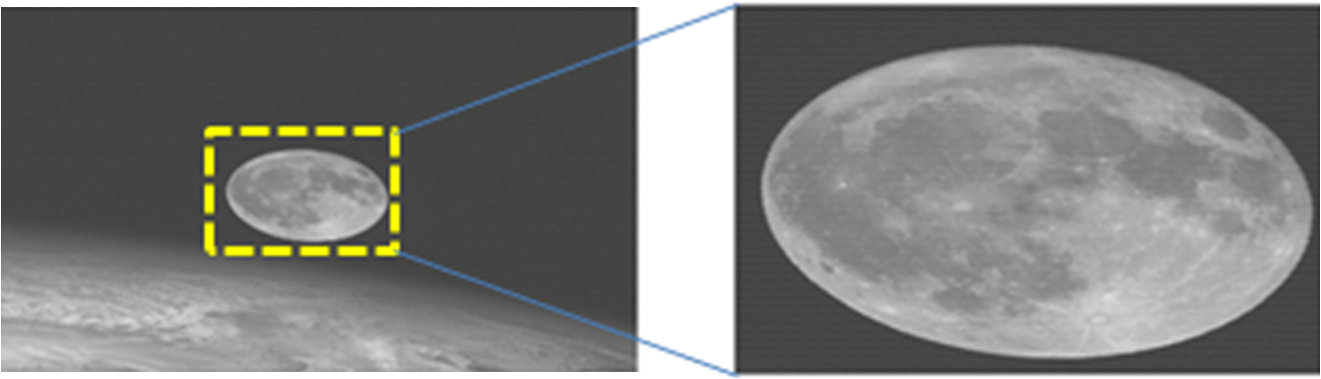
1.IntroductionThe visible channels of most of the operating meteorological imagers (MIs) on geosynchronous (GEO) satellites do not have onboard calibration targets and use a vicarious calibration.1 Homogeneous and stable targets such as the Moon, Dome-C (in a polar region), a desert, and deep convective clouds are used for vicarious calibration.2,3 Among these targets, Dome-C and desert sites have an advantage in that they can be used for both visible and near-infrared channels.2 However, there are some limitations: the revisit time for the low Earth orbit satellite measurements and nonaccessible areas for the GEO-based observations. Deep convective cloud targets require both infrared and visible channels data.3 On the other hand, lunar calibration has many advantages. In particular, the Moon surface plays the role of a robust calibration target due to its similar brightness to the land of Earth except for the cloudy regions.4 In addition, the Moon does not have an atmospheric effect, which accounts for an erroneous impact on the measurement from the imager. The International Satellite Cloud Climatology Project (ISCCP), led by the US, the EU, Japan, and China (1983 to present), gathers Earth radiance data and conducts a routine vicarious calibration on the visible channels of the various GEO satellites. Moon measurement data acquired from the advanced very high-resolution radiometer and the moderate resolution imaging spectrometer (MODIS) are used. Moon observations from a total of 10 satellites (from a minimum of 5 to maximum of 27 Moon image data per satellite) are usually used for the vicarious calibrations.5 For the trend of monitoring the visible instrument of sea-viewing wide field-of-view sensor, a lunar calibration method was also adopted.1 The lunar calibration overcomes an intrinsic limitation of comparing data with different temporal and spatial characteristics driven by the satellite viewing geometries.6 The measured relative calibration accuracy regarding the GOES-10 was compared with the vicarious calibration result of MODIS.7 At least one Moon image acquisition per month is recommended.5 Usually two to four times Moon observations per month are available for space-borne visible imagers.7 The MI on the COMS has been operating successfully since its launch (June 27, 2010). It monitors meteorological phenomena 24/7 using one visible and four infrared channels.8 Lunar calibration has been implemented on the MI based on a robotic lunar observatory (ROLO) model to monitor MI visible-channel degradation. Forty-two months of Moon images acquired from the MI were investigated. 2.Visible Channel Performance-Degradation Analysis Based on a Robotic Lunar Observatory ModelThe Moon can be used to monitor the degradation of satellite instruments with sufficient accuracy. The stable lunar surface provides a reliable means for calibration of Earth-viewing imagers. For the calibration of space-borne imagers with a reliable “ground truth,” the United States Geological Survey developed a model known as ROLO,9 which uses the Moon images to analyze the in-orbit response characteristics of the NASA Earth observing system satellite payloads. Computed radiances of the Moon based on a ROLO model, which uses the Sun/Moon/satellite distances, play a role in reference values. However, the observed radiances of the Moon from the imager contain actual degradation information on the instrument for the visible channel. Therefore, the degradation of the visible channel can be computed simply by using the ratio between two radiances (irradiance from a statistical model and one from the imager).7 In this section, we describe how the visible channel degradation rate is computed. 2.1.Computation of the Moon’s Irradiance Based on the Robotic Lunar Observatory ModelWhen the distances among the Sun, Moon, and satellite are known, the irradiance of the Moon is computed as10 When the locations of the Sun, Moon, and satellite are determined, the Moon-satellite distance [] and Moon-Sun distance [] are computed. The irradiance based on the ROLO model [] is computed by integrating all the individual irradiances, , over the entire spectral range of the visible channel (550 to 800 nm). Then it is normalized by the instrument’s spectral response function, as shown in Eq. (2):6 The ROLO irradiance as a function of the effective disk reflectance for a given wavelength is calculated as6 Here, is the disk-equivalent reflectance, is the solid angle of the Moon at a standard distance (),7 and is the solar spectral irradiance (). The disk-equivalent reflectance in Eq. (3) is defined as10 where is the absolute phase angle (rad), and are the selenographic latitude and longitude of the satellite (deg), and is the selenographic longitude of the Sun (rad). To determine the disk-equivalent reflectance, the observation times of the Sun, Moon, and satellite are required and Earth-centered Earth-fixed (ECEF) coordinates need to be converted to Moon-centered Moon-fixed (MCMF) coordinates.112.2.Irradiance Computation Based on the Acquired Moon ImagesThe instrumental irradiance [] based on the observed Moon image in which the radiometric correction process has been completed is computed as5 where is the solid angle (sr) of a pixel corresponding to one visible detector (), is the pixel in the Moon image, and is the total number of pixels in the lunar disk image. is an individual pixel radiance measurement of the Moon (), is the ratio corresponding to the oversampling by the MI along the E-W axis, is the slope value in a radiometric calibration equation of the visible channel, is the raw number of counts from the detector, and is the average raw number of counts from space-look observations.2.3.Degradation Rate ComputationIt is assumed that the degradation of the instrument is reflected in the Earth- and space-look observation data from the imager. The ratio between the Moon irradiance measured from the imager and the model-based reference irradiance7 shows the degradation trend over time.7Here, is the Moon irradiance measured by the MI and is the Moon irradiance computed from the ROLO model under the same conditions. Therefore, the long-term time series of can be interpreted as a linear trend of the visible channel degradation. 3.Implementation for the COMS MIThe procedures of lunar calibration implemented in the COMS MI visible channel are described. 3.1.Moon Observation Time and Estimation of the Sun/Moon/Satellite LocationsThe flight dynamic subsystem (FDS) of COMS generates the predicted locations of the Sun/Moon/satellite system at intervals, respectively. The duration of Moon measurement time from the COMS MI is about 47 s. The UTC time when the center of the Moon is scanned by the MI is used as the reference time. With this reference time, the positions of Sun/Moon/satellite are determined using the predicted data from the FDS.11 The reference time must be converted to Julian Century () to compute the ROLO model-based location of the Moon.11,12 3.2.Effective Moon Image Cropping and Direct Histogram Specification ProcessThe original pixel size of the Moon image acquired from the MI visible channel is . This image includes many parts of the space area observations. In the calibration process, the reduced effective image () on which the Moon is centered is used. The COMS MI images were acquired from the repetitive motions of the scanner with the eight detectors located vertically.8 The performances of the eight detectors were slightly different from the initial operation period; hence, the degradation rates also differ from each other. The Moon images compensated (normalized) by the best detector based on the direct histogram specification (DHS) were used in the analyses (Fig. 1).13 Fig. 1Compensation of the relative difference between detectors using direct histogram specification (DHS). 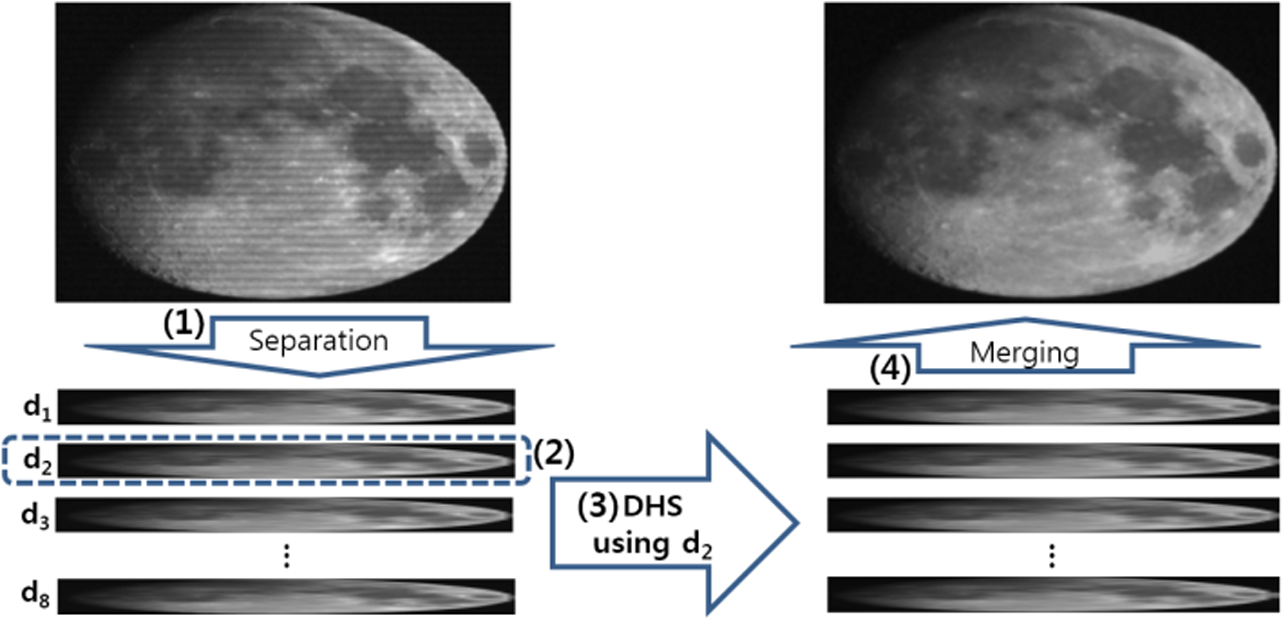 Figure 1 illustrates a method for compensating the relative degradation differences among the eight detectors: (1) Separation of the Moon image according to each detector, (2) selection of the best (reference) detector , (3) application of the DHS to the remaining detectors, and (4) generation of the Moon image normalized by the reference detector. 3.3.Refinement of the Moon Image Samples Based on the Absolute Phase AnglesFigure 2 shows the computed reference irradiance and the absolute phase angle of the Moon.11 On a daily basis, these two values (red; right -axis and blue; left -axis) are computed using the Analytical Graphics Inc., satellite tool kit based on the geolocation information of the Sun/Moon/COMS satellite system with ECEF coordinates at 00:00:00 (UTC). The coordinates of the Sun and Moon were obtained from the DE405 ephemeris data of the Jet Propulsion Laboratory.14 A two-body motion equation was employed by assuming that there were some maneuvers (e.g., station keeping) of the COMS spacecraft for an orbit adjustment. Fig. 2Moon irradiance and absolute phase angles computed from satellite tool kit (January to March 2010).  Figure 2 indicates that there is a cycle in the values: , . Meaningful irradiances of the Moon are represented in certain ranges. Therefore, only data within 5 deg to 45 deg were selected for the Moon’s irradiance computation. Since the monthly lunar observation times were not consistent and some measurement data were excluded due to the phase-angle criteria, the Moon observation time was converted into Julian Century format to remove this dependence on the time interval. 3.4.Computation of the Individual Detector’s DegradationWhen the relative degradation of the eight detectors was compensated using the DHS technique, the detector, which shows the lowest degradation rate, was selected as a baseline detector.13 Consequently, the radiometric characteristics of the entire Moon image were transformed to that of the baseline detector. The entire procedure for computing the degradation of the COMS MI visible channel based on the optimized Moon data, which are described in Secs. 2 and 3, is summarized in Fig. 3. The COMS MI visible channel degradation is represented by , which is a ratio between two irradiances: the Moon irradiance based on the ROLO model and the observed irradiance from the MI. In the computation, only data that meet the absolute phase angle criteria (5 deg to 45 deg) were used. During the computation of the Moon’s irradiances, conversion of the Julian Century for the Moon measurement time and matrices for MCMF conversion are required. During the Moon irradiance computation using the observed Moon image, was computed using the relative degradation compensation technique, DHS, for all eight detectors (repeat eight times for * in Fig. 3). Finally, the first-order linear trend was obtained for the COMS MI visible channel with the computed over the COMS mission period (2010 to present). 4.ResultsImplementation of the computation of Moon irradiance based on the COMS MI is described in this section. 4.1.Data for the MI Lunar CalibrationFor the MI visible channel degradation analyses, a total of 42 months of Moon observation (July 2010 to December 2013) data from the COMS MI were used. Moon image acquisition was not performed for two cases (October 2010 and January 2011). The total number of Moon image samples was 40, and the intervals of the acquisitions were a minimum of 14 days and a maximum of 55 days. The available opportunity for effective Moon observations at a geostationary orbit was from two to four times per month.7 However, due to constraints on the lunar observations such as a full-disk observation time interval (every 3 h) and the station-keeping maneuvers, at least one lunar measurement per month from the COMS routine operation is not guaranteed. As a result, a special Moon measurement planning using a local area (LA) observation mode was applied in the MI during the COMS normal operation (starting from April 1, 2011).15 Monthly Moon image acquisition using the MI LA mode was conducted twice for a 1-h duration. Either of the two images was appropriate for the analyses because the Sun/Moon/satellite location change is negligible during this period. However, when space-look (for calibration) was performed during the Moon image acquisition, inconsistency between the line-by-line measurements from the MI scanning occurred (Fig. 4). During the whole COMS operation period (July 2010 to present), only one case (July 28, 2010, 05:26:03 UTC), which contains the space-look observation, was found. In this case, an alternative observation (04:15:23 UTC) was used. The size of images taken for the lunar calibration was reduced to focus only on the Moon-centered area (; Fig. 5). 4.2.Selected Data Using the Phase-Angle CriteriaFirst, the absolute phase angle of the Moon was calculated based on the observation time. Moon images, which were not attributed to the phase angle criteria (5 deg to 45 deg), were removed from the analyses. Sixteen out of a total of 40 Moon samples were screened out. The phase angles of the eliminated images are indicated in Fig. 6. After this data selection process, the Moon image acquisition intervals were 26 to 122 days. 4.3.Julian Century ConversionFor the visible channel’s degradation trend analysis with a first-order linear regression, the Moon measurement time was converted to a Julian Century to remove the dependency of the observation interval. In addition, it was normalized by indicating the degradation rate, , from 0 to 1. 4.4.Moon Irradiance Computation Based on the Robotic Lunar Observatory ModelTable 1 shows an example of the Moon irradiance computation (ROLO model-based) intermediate results.11 Data taken on July 28, 2010, (04:16:08 UTC) were used. Table 1Intermediate results for the Moon irradiance (July 28, 2010, 04:16:08 UTC) computed based on the ROLO model.
4.5.Moon Irradiance Computation Using the Observed Moon Data with DHSMoon image resizing for a selection of effective Moon regimes and normalization of detectors using the DHS scheme was applied to the Moon irradiance computation using the acquired COMS MI images. Figure 7 shows the result for a selected case (March 7, 2012, 02:58:43 UTC). The stripping effect that is observed in the left image was clearly eliminated by the normalization process with the reference detector (fourth detector). Because the radiance of the Moon is sufficiently bright compared with that of deep space (cosmic background), the area of the Moon can be extracted with respect to space (Fig. 8). In Fig. 8, the deep-space region can be contrasted with the Moon. The left image shows the Moon in black, while the right image represents the Moon calibrated with DHS over a white-space background. Computation of the Moon irradiance (acquired from the MI) requires Eq. (4) and the DHS process. In the computation, the value was , the instantaneous field-of-view was of the COMS MI visible channel, and the oversampling ratio was ( and ). 4.6.Degradation Rates of Individual Detectors for the Visible ChannelsTable 2 shows the results of the degradation rate and the first-order regression equation of each of the eight detectors. A total of 24 Moon samples within the phase angle range of 5 deg to 45 deg, which were observed from July 2010 to December 2013, were used for the analysis. The mean degradation rate for each Moon sample and the intermediate result are shown in Table 3. Table 2Degradation rates for eight individual detectors over a 42-month period (July 2010 to December 2013).
Table 3Mean degradation rates for each lunar observation.
In Table 2, was converted from to Julian Century . Next, it was normalized by setting the first measurement (July 28, 2010, 04:16:08) to zero and the last measurement (2013.12.22 07:28:41) to one. As a result, the degradation rate of each detector can be determined by applying “” in the regression equation in Table 2. The overall mean degradation rate of the instrument over the 42-month period was 6.59% (1.88% per year). Figure 9 shows the mean degradation trend of the COMS MI visible channel as a function of the time (normalized). 5.Discussion and ConclusionTo quantitatively monitor the degradation of the COMS MI visible channel, a vicarious calibration using 42 months of Moon image data from the MI was conducted. Twenty-four Moon samples, which considered the effective Moon phase angles, were used. The Julian Century was used to remove the dependency on the measurement interval, and the DHS scheme was used to compensate a relative variation among the eight detectors. The mean degradation rate of the MI visible channel instrument (Fig. 9) has a large fluctuation driven by the following reasons: (1) the reference irradiance () has a periodicity which has different shapes and maximum values,11 (2) the reference irradiance’s periodicity is about 29 days (Fig. 2), but the COMS MI obtains only one Moon image per 26 to 122 days (). As a result, the mean degradation rate trend cannot be extracted in the shape of the reference irradiance due to aliasing characteristics, (3) the reference irradiance has a large variability at the time of COMS spacecraft’s orbit adjustment (wheel off-loading or station keeping), and (4) the measured irradiances by the MI () contains errors driven by the pixel number on the boundary area between the Moon and Space,7 which is related to the shapes of the Moon. The results showed that the overall degradation rate over half of the COMS mission lifetime () was 6.59%, resulting in an annual degradation rate of 1.88%. This performance was much better than that of the GOES-10 imager ( degradation based on a lunar calibration method7). In addition, the individual degradation rates of eight detectors were from 3.79% to 8.19% (). This indicates that the difference between the best- and worst-performing detectors was about 1.26% per year. The results of our study can be applied in two parts. First, radiometric calibration for the COMS MI could be conducted by compensating the value with the difference () in Eq. (4). Second, input values for Earth observations and space-look measurements in the radiometric calibration equation can be tuned based only on the degradation rate (average of 1.26% per year) of the baseline detector with the DHS process. Because this approach is performed for each measurement cycle, the radiometric calibration process, which is used for any space-borne visible imager with multiple detectors, can be improved. AcknowledgmentsThe authors acknowledge J. Degremont and J.-L. Duquesne of Airbus Defense & Space (former EADS Astrium), Y.-R. Lee and D.-S. Kim of Satrec-Intiative, and the Korean Meteorological Administration, National Meteorological Satellite Center for their cooperation during the development of the COMS MI preprocessing system. ReferencesR. E. Eplee Jr.et al.,
“Comparison of SeaWiFS on-orbit lunar and vicarious calibrations,”
Proc. SPIE, 6296 629610
(2006). http://dx.doi.org/10.1117/12.679168 PSISDG 0277-786X Google Scholar
S. UpretyC. Cao,
“Radiometric and spectral characterization and comparison of the Antarctic Dome C and Sonoran Desert sites for the calibration and validation of visible and near-infrared radiometers,”
J. Appl. Remote Sens., 6 063541
(2012). http://dx.doi.org/10.1117/1.JRS.6.063541 1931-3195 Google Scholar
D. R. Doellinget al.,
“The characterization of deep convective cloud albedo as a calibration target using MODIS reflectances,”
Proc. SPIE, 7862 78620I
(2010). http://dx.doi.org/10.1117/12.869577 PSISDG 0277-786X Google Scholar
C. E. Crameret al.,
“Precise measurement of lunar spectral irradiance at visible wavelengths,”
J. Res. Natl. Inst. Stand. Technol., 118
(2013). http://dx.doi.org/10.6028/jres.118.020 JRITEF 1044-677X Google Scholar
T. C. Stoneet al.,
“Evaluation of ISCCP multisatellite radiance calibration for geostationary imager visible channels using the Moon,”
IEEE Trans. Geosci. Remote Sens., 51
(3), 1255
–1266
(2013). http://dx.doi.org/10.1109/TGRS.2012.2237520 IGRSD2 0196-2892 Google Scholar
H. H. Kiefferet al.,
“On-orbit radiometric calibration over time and between spacecraft using the Moon,”
Proc. SPIE, 4881 287
–298
(2003). http://dx.doi.org/10.1117/12.462611 PSISDG 0277-786X Google Scholar
X. Wuet al.,
“Vicarious calibration of GOES Imager visible channel using the Moon,”
Proc. SPIE, 6296 62960Z
(2006). http://dx.doi.org/10.1117/12.681591 PSISDG 0277-786X Google Scholar
National Meteorological Satellite Center, “Introduction of COMS,”
(2014) http://nmsc.kma.go.kr/html/homepage/en/chollian/choll_info.do ( October ). 2014). Google Scholar
U.S. Geological Survey, “Irradiance Model,”
(2014) http://www.moon-cal.org/modeling/irradiance.php ( October ). 2014). Google Scholar
H. H. KiefferT. C. Stone,
“The spectral irradiance of the Moon,”
Astron. J., 129 2887
–2901
(2005). http://dx.doi.org/10.1086/430185 ANJOAA 0004-6256 Google Scholar
S. B. SeoS. S. Yong,
“Moon ROLO irradiance calculation with coordinate transforms for detectors’ performance analysis of geostationary visible channel imagers,”
in International Symposium on Remote Sensing,
P069
(2014). Google Scholar
Astronomical Applications Department of the US Naval Observatory, “Julian Date Converter,”
(2014) http://aa.usno.navy.mil/data/docs/JulianDate.php ( October ). 2014). Google Scholar
S. B. Seo,
“Relative compensation method for the degradation of visible channel detectors using an improved histogram specification,”
Electron. Lett., 50
(6), 446
–447
(2014). http://dx.doi.org/10.1049/el.2013.3900 ELLEAK 0013-5194 Google Scholar
E. M. Standish,
“An approximation to the errors in the planetary ephemerides of the Astronomical Almanac,”
Astron. Astrophys., 417 1165
–1171
(2004). http://dx.doi.org/10.1051/0004-6361:20035663 AAEJAF 0004-6361 Google Scholar
Y. M. Cho,
“COMS normal operation for Earth Observation mission,”
Proc. SPIE, 8533 85331S
(2012). http://dx.doi.org/10.1117/12.974495 PSISDG 0277-786X Google Scholar
BiographySeok-Bae Seo is involved in the field of algorithm and software development for the satellite ground segment. He has been working in developing and validating the image preprocessing system of COMS. He is currently working for the Geostationary Environment Monitoring Spectrometer. Since 2001, he has been working in Korea Aerospace Research Institute after his MS degree and received his PhD degree in electronics engineering from the Dong-A University of Republic of Korea in 2010. Kyoung-Wook Jin received his BS degree from Seoul National University, Seoul, Republic of Korea, in 1994, and the MS and PhD degrees from Texas A&M University, College Station, Texas, USA, in 2001 and 2005, respectively. He has been working at the Jet Propulsion Laboratory, California Institute of Technology, Pasadena, California, USA, from 2005 to 2008. He is currently working on the AMI and KSEM payload development projects of the GK2 program at Korea Aerospace Research Institute, Daejeon, Republic of Korea, since 2008. |