|
|
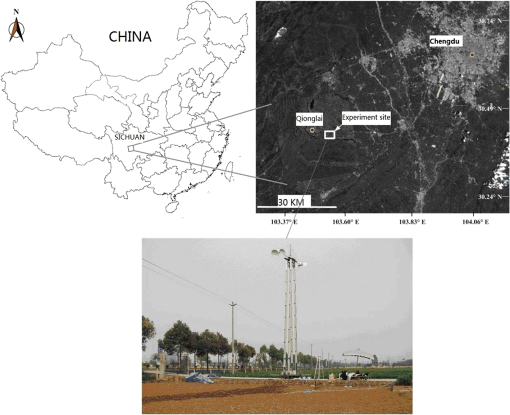
1.IntroductionMicrowave remote sensing has been a popular tool because of the distinct benefits such as retrieval of vegetation information, penetrability, and availability in all weathers. Wheat, as the second main crop in the world, is closely related to food security, economic development, and societal stability. Consequently, analyzing the radar backscatter characteristics of wheat has become an active research field in recent years.1,2 Further, backscatter modeling of wheat and biomass retrieval from SAR images has also been attributed great attention by the researchers.3–6 Scatterometers have been used to measure and analyze vegetation scattering characteristic because of their associated ease of use.7,8 Yihyun et al.9 analyzed the capacity of radar vegetation indices for monitoring wheat growth cycles at P-, L-, and C-bands. Mattia et al.10 studied the sensitivity of soil moisture and aboveground biomass on radar backscatter of C-band at copolarization. Mcnairn et al.11 assessed the usefulness of polarimetric radar data for monitoring wheat growth and yield. Stiles et al.12 studied the wheat measurements and modeled backscatter of wheat. He et al.13 modeled wheat radar backscatter by adapting Michigan microwave canopy scattering model (MIMICS). Huang et al.14 modeled radar backscatter based on vector radiative transfer theory focused on wheat ears. A greater number of satellites launched in recent years have resulted in increased availability of valuable synthetic aperture radar (SAR) images that can help to extend the research efforts related to wheat growth monitoring.15,16 Juan et al.17 analyzed the polarimetric characteristics and temporal variations of wheat in wheat growth stages using a polarization decomposition method based on multitemporal Radarsat-2 images. Based on the microwave scattering characteristics of wheat, both volume scattering and soil scattering comprise a major part of the total backscatter. However, the backscatter from wheat canopies is affected by many factors including: (1) the dielectric constant of wheat, as well its moisture content; (2) the distribution of the scatter in terms of size and shape for the wheat canopies; (3) the orientation distribution of the scatters in a canopy; (4) the roughness and dielectric constant of the underlying soil surface. Consequently, various parameters of vegetation and soil are studied by the researchers.18,19 Numerous studies based on the measurements made by scatterometers and SAR images focusing on biomass have been conducted.20,21 Considering the characteristics of wheat ears based on their different moisture contents and specific location, this work aims to analyze the scattering characteristics of wheat at a frequency of 5.3 GHz. The water-cloud model is a popular semiempirical model developed by Attema and Ulaby,22 and has been successfully and widely used.23,24 However, the water-cloud model cannot be easily applied for wheat ears, and it was thus modified by taking wheat ears into account to fit for the stages with wheat ears. Wheat canopy and the underlying soil are two important parts in water-cloud model, so the research simulated soil backscatter using the advanced integral equation model25 (AIEM), which has proven better to simulate soil backscatter.26 The simulation results from AIEM play an important role in the water-cloud model and the modified water-cloud model. Moreover, the water-cloud model and the modified water-cloud model were applied to retrieve wheat biomass from advanced synthetic aperture radar (ASAR) images for the two different growth periods, i.e., with and without wheat ears. The retrieved biomass was compared with the measured biomass for verifying the accuracy of the two retrieved models in retrieving biomass information from the SAR images. 2.Study Area and Data AcquisitionThe research and demonstration site for our study is located in Qianjin town, Qionglai, Chengdu, Sichuan Province, China (north latitude and east longitude ; Fig. 1). The site is spread across 3 hectares and its topography is smooth with an elevation of 483 m. In this area, wheat and rice are the main cereal crops. The scattering measurements and ASAR data were obtained from a ground-based radar scatterometer and the Envisat, respectively. The ground-based scatterometer is a frequency-modulated continuous-wave (FM-CW) full-polarization radar with a dual-antennae system, which can maintain monostatic radar performances. In addition, the scatterometer can obtain backscattering coefficients for incidence angles from 0 deg to 90 deg and azimuth angles from 0 deg to 360 deg. A 12.5-m high hydraulic lift that can accommodate for far-field conditions during the measurements provides the supporting platform for the scatterometer. The polarimetric calibration of the scatterometer system is performed using the single-target calibration technique27 through the measurement of the cross section of the conducting triangle reflector. A sufficient number of independent samples to reduce the speckle noise and to increase the accuracy of measurements using filtering methods were critical to the measurements. More than 36 independent samples were necessary to guarantee a 90% confidence level,1 and the independent samples in the radar footprint area should have contained the same number of resolution cells. Equation (1) was used to calculate the number of independent sample where indicates the number of independent samples, shows the height from the antenna to the surface, indicates beam width, is the modulation band of the scatterometer, is the incidence angle, and is the speed of light.The main technical parameters of the scatterometer along with the band details of the dual-antennae at a frequency of 5.3 GHz are shown in Table 1. Table 1Main technical parameters of the ground-based scatterometer.
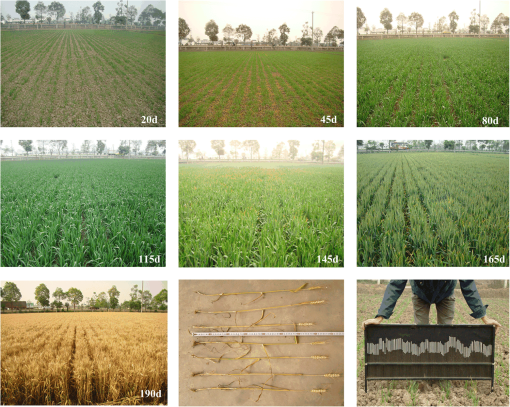
For instance, at a height of 12.5 m and an incidence angle of 45 deg, the scatterometer at 5.3 GHz frequency contains about 12 resolution cells; therefore, the number of required independent samples can be achieved by acquiring 20 nonoverlapping footprints. Assuming the calibration and statistical errors to be independent, the overall system error for the measurements can be estimated as . The life cycle of wheat at the experimental site includes about 200 growth days from October to May, and we carried out our scattering measurements during an entire wheat growth cycle (Fig. 2). Growth stages are critical in the entire cycle of wheat growth; therefore, Feekes scale28 was used for selecting growth stages indicating different growth conditions after planting. Various parameters obtained for the 20th day (tillering initiation, November 16), 45th day (advanced tillering, December 10), 80th day (stem extension: jointing, January 15), 115th day (stem extension: booting, February 19), 145th day (heading, March 22), 165th day (flowering, April 12), and 190th day (ripening, May 8) are listed in Fig. 2. The backscattering coefficients were measured twice in an acquisition after calibration, and average values were used to guarantee robustness of data. Characteristics of the independent samples during the different wheat growth stages were adequately considered while obtaining wheat parameters in all the experiments. Data on fresh weight (total biomass and ear weight), structure (canopy length, leaf length, and ears length), leaf area index (LAI), and stem density were collected. More than 42 wheat samples were collected at each stage; the average values for the samples are shown in Table 2. Soil roughness was measured using two parameters: root-mean-square (RMS) height: 2.12 cm and correlation length: 15.26 cm. Soil roughness was only measured once (November 15, 2008, tillering initiation) during the entire wheat growth cycle, because it is considered to have little change during the entire growth cycle and could not be measured when wheat is high enough to block the device for roughness measurements.29 Soil moisture was measured using the gravimetric method and then converted to volume soil moisture. The last row in Fig. 2 shows the collected data on destructive sampling and soil roughness. Destructive sampling is critical for estimating biomass and retrieving detailed geometric characteristics of the various elements. Based on ASAR spatial resolution, we chose eight experimental points in the research area for measuring radar backscatter and ground parameters, which can be helpful to modify the water-cloud model, verify the accuracy of the retrieved biomass, and ensure the usability of the models. Table 2Growth data for winter wheat planted on October 27.
The ASAR images were obtained from Envisat, when the environment satellite was transmitted over the experimental site. The images (ascending, alternating polarization precision image) were shot with a resolution of on December 10, 2008, and May 8, 2009 (Table 3). Table 3ASAR images for the experimental site.
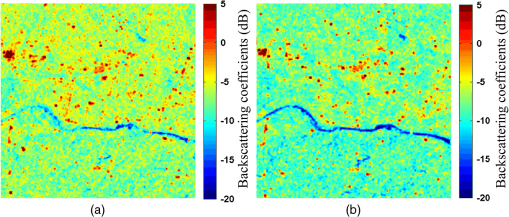
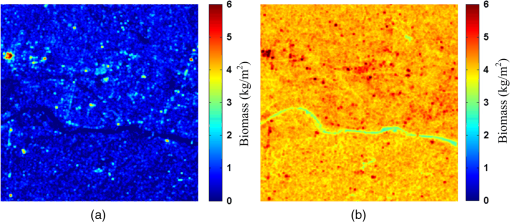
The NEST (Next ESA SAR Toolbox) software was used for image processing. The process included the following steps: radiometric correction, reprojection, speckle filtering, and coregistration. The geographic coordinate reference system Lat/Lon WGS84 and cubic method were chosen to reproject each SAR image. The ground control points were selected as 200 point, and the root mean squared threshold of pixel accuracy was fixed at 0.6. The filter window size was set at for spectral filtering. The data were exported as Geo-tiff products. We adopted the support vector method for classifying the entire area. In Fig. 3, a river runs across from west to east, and some buildings located in the town are visible. The smaller backscattering coefficients of water bodies are indicated in dark blue color, and the bigger backscattering coefficients of buildings are shown as red spots. The wheat crops can be distinguished from the light blue to yellow color. 3.Analysis of the Wheat Backscatter CharacteristicsBackscatter was analyzed at a frequency of 5.3 GHz (C-band) because this frequency is commonly employed in microwave remote sensing fields. The ASAR images synchronous with the measurement times were also made available. Since in, theory, the backscatter for cross-polarizations is equivalent for the same target, data from both the cross-polarizations were averaged for each set of measurements. Wheat ears are first visible at the heading stage, which affects not only the direct radar backscatter from wheat canopy but also the return radar backscatter from soil after double canopy attenuation.30 Therefore, our study separates the growth stage into before and after the heading stage to analyze the electromagnetic response from wheat, particularly wheat ears. The incidence angles were measured from 22 deg to 61 deg with an increment of 3 deg, and the lower and the higher incidence angles were discarded because they would be affected by the ground foundation of the machine and distant trees. The simulation results of the bare soil based on AIEM were also added to compare the influence of wheat on radar backscatter. 3.1.Backscatter at HH, VV, VH Polarization at Different PeriodsThe backscattering coefficients at horizontal–horizontal (HH), vertical–vertical (VV), and vertical–horizontal (VH) polarizations before and after the heading stage are shown in Fig. 4. The left columns in Figs. 4(a), 4(c), and 4(e) show the data before the heading stage, and the right columns in Figs. 4(b), 4(d), and 4(f) show the data after the heading stage. Results for HH, VV, and VH polarizations are shown in the first, second, and third rows, respectively. Fig. 4Backscattering coefficients varying with incidence angles before the heading stage (left column) and after the heading stage (right column): first row-HH, second row-VV, and third row-VH; (a), (c), (e) before the heading stage and (b), (d), (f) after the heading stage. 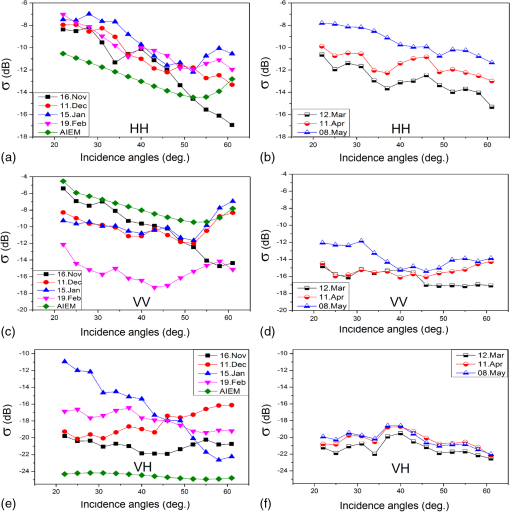 The normal tendency is for the backscattering coefficients to decrease with an increase in incident angles, and the backscatter trend shifts from soil scattering to volume scattering with an increase in wheat biomass. Moreover, the backscatter dominated by soil scattering drop faster than that dominated by volume scattering based on the water-cloud model.1 A comparison between the backscatter values of HH, VV, and VH polarizations shows that HH has the highest values because the vertical structure of wheat makes VV polarization of the electromagnetic wave suffer more attenuation, while VH values are the smallest in each phonological stage because of the secondary scattering of the stem surfaces.31 Figures 4(a) and 4(b) show the backscattering coefficients of wheat at HH polarization with varying incidence angles during the entire growth cycle. Before the heading stage, when wheat height is 8.2 cm on the 20th growth day, the total backscattering coefficients are very similar to those of bare soil. The backscatter drops faster which shows that soil scattering contribution dominates the total backscatter. The backscattering coefficients measured are bigger than those simulated by AIEM, and the difference between the measured and simulated values becomes zero at an incidence angle of 52 deg, which shows that wheat begins to affect backscatter; and high incidence angles reduce the influence of wheat on radar backscatter. The curves show a rise at the incidence angle of 52 deg on the 80th and 115th days; the likely reason for this rise is the soil scattering giving way to volume scattering. The soil moisture on the 80th day is the highest (42.2%) during the entire wheat growth cycle, and therefore the backscattering coefficients reach the highest value. After the heading stage, the backscatter trends are flat. The soil moisture and biomass are 27.1% and , and 30.5% and on the 115th and 145th days, respectively. However, the backscattering coefficients on the 145th growth day are smaller than those on the 115th growth day, which demonstrates that the wheat canopy contributed more to the backscatter attenuation. The soil moisture is 30.5% and 27.6% on the 145th and 165th days, respectively, and the values of biomass, LAI, and weight and length of wheat ears increase by , 0.99, , and 4.6 cm, respectively. The backscattering coefficients on the 165th day are larger than those on the 145th day, which shows that the backscatter returned directly from the wheat canopy increases because volume scattering dominates the total backscatter. As shown in Fig. 4, wheat ears play an important role in volume scattering. The backscattering coefficients on the 190th day are the biggest, because wheat ears increase the direct backscatter from the canopy with the highest fresh weight and length in the ripening stage. Moreover, the decrease in wheat moisture reduces the attenuation effect and the soil moisture contributes more to the total backscatter. Figures 4(c) and 4(d) show the backscattering coefficients of wheat at VV polarization with varying incidence angles during the entire growth cycle. The backscattering coefficients are affected by the soil during the experiment before the heading stage, and the simulation results obtained by AIEM are higher than those measured on the 20th day, which shows that the vertical structure of wheat increases the attenuation at VV polarization. The backscattering coefficients are smaller than the measurement on the 115th growth day with 27.1% soil moisture and biomass. This result shows that the higher biomass values increase the attenuation effects and reduce the total backscatter. Wheat ears grow larger after the heading stage and contribute more to the total backscatter. Because of the vertical structure of wheat, the difference in backscattering coefficients at VV polarization between the 145th and 165th days are smaller than that at HH polarization. The backscattering coefficients on the 145th day are smaller than those on the 165th day for incidence angles more than 43 deg. In addition, wheat ears are 5.2 cm long with 30.5% soil moisture on the 145th day and 9.8 cm long with 27.6% soil moisture on the 165th growth day, which shows that wheat ears increase the radar backscatter of VV polarization at higher incidence angles. Figures 4(e) and 4(f) show the backscattering coefficients of wheat at VH polarization with varying incidence angles during the entire growth cycle. Before the heading stage, on the 20th growth day, although wheat just appears in a large area, a certain impact from the wheat canopy is still observed on the echo energy at VH polarization. Because VH polarization is formed by soil and soil-wheat components,31 the backscatter is sensitive to soil scattering. The soil moisture on the 80th day is 42.2%, which makes the backscatter curves different from other curves. After the heading stage, the curves become flat, possibly because biomass attenuation, in particular the influence of wheat ears on backscatter, reaches a saturation point. The soil moisture is 38.4% and wheat biomass drops to on the 190th day, which shows that the wheat ears increase the attenuation between wheat canopy and the underlying soil in the ripening stage. As wheat ears may increase the backscatter at cross-polarization,14 longer wheat ears may also increase the backscatter compared with the shorter ones. 3.2.Relationship Between Backscatter and Ground ParametersIn order to better analyze the relationship between backscattering coefficients and wheat parameters, the co-polarization ratio (HH/VV) was adopted. To discriminate the soil and crop properties of the scattering surface, polarization discrimination ratio (PDR) was also given as follows:32 where and are the backscattering coefficients at VV and HH polarizations, respectively. Table 4 compares the correlation coefficients of multipolarization at incidence angles of 29 deg before the heading stage and 34 deg after the heading stage. The heading stage (145th day) is the time node for discriminating the wheat growth stages with and without wheat ears. HH29, VV29, VH29, HH/VV29, and PDR29 indicate the backscattering coefficients at polarization combination for incidence angles 29 deg at the stages without wheat ears, and HH34, VV34, VH34, HH/VV34, and PDR34 indicate the backscattering coefficients at polarization combination for incidence angles 34 deg at the stages with wheat ears.Table 4Correlation coefficients between backscatter and ground parameters.
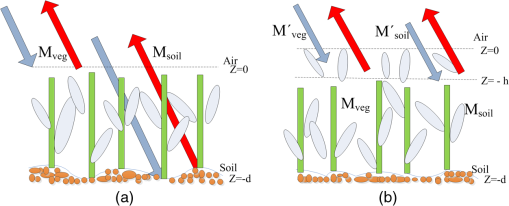
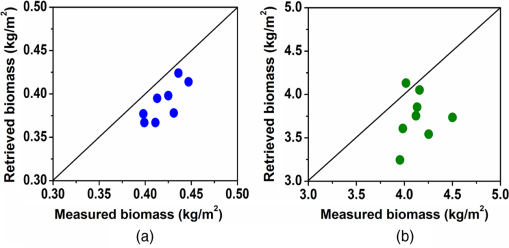
As can be seen from Table 4, the correlation coefficient between biomass and PDR34 reaches 0.95, and the correlation coefficient between LAI and VV29 is 0.94. Moreover, VH 34 is more sensitive to soil moisture. To develop a robust technique, an empirical model is not sufficient, the correlation between backscatter and wheat parameters, which would be helpful to wheat monitoring and modeling in remote sensing society, has been documented. 4.Adaptation of Water-Cloud ModelIn the wheat growth stage, wheat canopy scattering and soil scattering constitute the main parts of the total backscatter, and thus the water-cloud model was adapted by treating the canopy as cloud and soil as water.22,23 However, wheat canopy is composed of different components before and after the heading stage, and wheat ears make an important contribution to the total backscatter. Therefore, the water-cloud model may be divided into two different stages, which should have different empirical coefficients based on the above analysis. From Fig. 5(a), the soil under wheat is assumed to be a random rough surface and wheat may be treated as a layer over soil; the total backscatter includes the response from wheat and soil. The equation of water-cloud model is as follows:22 where and are the backscattering coefficients for wheat and soil, respectively; is the two-way attenuation through the canopy; is the incidence angle; and are constant coefficients dependent on canopy type and are determined by iterative optimization. From Fig. 5(b), the layer under wheat ears is assumed to be a water layer, and the wheat ears are treated as the cloud layer. AIEM can be used to simulate the backscatter of the “water layer,” and the total backscatter could be obtained. For co-polarization, can be input to connect biomass with backscatter, and the retrieval model can be expressed as where is the retrieval result of biomass. The constants and are empirical parameters of the model, and the subscripts HH and VV represent polarizations. The equation shown above is nonlinear beyond variance group, and an analytical solution is not available. Therefore, an optimization method can be applied by a numerical solution. The expressions of input and output are given as The parameters and can be obtained by AIEM corresponding to the acquisition time of the two ASAR images.The main procedures aim to monitor and map wheat biomass (Fig. 6). Ground-based measurement and space-borne ASAR images were synchronously collected. The ASAR images were processed to perform classification and retrieve backscattering coefficients, while the ground parameters were applied to build the modified water-cloud model and verify the final retrieval results. 5.Results and DiscussionWhen the modified water-cloud models were applied to retrieve biomass, the backscattering coefficients extracted from the ASAR images could output the biomass maps at the two acquisition times. Figure 7 displays the spatial application based on the ASAR images for the two separated periods. As can be seen from the color bar, the biomass maps show the values of wheat biomass. The main values are distributed in the range of 0.1 to and 3.5 to for the two maps, respectively. The corresponding measured biomass values are 0.42 and on December 10 and May 8, respectively, which are the average values for the eight pilot sites selected. The results are consistent with wheat biomass collected on December 10 and May 8. Further, the correlation coefficient between backscatter and biomass is suitable for retrieving biomass at the frequency of 5.3 GHz. Overall, the results demonstrate good performance of the retrieved models based on the water-cloud model. The retrieval values are smaller than the measured values (Fig. 8) and a possible reason is that multiscattering backscatter was discarded in the water-cloud models and the modified water-cloud model. Moreover, the dual-polarizations ASAR images were used to retrieve biomass, as the lack of cross-polarization items would make the inversion results smaller. An -test was used to verify the extraction accuracy.33,34 The average values of the measured biomass are 0.42 and , and of the retrieved biomass are 0.39 and . and are calculated with the square of standard deviation equations and , respectively. According to the rule of -test, is 1.46 on December 10 and is 2.56 on May 8. Since we chose eight experiment points corresponding to the points of the ASAR images, both the measured and retrieved biomass values have seven degrees of freedom. The level of confidence was selected to be 95%; therefore, the critical value of was 3.79. The values are 1.26 on October 12, 2008, and 2.56 on August 5, 2009, in the research, which were lower than the critical value 3.79, so the retrieved parameters were not significantly different from the measured values. 6.ConclusionsThis study systematically analyzed wheat scattering measurements at a frequency of 5.3 GHz with multitemporal and multipolarization variations. To guarantee data robustness, independent samples were considered during ground measurements. Focused on wheat ears, an important component of wheat, the study divided the entire wheat growth cycle into stages with and without wheat ears. The analysis of wheat characteristics was divided into two periods before and after the heading stage for comparing the scattering characteristics without and with wheat ears. Wheat ears proved to be critical in the direct backscatter from canopy and soil backscatter after double attenuations from canopy. In accordance with the ASAR parameters, the incidence angles of 29 deg and 34 deg were selected for the stages with and without wheat ears. For the stages without wheat ears, VV29 had the highest correlation coefficients at 0.94 with biomass, while for the stages with wheat ears, PDR34 had the highest correlation coefficients at 0.95 with biomass. After analyzing the influence of wheat ears on radar backscatter for two separate growth periods before and after the heading stage, the modified water-cloud model was presented for the stage with the wheat ears, with the layer under wheat ears being assumed to be the water layer, and the wheat ears being treated as the cloud layer. AIEM can be used to simulate the backscatter of the “water layer,” and the total backscatter could be obtained. Upon the retrieval of biomass from the ASAR images, the two models were applied to the wheat growth stages with and without wheat ears. The biomass measured at eight experimental points and the ones retrieved corresponding to eight points in the ASAR images were obtained and verified. Further, the -test method was applied to verify the research results, and a confidence level above 95% demonstrated that the modified water-cloud model and the water-cloud model could be successfully used to retrieve biomass for dual-polarization SAR data at two different wheat growth periods, i.e., with and without ears. AcknowledgmentsThis research was supported by the National Natural Science Foundation of China (Grant Nos. 41571333, 41371340, and 60841006). ReferencesF. T. Ulaby, R. K. Moore and A. K. Fung, Microwave Remote Sensing Active and Passive, Vol. II Radar Remote Sensing and Surface Scattering and Emission Theory, Artech House, Norwood, MA
(1982). Google Scholar
M. Jia et al.,
“Multitemporal radar backscattering measurement of wheat fields using multifrequency (L, S, C, and X) and full-polarization,”
Radio Sci., 48
(5), 471
–481
(2013). http://dx.doi.org/10.1002/rds.20048 RASCAD 0048-6604 Google Scholar
J. M. Stiles and K. Sarabandi,
“Electromagnetic scattering from grassland—part I: a fully phase-coherent scattering model,”
IEEE Trans. Geosci. Remote Sens., 38
(1), 339
–348
(2000). http://dx.doi.org/10.1109/36.823929 IGRSD2 0196-2892 Google Scholar
F. T. Ulaby et al.,
“Michigan microwave canopy scattering model,”
Int. J. Remote Sens., 11 1223
–1253
(1990). http://dx.doi.org/10.1080/01431169008955090 IJSEDK 0143-1161 Google Scholar
G. Satalino et al.,
“Wheat crop mapping by using ASAR AP data,”
IEEE Trans. Geosci. Remote Sens, 47
(2), 527
–530
(2009). http://dx.doi.org/10.1109/TGRS.2008.2008026 IGRSD2 0196-2892 Google Scholar
M. Jia et al.,
“Rice biomass retrieval from multi-temporal ground-based scatterometer data and RADARSAT-2 images using neural networks,”
J. Appl. Remote Sens., 7 073509
(2013). http://dx.doi.org/10.1117/1.JRS.7.073509 Google Scholar
M. Jia et al.,
“Rice biomass estimation using radar backscattering data at S-band,”
IEEE J. Sel. Topics Appl. Earth Obs. Remote Sens., 7
(2), 469
–479
(2014). http://dx.doi.org/10.1109/JSTARS.2013.2282641 Google Scholar
M. Jia and L. Tong,
“Ground-based scatterometer measurements and inversion of surface parameters by using neural networks,”
Int. J. Remote Sens., 2
(1), 29
–35
(2011). IJSEDK 0143-1161 Google Scholar
K. Yihyun, J. Thomas and B. Rajat,
“Retrieval of wheat growth parameters with radar vegetation indices,”
IEEE Geosci. Remote Sens. Lett., 11
(4), 808
–812
(2014). http://dx.doi.org/10.1109/LGRS.2013.2279255 Google Scholar
F. Mattia, T. L. Toan and G. Picard,
“Multi-temporal C-band radar measurements on wheat fields,”
IEEE Trans. Geosci. Remote Sens., 41
(7), 1551
–1560
(2003). http://dx.doi.org/10.1109/TGRS.2003.813531 IGRSD2 0196-2892 Google Scholar
H. Mcnairn, K. Hochheim and N. Rabe,
“Applying polarimetric radar imagery for mapping the productivity of wheat crops,”
Can. J. Remote Sens., 30
(3), 517
–524
(2004). http://dx.doi.org/10.5589/m03-068 CJRSDP 0703-8992 Google Scholar
J. M. Stiles, K. Sarabandi and F. T. Ulaby,
“Electromagnetic scattering from grassland. II. Measurement and modeling results,”
IEEE Trans. Geosci. Remote Sens., 38
(1), 349
–356
(2000). http://dx.doi.org/10.1109/36.823930 IGRSD2 0196-2892 Google Scholar
L. He et al.,
“Adaptation of MIMICS model of wheat at multi-band (L, S, C, X),”
in IEEE Int. Geoscience and Remote Sensing Symp. (IGARSS ’15),
(2015). http://dx.doi.org/10.1109/IGARSS.2015.7325749 Google Scholar
B. Huang et al.,
“Backscatter modeling based on vector radiative transfer theory,”
J. Appl. Remote Sens., 9 097093
(2015). http://dx.doi.org/10.1117/1.JRS.9.097093 Google Scholar
X. Huang, J. Wang and J. Shang,
“Simplified adaptive volume scattering model and scattering analysis of crops over agricultural fields using the RADARSAT-2 polarimetric synthetic aperture radar imagery,”
J. Appl. Remote Sens., 9 096026
(2015). http://dx.doi.org/10.1117/1.JRS.9.096026 Google Scholar
G. Fontanelli et al.,
“Sensitivity analysis of X-band SAR to wheat and barley leaf area index in the Merguellil Basin,”
Remote Sens. Lett., 4
(11), 1107
–1116
(2013). http://dx.doi.org/10.1080/2150704X.2013.842285 Google Scholar
X. Juan, L. Zhen and T. Bangsen,
“Polarimetric analysis of multi-temporal Radarsat-2 SAR images for wheat monitoring and mapping,”
Int. J. Remote Sens., 35
(10), 3840
–3858
(2014). http://dx.doi.org/10.1080/01431161.2014.919679 IJSEDK 0143-1161 Google Scholar
W T. S. Crooks and R. A. Cheke,
“Soil moisture assessments for brown locust Locustana pardalina breeding potential using synthetic aperture radar,”
J. Appl. Remote Sens., 8 084898
(2014). http://dx.doi.org/10.1117/1.JRS.8.084898 Google Scholar
M. Hosseini et al.,
“Estimation of leaf area index (LAI) in corn and soybeans using multi-polarization C- and L-band radar data,”
Remote Sens. Environ., 170 77
–89
(2015). http://dx.doi.org/10.1016/j.rse.2015.09.002 Google Scholar
S. Kumar et al.,
“Aboveground biomass estimation of tropical forest from Envisat advanced synthetic aperture radar data using modeling approach,”
J. Appl. Remote Sens., 6 063588
(2012). http://dx.doi.org/10.1117/1.JRS.6.063588 Google Scholar
A. Sharifi and J. Amini,
“Forest biomass estimation using synthetic aperture radar polarimetric features,”
J. Appl. Remote Sens., 9 097695
(2015). http://dx.doi.org/10.1117/1.JRS.9.097695 Google Scholar
E. P. W. Attema and F. T. Ulaby,
“Vegetation modeled as a water cloud,”
Radio Sci., 13 357
–364
(1978). http://dx.doi.org/10.1029/RS013i002p00357 RASCAD 0048-6604 Google Scholar
R. Prasad,
“Estimation of kidney bean crop variables using ground-based scatterometer data at 9.89 GHz,”
Int. J. Remote Sens., 32
(1), 31
–48
(2011). http://dx.doi.org/10.1080/01431160903439866 IJSEDK 0143-1161 Google Scholar
L. Tan et al.,
“Rice biomass retrieval from ASAR image based on radar backscattering measurement,”
J. Appl. Remote Sens., 9 097091
(2015). http://dx.doi.org/10.1117/1.JRS.9.097091 Google Scholar
K. S. Chen et al.,
“Emission of rough surfaces calculated by the integral equation method with comparison to three-dimensional moment method simulations,”
IEEE Trans. Geosci. Remote Sens., 41
(1), 90
–101
(2003). http://dx.doi.org/10.1109/TGRS.2002.807587 IGRSD2 0196-2892 Google Scholar
L. Tao et al.,
“Evaluation of radar backscattering models using L- and C-band synthetic aperture radar data,”
J. Appl. Remote Sens., 9
(1), 094091
(2015). http://dx.doi.org/10.1117/1.JRS.9.094091 Google Scholar
K. Sarabandi and F. T. Ulaby,
“A convenient technique for polarimetric calibration of radar systems,”
IEEE Trans. Geosci. Remote Sens., 28 1022
–1033
(1990). http://dx.doi.org/10.1109/36.62627 IGRSD2 0196-2892 Google Scholar
E. C. Large,
“Growth stages in cereals illustration of the feeks scale,”
Plant Pathology, 3
(4), 128
–129
(1954) http://dx.doi.org/10.1111/j.1365-3059.1954.tb00716.x Google Scholar
H. Lu et al.,
“A new type and facile measuring system of soil roughness,”
in IITA Conf. on Geoscience and Remote Sensing,
115
–118
(2008). Google Scholar
A. Tavakoli, K. Sarabandi and F. T. Ulaby,
“Microwave propagation through cultural vegetation canopies,”
Ann Arbor, Michigan
(1991). Google Scholar
F. T. Ulaby, R. Moore and A. K. Fung, Microwave Remote Sensing Active and Passive, Vol. III, From Theory to Applications, 1206
–1280 Artech House, Norwood, MA
(1986). Google Scholar
D. Singh,
“Scattermeter performance with polarization discrimination ratio approach to retrieve crop soybean parameter at X‐band,”
Int. J. Remote Sens., 27 4101
–4115
(2006). http://dx.doi.org/10.1080/01431160600735988 IJSEDK 0143-1161 Google Scholar
P. Patel and H. S. Srivastava,
“Ground truth planning for synthetic aperture radar (SAR): addressing various challenges using statistical approach,”
Int. J. Adv. Remote Sens. GIS Geogr., 1
(2), 1
–17
(2013). Google Scholar
E.F. Borges, E.E. Sano and E. Medrado,
“Radiometric quality and performance of TIMESAT for smoothing moderate resolution imaging spectro radiometer enhanced vegetation index time series from western Bahia State, Brazil,”
J. Appl. Remote Sens., 8 083580
(2014). http://dx.doi.org/10.1117/1.JRS.8.083580 Google Scholar
BiographyLei He is a doctoral candidate at the School of Automation Engineering at the University of Electronic Science and Technology of China. His current research interests include cereal scattering mechanism, cereal parameters inversion, and information retrieval from SAR images. Ling Tong is a professor in the School of Automation Engineering, University of Electronic Science and Technology of China. Her research interests include remote sensing, microwave millimeter-wave measurement, data processing, forward and inverse modeling. |
|||||||||||||||||||||||||||||||||||||||||||||||||||||||||||||||||||||||||||||||||||||||||||||||||||||||||||||||||||||||||||||||||||||||||||||||||||||||||||||||||||||||||||||||||||||||||||||||||

